
Politics of Australia facts for kids
Australia's government works like a federal parliamentary constitutional monarchy. This means it has a king or queen (the monarch), but elected people make the laws. Australians vote for parliamentarians to join the federal Parliament of Australia. This Parliament has two parts, called two houses. It uses ideas from the British Westminster system and also has a strong Senate, like the United States Congress. Australia mostly has a two-party system, and everyone must vote.
Contents
Who Runs the Country? (Executive Branch)

In Australia, the role of head of state is shared by two people: the King or Queen of Australia and the Governor-General of Australia. The Governor-General has many important jobs. These include choosing ambassadors, ministers, and judges. They also approve new laws and call elections. The Governor-General is also the leader of the Federal Executive Council and the head of the Australian Defence Force.
Even though the Governor-General has these powers, they usually only use them when the Prime Minister tells them to. So, the Governor-General's job is often seen as mostly ceremonial, like a special representative.
The Prime Minister of Australia is the main leader of the government. They are chosen by the Governor-General. The Prime Minister's job is the most powerful political role in Australia. Interestingly, the Australian Constitution doesn't actually mention the Prime Minister's job directly. It exists because of a long-standing political tradition. The Prime Minister is almost always the leader of the political party or group of parties that has the most support in the House of Representatives.
The Cabinet is a group of senior ministers who are responsible to the Parliament. The Governor-General appoints these ministers, but only after the Prime Minister suggests them. The Cabinet meets every week in private to talk about important issues and decide on new policies. There are also junior ministers who help with specific policy areas. The Constitution doesn't officially recognize the Cabinet. Its decisions become legal through the Executive Council, which is usually led by the Governor-General.
Ministers are chosen from the elected members of Parliament. All ministers are expected to support the government's decisions. If a minister cannot publicly support a government action, they are usually expected to resign. However, this doesn't happen very often.
How Australians Vote (Elections)

National elections in Australia happen at least once every three years. The Prime Minister can ask the Governor-General to call an election for the House of Representatives at any time. But elections for the Senate can only happen at certain times set by the Australian Constitution. The last federal election was on 2 July 2016.
For the House of Representatives, Australia uses a special voting system called instant-runoff voting. This system means that votes for smaller parties can end up helping one of the two main parties. The Senate uses a different system called single transferable voting. This system makes it easier for smaller parties to get seats in the Senate.
Because of this, for many years, no single major party has had full control of the Senate. This means that governments often need to get support from smaller parties or independent politicians to pass their laws. Since it's easier for minor parties to get into the Senate than the House of Representatives, they often focus their efforts on the upper house. This is also true in most Australian states.
Main Ideas in Australian Politics

In Australia, the group of parties called the Coalition is generally seen as centre-right. The Labor Party is considered centre-left. Australian conservatism and liberalism are mostly represented by the Coalition. The Labor Party describes itself as social democratic, but it has also supported more liberal economic policies since Bob Hawke was Prime Minister.
Some parts of Australia, like Queensland, Western Australia, and the Northern Territory, are thought to be more conservative. Other areas, such as Victoria, South Australia, Tasmania, and the Australian Capital Territory, are seen as more left-leaning. New South Wales is often considered a politically moderate state that can swing either way.
Since the 2007 elections, how Australians vote has changed. Voters are now more likely to switch between the two main parties or vote for smaller parties. About one in four Australians now vote for a minor party.
Political Parties in Australia
Organized national political parties have been very important in Australia since the country was formed. In the late 1800s, the Australian Labor Party started, representing workers. Other groups joined together to form two main opposing parties: a centre-right party for business and middle-class people, now called the Liberal Party of Australia; and a party for rural areas, now called the National Party of Australia. While a few other parties have won seats in Parliament, these three main parties control most of Australian politics. Only rarely do other parties or independent members play a role in forming or keeping governments.
Australia's politics mostly works as a two-party system. This is because the Liberal Party and the National Party usually work together as a permanent group called the Coalition. Political parties in Australia have historically had strong internal discipline, meaning members usually stick together and vote with their party.
The Australian Labor Party (ALP) is a social democratic party. In recent years, it has also supported economic policies that are more liberal. It was started by the Australian labour movement and generally represents city workers, but it also has support from some middle-class people.
The Liberal Party of Australia is a centre-right party. It mostly represents businesses, middle-class people in the suburbs, and many people in rural areas. Its partner at the national level is the National Party of Australia, which used to be called the Country Party. This party represents rural interests. Together, these two parties are known as the Coalition. In Queensland and sometimes in New South Wales, these two parties have officially joined to form the Liberal National Party. In the Northern Territory, the National Party is called the Country Liberal Party.
Smaller parties in Australian politics include the Australian Greens, which focuses on environmental issues and is the largest minor party. There is also a centrist party, Nick Xenophon Team; a nationalist party, Pauline Hanson's One Nation; and a party against privatisation, Katter's Australian Party. Other important parties in recent years have included the Palmer United Party, the socially conservative Family First Party, and the socially liberal Australian Democrats.
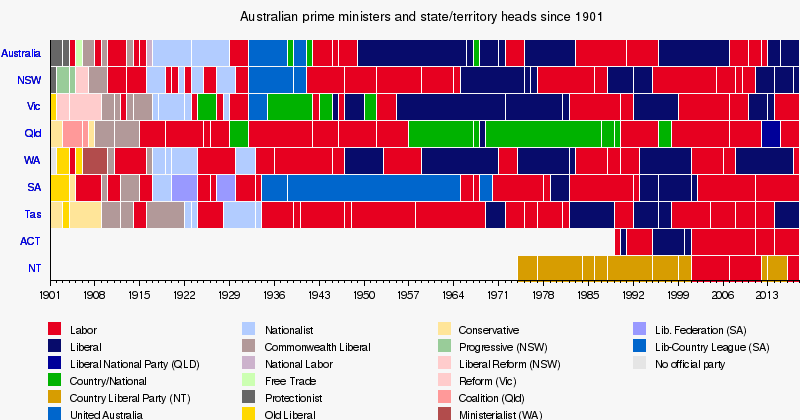
Australian Prime Ministers: A Look Back
Since Australia became a federation, there have been 29 Prime Ministers. The Prime Minister who served the longest was Sir Robert Menzies from the Liberal Party. He was Prime Minister for 19 years in total, from 1939–41 and again from 1949–66. The only other Prime Minister to serve for more than ten years was John Howard, also from the Liberal Party, who led for over 11 years from 1996–2007. The Coalition and its earlier versions have governed Australia for most of its history since federation.
How Long Each Party Has Been in Charge
- Liberal Party of Australia – 20019 days as of 18 July 2026.
- Australian Labor Party – Expression error: Unexpected < operator. days
- Nationalist Party – 5142 days (Party no longer exists)
- United Australia Party – 3505 days (Party no longer exists)
- Protectionist Party – 2442 days (Party no longer exists)
- Commonwealth Liberal Party – 783 days (Party no longer exists)
- Free Trade Party – 322 days (Party no longer exists)
- Country Party – 84 days (Party changed its name)
 |
Images for kids
-
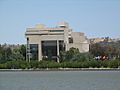
The High Court building, seen from Lake Burley Griffin.

.jpg)
See also
 In Spanish: Política de Australia para niños
