Bourbon County, Kentucky facts for kids
Quick facts for kids
Bourbon County
|
|
|---|---|

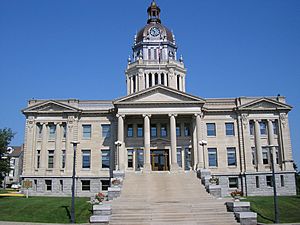
Bourbon County Courthouse in Paris
|
|

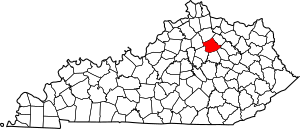
Location within the U.S. state of Kentucky
|
|
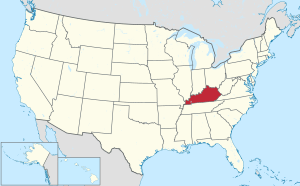
 Kentucky's location within the U.S. |
|
| Country | |
| State | |
| Founded | 1785 |
| Named for | House of Bourbon |
| Seat | Paris |
| Largest city | Paris |
| Area | |
| • Total | 292 sq mi (760 km2) |
| • Land | 290 sq mi (800 km2) |
| • Water | 1.9 sq mi (5 km2) 0.6%% |
| Population
(2020)
|
|
| • Total | 20,252 |
| • Estimate
(2024)
|
20,333 |
| • Density | 69.36/sq mi (26.78/km2) |
| Time zone | UTC−5 (Eastern) |
| • Summer (DST) | UTC−4 (EDT) |
| Congressional district | 6th |
Bourbon County is a county located in the state of Kentucky, United States. As of the 2020 census, about 20,252 people lived there. The county's main town and county seat is Paris. Bourbon County is part of the larger Lexington-Fayette area. It is one of Kentucky's first nine counties. It is well-known for its connection to a type of American whiskey called bourbon.
Contents
History of Bourbon County
How Bourbon County Got Its Name
Bourbon County was created in 1785. It was formed from a part of Fayette County, Virginia. The county was named after the French House of Bourbon. This was to show thanks to Louis XVI of France for his help during the American Revolutionary War.
The Original "Old Bourbon" Area
The original Bourbon County, Virginia, was much larger than it is today. It included 34 of Kentucky's current 120 counties. This big area was later called Old Bourbon. When Kentucky became a new state in 1792, Bourbon County became part of it.
The Story of Bourbon Whiskey
A type of grain alcohol called whiskey was made in this area very early on. When barrels of this whiskey were shipped down the Ohio River, they were often marked Old Bourbon. This whiskey was mostly made from corn. It had a special taste. The name bourbon started to be used to tell it apart from other whiskeys. For example, Monongahela whiskey from Pennsylvania was often made from rye.
The port where the whiskey was shipped was first called Limestone. Today, it is known as Maysville. This port was part of Bourbon County until 1789. Then, the borders changed, and it became part of Mason County.
Prohibition and Distilleries
In 1919, a law called Prohibition made it illegal to make or sell alcohol in the United States. Kentucky had adopted this law a year earlier. Before Prohibition, there were about 26 places that made bourbon in Bourbon County. All of these places closed down in 1919. No new distilleries opened in the county until late 2014, which was 95 years later.
Bourbon County Courthouses
The county courthouse was damaged by fire two times. Fires in 1872 and 1901 destroyed many county records. The building used as the courthouse today is the fourth one the county has had.
Geography and Nature
Bourbon County covers a total area of about 292 square miles. Most of this area, about 290 square miles, is land. Only a small part, about 1.9 square miles, is water.
There are no large lakes in the county. However, there are several streams. The most important stream is Stoner Creek. The county seat, Paris, is located on this creek. Stoner Creek flows into the South Fork of the Licking River.
The land in Bourbon County mostly has gentle, rolling hills. Because of farming, not much of the county is covered in forests. But you can still see many deciduous trees (trees that lose their leaves) across the landscape.
Neighboring Counties
Bourbon County shares its borders with several other counties:
- Harrison County (to the northwest)
- Nicholas County (to the northeast)
- Bath County (to the east)
- Montgomery County (to the southeast)
- Clark County (to the south)
- Fayette County (to the southwest)
- Scott County (to the west)
Population Information
| Historical population | |||
|---|---|---|---|
| Census | Pop. | %± | |
| 1790 | 7,837 | — | |
| 1800 | 12,825 | 63.6% | |
| 1810 | 18,009 | 40.4% | |
| 1820 | 17,664 | −1.9% | |
| 1830 | 18,436 | 4.4% | |
| 1840 | 14,478 | −21.5% | |
| 1850 | 14,466 | −0.1% | |
| 1860 | 14,860 | 2.7% | |
| 1870 | 14,863 | 0.0% | |
| 1880 | 15,956 | 7.4% | |
| 1890 | 16,976 | 6.4% | |
| 1900 | 18,069 | 6.4% | |
| 1910 | 17,462 | −3.4% | |
| 1920 | 18,418 | 5.5% | |
| 1930 | 18,060 | −1.9% | |
| 1940 | 17,932 | −0.7% | |
| 1950 | 17,752 | −1.0% | |
| 1960 | 18,178 | 2.4% | |
| 1970 | 18,476 | 1.6% | |
| 1980 | 19,405 | 5.0% | |
| 1990 | 19,236 | −0.9% | |
| 2000 | 19,360 | 0.6% | |
| 2010 | 19,985 | 3.2% | |
| 2020 | 20,252 | 1.3% | |
| 2024 (est.) | 20,333 | 1.7% | |
| US Decennial Census 1790-1960 1900–1990 1990-2000 2010–2020 |
|||
According to the census from 2010, there were about 19,985 people living in Bourbon County. The population density was about 66 people per square mile. About 90% of the people were White, and about 7% were Black or African American. About 2.6% of the population identified as Hispanic or Latino.
In 2010, about 25% of the population was under 18 years old. The average age in the county was 38 years.
Bourbon County has a public school system. It runs six schools and serves about 2,674 students.
Towns and Communities
Cities in Bourbon County
- Millersburg
- North Middletown
- Paris (This is the county seat, meaning it's the main administrative town.)
Smaller Communities
These are smaller areas that are not officially cities:
- Cane Ridge
- Centerville
- Clintonville
- Little Rock
- Ruddles Mills
Politics and Government
| Year | Republican | Democratic | Third party | |||
|---|---|---|---|---|---|---|
| No. | % | No. | % | No. | % | |
| 2024 | 6,284 | 65.89% | 3,088 | 32.38% | 165 | 1.73% |
| 2020 | 6,190 | 64.16% | 3,296 | 34.16% | 162 | 1.68% |
| 2016 | 5,569 | 63.26% | 2,791 | 31.71% | 443 | 5.03% |
| 2012 | 4,692 | 59.22% | 3,075 | 38.81% | 156 | 1.97% |
| 2008 | 4,820 | 57.86% | 3,385 | 40.64% | 125 | 1.50% |
| 2004 | 4,953 | 60.28% | 3,198 | 38.92% | 66 | 0.80% |
| 2000 | 3,881 | 54.65% | 3,048 | 42.92% | 173 | 2.44% |
| 1996 | 2,592 | 41.42% | 3,030 | 48.42% | 636 | 10.16% |
| 1992 | 2,707 | 39.12% | 2,895 | 41.84% | 1,318 | 19.05% |
| 1988 | 3,308 | 53.57% | 2,793 | 45.23% | 74 | 1.20% |
| 1984 | 3,836 | 58.54% | 2,649 | 40.42% | 68 | 1.04% |
| 1980 | 2,475 | 39.00% | 3,641 | 57.37% | 230 | 3.62% |
| 1976 | 2,260 | 38.28% | 3,504 | 59.35% | 140 | 2.37% |
| 1972 | 3,180 | 62.02% | 1,860 | 36.28% | 87 | 1.70% |
| 1968 | 1,848 | 33.85% | 2,566 | 47.00% | 1,046 | 19.16% |
| 1964 | 1,222 | 22.99% | 4,068 | 76.52% | 26 | 0.49% |
| 1960 | 2,379 | 42.98% | 3,156 | 57.02% | 0 | 0.00% |
| 1956 | 2,475 | 42.75% | 3,263 | 56.36% | 52 | 0.90% |
| 1952 | 2,229 | 40.02% | 3,339 | 59.95% | 2 | 0.04% |
| 1948 | 1,610 | 29.64% | 3,562 | 65.57% | 260 | 4.79% |
| 1944 | 1,957 | 33.72% | 3,828 | 65.97% | 18 | 0.31% |
| 1940 | 2,673 | 38.57% | 4,254 | 61.38% | 4 | 0.06% |
| 1936 | 2,471 | 38.83% | 3,872 | 60.84% | 21 | 0.33% |
| 1932 | 2,820 | 37.09% | 4,759 | 62.59% | 25 | 0.33% |
| 1928 | 4,512 | 58.34% | 3,218 | 41.61% | 4 | 0.05% |
| 1924 | 3,691 | 47.06% | 4,034 | 51.43% | 118 | 1.50% |
| 1920 | 4,029 | 42.30% | 5,452 | 57.24% | 43 | 0.45% |
| 1916 | 2,167 | 44.04% | 2,715 | 55.18% | 38 | 0.77% |
| 1912 | 1,744 | 38.32% | 2,362 | 51.90% | 445 | 9.78% |
For most of the 1900s, Bourbon County usually voted for the Democratic Party. However, since the early 2000s, it has become a county that mostly votes for the Republican Party.
In the 2020 presidential election, the county supported Donald Trump. He received about 64% of the votes, while Joe Biden received about 34%.
Elected Representatives
Here are some of the people who represent Bourbon County in government as of early 2025:
| Elected officials as of January 3, 2025 | ||
| U.S. House | Andy Barr (R) | KY 6 |
|---|---|---|
| Ky. Senate | Stephen West (R) | 27 |
| Ky. House | Matthew Koch (R) | 72 |
Famous People from Bourbon County
- Mitchell Dazey (1820–1896), a politician and farmer from Illinois, was born in Bourbon County.
- Mary Rootes Thornton McAboy (1815–1892), a poet.
Related Topics
See also
 In Spanish: Condado de Bourbon (Kentucky) para niños
 | Kyle Baker |
 | Joseph Yoakum |
 | Laura Wheeler Waring |
 | Henry Ossawa Tanner |

