kids encyclopedia robot

COVID-19 pandemic in the San Francisco Bay Area facts for kids
Kids Encyclopedia Facts
Quick facts for kids
COVID-19 pandemic in the San Francisco Bay Area
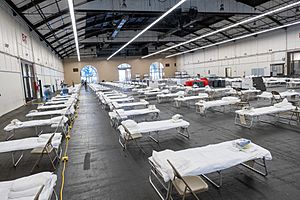
Federal Medical Station, San Mateo County Event Center (17).jpg
A Federal Medical Station in San Mateo shortly after it opened
Disease COVID-19
Virus strain SARS-CoV-2
Location San Francisco Bay Area, California, U.S.
First case Santa Clara County
Arrival date Error: Invalid time.
Origin Wuhan, Hubei, China
Confirmed cases Lua error in Module:Medical_cases_data at line 64: attempt to index field 'wikibase' (a nil value). in 9 counties
Recovered Lua error in Module:Medical_cases_data at line 64: attempt to index field 'wikibase' (a nil value). in Lua error in Module:Medical_cases_data at line 64: attempt to index field 'wikibase' (a nil value). counties
Deaths
Lua error in Module:Medical_cases_data at line 64: attempt to index field 'wikibase' (a nil value). in 9 counties

The San Francisco Bay Area, which includes the major cities of San Jose, San Francisco, and Oakland, was an early center of the COVID-19 pandemic in California. The first case of COVID-19 in the area was confirmed in Santa Clara County on January 31, 2020. A Santa Clara County resident (with no foreign travel history) was the earliest known death caused by COVID-19 in the United States, on February 6, suggesting that community spread of COVID-19 had been occurring long before any actual documented case. This article covers the 13 members of ABAHO, which includes the nine-county Bay Area plus the counties of Monterey, San Benito, and Santa Cruz.

Local officials instituted some of the first mitigation efforts in the United States. The first mandatory stay-at-home order in the mainland U.S. took effect throughout the Bay Area on March 16 and 17 and continued until mid-May, affecting nearly 6.7 million people. The early government response is credited with mitigating the spread of infection compared to cities on the East Coast.

Closures due to the pandemic have resulted in mass unemployment and significant disruptions to the economy, replacing local governments' budget surpluses with historic deficits. The pandemic accelerated the adoption of distance education among schools and remote work among businesses, especially in the technology industry. Air quality around San Francisco Bay improved as a result of a temporary decline in traffic volume.

Prevalence

Lua error in Module:Medical_cases_data at line 64: attempt to index field 'wikibase' (a nil value). Lua error in Module:Medical_cases_data at line 64: attempt to index field 'wikibase' (a nil value).

Despite strong economic, cultural, and travel ties between California and China, the Bay Area's hospitalization rate and death toll have stayed below initial projections and have compared favorably to East Coast cities. Researchers have hypothesized that the pandemic's initial impact was blunted by relatively early social distancing measures along with a variety of other factors, including lower population density, a strong car culture and low public transportation ridership, favorable weather in February, and even a loss by the San Francisco 49ers at Super Bowl LIV, discouraging celebrations.

As of May 26,  2020 (2020 -05-26), the nine counties of the Bay Area plus Santa Cruz County have reported a cumulative total of 13,060 confirmed cases and 434 confirmed deaths due to COVID-19. Alameda County has more confirmed cases and deaths than any other county in Northern California, followed by Contra Costa County. Some counties have released breakdowns of cases by jurisdiction. In Alameda County, Hayward has the highest per capita rate of infection at 270.2 people per every 100,000, while Oakland has the highest number of cases. San Mateo and San Jose have the highest number of cases in San Mateo and Santa Clara counties, respectively.

As of May 17,  2020 (2020 -05-17), the North Bay counties of Marin, Napa, and Sonoma have reported a cumulative total of 345 recoveries from COVID-19. The other Bay Area counties do not report the number of recoveries, because tracking this number requires more resources per case and federal guidelines are not specific enough to draw conclusions. A study at the University of California, San Francisco (UCSF), is tracking outcomes several months after infection.

The Hispanic population in the Bay Area has been disproportionately affected by infections. The poor, largely Latino neighborhoods in East San Jose account for 34% of Santa Clara County's first deaths due to COVID-19 despite being Latinos making up only 23% of the adult population. Almost 70% of the neighborhoods' working-age population is unable to remote work. Also Filipino Americans in the Bay Area have also been disproportionately affected by COVID-19 infections, and make up the majority of cases in San Mateo County, California. In San Francisco, about 40% of Hispanics have been confirmed infected, compared to 15% of the general population. The largely Latino Mission District has the highest number of cases of any neighborhood, with more than 40 cases per 10,000 residents. UCSF systematically tested 2,959 residents in a 16-block census tract in the Mission District in April, finding that 2% tested positive. Infection rates differed significantly between essential workers and residents who were able to stay at home during the pandemic.

Localized outbreaks of COVID-19 have occurred at factories and care facilities, including the Tesla factory in Fremont where over 130 people tested positive, the Lusamerica Foods fish packing plant in Morgan Hill where 38 people tested positive, the Central Gardens skilled nursing home in San Francisco's Western Addition where four residents died, and the Windsor Vallejo Care Center in Vallejo where more than 130 people became infected and eleven residents died.

The number of confirmed cases is believed to fall significantly short of actual infection rates due to limited testing capacity throughout the pandemic. As of May 20,  2020 (2020 -05-20), San Francisco has collected 5,000 tests for every 100,000 residents, while Santa Clara County has collected about 2,600 tests for every 100,000 residents. Santa Clara County set up three testing sites in San Jose, but the sites are operating well below capacity, in part because of Spanish- and Vietnamese-language barriers.

Several local studies have attempted to determine seroprevalence in the absence of widespread clinical testing. Based on serology tests in early April, a revised preprint study from Stanford University estimated that Santa Clara County up to 54,000 residents, or 2.8% of the population, had been infected, compared to the 1,000 confirmed cases at the time. In an earlier preprint, the study's authors had estimated an even higher rate of infection but therefore calculated a lower mortality rate. Despite academic controversy over the study's methodology, which prompted the revision, the preprint fueled opposition to stay-at-home orders in the United States. The university has begun an investigation into the study. In addition to its study in San Francisco's Mission District, UCSF is conducting a similar study of all 1,680 residents in the rural community of Bolinas, and the University of California, Berkeley, is testing a representative sample of 5,000 East Bay residents.

In October 2020, Santa Clara County began wastewater surveillance of the SARS-CoV-2 virus's RNA at the San José–Santa Clara Regional Wastewater Facility and three other regional wastewater treatment plants in Palo Alto, Sunnyvale, and Gilroy, which together serve the vast majority of residents in the county.

Progression

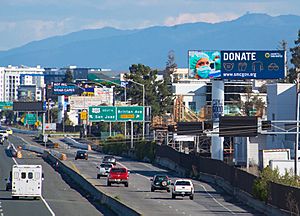
Billboard in San Carlos - donate PPE
A billboard along U.S. Route 101 in San Carlos encourages San Mateo County residents to donate personal protective equipment to healthcare workers.

Early cases

There has been speculation that COVID-19 may have been circulating in the Bay Area by December 2019. Ongoing "lookback studies" are attempting to identify the index case. An initial preprint of a study at Stanford University Medical Center has found no infected samples from November and December 2019. As of February 14,  2021 (2021 -02-14), the earliest known cases in Santa Clara County have been dated to January 27, 2020.

On January 31, 2020, the Centers for Disease Control and Prevention (CDC) announced the first confirmed case of COVID-19 in the Bay Area and the seventh in the United States, a man in Santa Clara County who had recently traveled to Wuhan. The man recovered at home and was released from in-home isolation on February 20. On February 2, the CDC confirmed a second area case in a Santa Clara County woman who had also recently traveled to Wuhan. The two cases were unrelated.

On February 6, 2020, 57-year-old Patricia Dowd of San Jose died of COVID-19 without any known recent foreign travel. She had been unusually sick from the flu in late January, then recovered, remote worked, and suddenly died at home on February 6. A February 7 autopsy was completed in April (after virus tests on tissue samples) and attributed the death to transmural myocardial ischemia (infarction) with a minor component of myocarditis due to COVID-19 infection. Her case was discovered in April 2020; from then until August 2021, she was considered to have been the first COVID-19-related death in the U.S. It indicated that community transmission was happening undetected in the U.S., most likely since December 2019.

On February 26, 2020, a case of unknown origin was confirmed in a resident of Solano County. The UC Davis Medical Center in Sacramento said that, when the person was transferred there on February 19, the medical team suspected it was COVID-19 and asked the CDC to test for SARS-CoV-2. The CDC initially refused since the person, who had no known exposure to the virus through travel or close contact with a known infected individual, did not meet the criteria for testing. The person was ultimately tested on February 23; the test results returned positive on February 26.

After this first case of community transmission in the U.S., the CDC revised its criteria for testing patients for SARS-CoV-2 and, on February 28, began sending out the new guidelines for healthcare workers.

The first case of the Omicron variant detected in the United States was also located in the Bay Area. A resident of San Francisco returned from South Africa on November 22, 2021, began showing mild symptoms on November 25, and was confirmed to have COVID-19 on November 29. The individual had been vaccinated but had not received a booster shot.

Cases by county over time

<graph> { // // ATTENTION: This code is maintained at https://www.mediawiki.org/wiki/Template:Graph:Lines // Please do not modify it anywhere else, as it may get copied and override your changes. // Suggestions can be made at https://www.mediawiki.org/wiki/Template_talk:Graph:Lines // // Template translation is in https://commons.wikimedia.org/wiki/Data:Original/Template:Graphs.tab //

"version": 2, "width": 800, "height": 300, "padding": "strict",

"signals": [{"name": "rightwidth", "expr": "width + padding.right"}], "data": [{ "name": "chart",

"url": "tabular:///COVID-19 cases in Alameda County, California.tab", "format": {"type": "json" , "property": "data" , "parse": {"date": "date"} }, "transform": [ // Convert xField parameter into a field "_xfield" {"type": "formula", "field": "_xfield", "expr": "datum.date" } , {"type": "sort", "by": ["_xfield"]} , {"type": "fold", "fields": ["AC_CumulCases","AC_CumulDeaths"]} , {"type": "formula", "field": "_yfield", "expr": "datum.value" }

] }, { "name": "labels", "url": "tabular:///COVID-19 cases in Alameda County, California.tab", "format": {"type": "json", "property": "fields"} } ], "scales": [ { "name": "x", "type": "time", "domain": {"data": "chart", "field": "_xfield"}, "range": "width",


}, { "name": "y", "type": "linear", "range": "height", "domain": {"data": "chart", "field": "_yfield"}, "zero": false,


}, { "name": "color", "type": "ordinal", "domain": {"data": "chart", "field": "key"}, "range": "category10" }, { "name": "labels", "type": "ordinal", "domain": {"data": "labels", "field": "name"}, "range": {"data": "labels", "field": "title"}, } ], "legends": [{ "fill": "color", "stroke": "color",

"properties": { "labels": { "text": {"scale": "labels", "field": "data"} } } }], "axes": [ {"scale": "x", "type": "x", "tickSizeEnd": 0 , "ticks": 7


}, {"scale": "y", "type": "y", "tickSizeEnd": 0


, "grid": true } ],

"marks": [ // Group data by the group parameter or "key", and draw lines, one line per group { "type": "group", "from": { "data": "chart", "transform": [{"type": "facet", "groupby": ["key"]}] }, "marks": [ { "type": "line", "properties": { "enter": { "y": {"scale": "y", "field": "_yfield"}, "x": {"scale": "x", "field": "_xfield"}, "stroke": {"scale": "color", "field": "key"}, "interpolate": {"value": "monotone"}, "strokeWidth": {"value": 2.5} } } } ], }

// Draw title at the top of the graph , { "type": "text", "properties": { "enter": { "x": {"signal": "rightwidth", "mult": 0.5}, "y": {"value": -15}, "text": {"value": "COVID-19 cases in Alameda County, California"}, "fontWeight": {"value": "bold"}, "align": {"value": "center"}, "baseline": {"value": "bottom"}, "fill": {"value": "#000"} } } } ] } </graph> Lua error in Module:TNT at line 159: Missing JsonConfig extension; Cannot load https://commons.wikimedia.org/wiki/Data:I18n/Template:Graphs.tab..

<graph> { // // ATTENTION: This code is maintained at https://www.mediawiki.org/wiki/Template:Graph:Lines // Please do not modify it anywhere else, as it may get copied and override your changes. // Suggestions can be made at https://www.mediawiki.org/wiki/Template_talk:Graph:Lines // // Template translation is in https://commons.wikimedia.org/wiki/Data:Original/Template:Graphs.tab //

"version": 2, "width": 800, "height": 300, "padding": "strict",

"signals": [{"name": "rightwidth", "expr": "width + padding.right"}], "data": [{ "name": "chart",

"url": "tabular:///COVID-19 cases in Contra Costa County, California.tab", "format": {"type": "json" , "property": "data" , "parse": {"date": "date"} }, "transform": [ // Convert xField parameter into a field "_xfield" {"type": "formula", "field": "_xfield", "expr": "datum.date" } , {"type": "sort", "by": ["_xfield"]} , {"type": "fold", "fields": ["totalConfirmedCases","deaths"]} , {"type": "formula", "field": "_yfield", "expr": "datum.value" }

] }, { "name": "labels", "url": "tabular:///COVID-19 cases in Contra Costa County, California.tab", "format": {"type": "json", "property": "fields"} } ], "scales": [ { "name": "x", "type": "time", "domain": {"data": "chart", "field": "_xfield"}, "range": "width",


}, { "name": "y", "type": "linear", "range": "height", "domain": {"data": "chart", "field": "_yfield"}, "zero": false,


}, { "name": "color", "type": "ordinal", "domain": {"data": "chart", "field": "key"}, "range": "category10" }, { "name": "labels", "type": "ordinal", "domain": {"data": "labels", "field": "name"}, "range": {"data": "labels", "field": "title"}, } ], "legends": [{ "fill": "color", "stroke": "color",

"properties": { "labels": { "text": {"scale": "labels", "field": "data"} } } }], "axes": [ {"scale": "x", "type": "x", "tickSizeEnd": 0 , "ticks": 7


}, {"scale": "y", "type": "y", "tickSizeEnd": 0


, "grid": true } ],

"marks": [ // Group data by the group parameter or "key", and draw lines, one line per group { "type": "group", "from": { "data": "chart", "transform": [{"type": "facet", "groupby": ["key"]}] }, "marks": [ { "type": "line", "properties": { "enter": { "y": {"scale": "y", "field": "_yfield"}, "x": {"scale": "x", "field": "_xfield"}, "stroke": {"scale": "color", "field": "key"}, "interpolate": {"value": "monotone"}, "strokeWidth": {"value": 2.5} } } } ], }

// Draw title at the top of the graph , { "type": "text", "properties": { "enter": { "x": {"signal": "rightwidth", "mult": 0.5}, "y": {"value": -15}, "text": {"value": "COVID-19 cases in Contra Costa County, California"}, "fontWeight": {"value": "bold"}, "align": {"value": "center"}, "baseline": {"value": "bottom"}, "fill": {"value": "#000"} } } } ] } </graph> Lua error in Module:TNT at line 159: Missing JsonConfig extension; Cannot load https://commons.wikimedia.org/wiki/Data:I18n/Template:Graphs.tab..

<graph> { // // ATTENTION: This code is maintained at https://www.mediawiki.org/wiki/Template:Graph:Lines // Please do not modify it anywhere else, as it may get copied and override your changes. // Suggestions can be made at https://www.mediawiki.org/wiki/Template_talk:Graph:Lines // // Template translation is in https://commons.wikimedia.org/wiki/Data:Original/Template:Graphs.tab //

"version": 2, "width": 800, "height": 300, "padding": "strict",

"signals": [{"name": "rightwidth", "expr": "width + padding.right"}], "data": [{ "name": "chart",

"url": "tabular:///COVID-19 cases in Marin County, California.tab", "format": {"type": "json" , "property": "data" , "parse": {"date": "date"} }, "transform": [ // Convert xField parameter into a field "_xfield" {"type": "formula", "field": "_xfield", "expr": "datum.date" } , {"type": "sort", "by": ["_xfield"]} , {"type": "fold", "fields": ["totalConfirmedCases","deaths"]} , {"type": "formula", "field": "_yfield", "expr": "datum.value" }

] }, { "name": "labels", "url": "tabular:///COVID-19 cases in Marin County, California.tab", "format": {"type": "json", "property": "fields"} } ], "scales": [ { "name": "x", "type": "time", "domain": {"data": "chart", "field": "_xfield"}, "range": "width",


}, { "name": "y", "type": "linear", "range": "height", "domain": {"data": "chart", "field": "_yfield"}, "zero": false,


}, { "name": "color", "type": "ordinal", "domain": {"data": "chart", "field": "key"}, "range": "category10" }, { "name": "labels", "type": "ordinal", "domain": {"data": "labels", "field": "name"}, "range": {"data": "labels", "field": "title"}, } ], "legends": [{ "fill": "color", "stroke": "color",

"properties": { "labels": { "text": {"scale": "labels", "field": "data"} } } }], "axes": [ {"scale": "x", "type": "x", "tickSizeEnd": 0 , "ticks": 7


}, {"scale": "y", "type": "y", "tickSizeEnd": 0


, "grid": true } ],

"marks": [ // Group data by the group parameter or "key", and draw lines, one line per group { "type": "group", "from": { "data": "chart", "transform": [{"type": "facet", "groupby": ["key"]}] }, "marks": [ { "type": "line", "properties": { "enter": { "y": {"scale": "y", "field": "_yfield"}, "x": {"scale": "x", "field": "_xfield"}, "stroke": {"scale": "color", "field": "key"}, "interpolate": {"value": "monotone"}, "strokeWidth": {"value": 2.5} } } } ], }

// Draw title at the top of the graph , { "type": "text", "properties": { "enter": { "x": {"signal": "rightwidth", "mult": 0.5}, "y": {"value": -15}, "text": {"value": "COVID-19 cases in Marin County, California"}, "fontWeight": {"value": "bold"}, "align": {"value": "center"}, "baseline": {"value": "bottom"}, "fill": {"value": "#000"} } } } ] } </graph> Lua error in Module:TNT at line 159: Missing JsonConfig extension; Cannot load https://commons.wikimedia.org/wiki/Data:I18n/Template:Graphs.tab..

<graph> { // // ATTENTION: This code is maintained at https://www.mediawiki.org/wiki/Template:Graph:Lines // Please do not modify it anywhere else, as it may get copied and override your changes. // Suggestions can be made at https://www.mediawiki.org/wiki/Template_talk:Graph:Lines // // Template translation is in https://commons.wikimedia.org/wiki/Data:Original/Template:Graphs.tab //

"version": 2, "width": 800, "height": 300, "padding": "strict",

"signals": [{"name": "rightwidth", "expr": "width + padding.right"}], "data": [{ "name": "chart",

"url": "tabular:///COVID-19 cases in Napa County, California.tab", "format": {"type": "json" , "property": "data" , "parse": {"date": "date"} }, "transform": [ // Convert xField parameter into a field "_xfield" {"type": "formula", "field": "_xfield", "expr": "datum.date" } , {"type": "sort", "by": ["_xfield"]} , {"type": "fold", "fields": ["totalConfirmedCases","deaths"]} , {"type": "formula", "field": "_yfield", "expr": "datum.value" }

] }, { "name": "labels", "url": "tabular:///COVID-19 cases in Napa County, California.tab", "format": {"type": "json", "property": "fields"} } ], "scales": [ { "name": "x", "type": "time", "domain": {"data": "chart", "field": "_xfield"}, "range": "width",


}, { "name": "y", "type": "linear", "range": "height", "domain": {"data": "chart", "field": "_yfield"}, "zero": false,


}, { "name": "color", "type": "ordinal", "domain": {"data": "chart", "field": "key"}, "range": "category10" }, { "name": "labels", "type": "ordinal", "domain": {"data": "labels", "field": "name"}, "range": {"data": "labels", "field": "title"}, } ], "legends": [{ "fill": "color", "stroke": "color",

"properties": { "labels": { "text": {"scale": "labels", "field": "data"} } } }], "axes": [ {"scale": "x", "type": "x", "tickSizeEnd": 0 , "ticks": 7


}, {"scale": "y", "type": "y", "tickSizeEnd": 0


, "grid": true } ],

"marks": [ // Group data by the group parameter or "key", and draw lines, one line per group { "type": "group", "from": { "data": "chart", "transform": [{"type": "facet", "groupby": ["key"]}] }, "marks": [ { "type": "line", "properties": { "enter": { "y": {"scale": "y", "field": "_yfield"}, "x": {"scale": "x", "field": "_xfield"}, "stroke": {"scale": "color", "field": "key"}, "interpolate": {"value": "monotone"}, "strokeWidth": {"value": 2.5} } } } ], }

// Draw title at the top of the graph , { "type": "text", "properties": { "enter": { "x": {"signal": "rightwidth", "mult": 0.5}, "y": {"value": -15}, "text": {"value": "COVID-19 cases in Napa County, California"}, "fontWeight": {"value": "bold"}, "align": {"value": "center"}, "baseline": {"value": "bottom"}, "fill": {"value": "#000"} } } } ] } </graph> Lua error in Module:TNT at line 159: Missing JsonConfig extension; Cannot load https://commons.wikimedia.org/wiki/Data:I18n/Template:Graphs.tab..

<graph> { // // ATTENTION: This code is maintained at https://www.mediawiki.org/wiki/Template:Graph:Lines // Please do not modify it anywhere else, as it may get copied and override your changes. // Suggestions can be made at https://www.mediawiki.org/wiki/Template_talk:Graph:Lines // // Template translation is in https://commons.wikimedia.org/wiki/Data:Original/Template:Graphs.tab //

"version": 2, "width": 800, "height": 300, "padding": "strict",

"signals": [{"name": "rightwidth", "expr": "width + padding.right"}], "data": [{ "name": "chart",

"url": "tabular:///COVID-19 cases in San Francisco.tab", "format": {"type": "json" , "property": "data" , "parse": {"date": "date"} }, "transform": [ // Convert xField parameter into a field "_xfield" {"type": "formula", "field": "_xfield", "expr": "datum.date" } , {"type": "sort", "by": ["_xfield"]} , {"type": "fold", "fields": ["totalConfirmedCases","totalDeaths"]} , {"type": "formula", "field": "_yfield", "expr": "datum.value" }

] }, { "name": "labels", "url": "tabular:///COVID-19 cases in San Francisco.tab", "format": {"type": "json", "property": "fields"} } ], "scales": [ { "name": "x", "type": "time", "domain": {"data": "chart", "field": "_xfield"}, "range": "width",


}, { "name": "y", "type": "linear", "range": "height", "domain": {"data": "chart", "field": "_yfield"}, "zero": false,


}, { "name": "color", "type": "ordinal", "domain": {"data": "chart", "field": "key"}, "range": "category10" }, { "name": "labels", "type": "ordinal", "domain": {"data": "labels", "field": "name"}, "range": {"data": "labels", "field": "title"}, } ], "legends": [{ "fill": "color", "stroke": "color",

"properties": { "labels": { "text": {"scale": "labels", "field": "data"} } } }], "axes": [ {"scale": "x", "type": "x", "tickSizeEnd": 0 , "ticks": 7


}, {"scale": "y", "type": "y", "tickSizeEnd": 0


, "grid": true } ],

"marks": [ // Group data by the group parameter or "key", and draw lines, one line per group { "type": "group", "from": { "data": "chart", "transform": [{"type": "facet", "groupby": ["key"]}] }, "marks": [ { "type": "line", "properties": { "enter": { "y": {"scale": "y", "field": "_yfield"}, "x": {"scale": "x", "field": "_xfield"}, "stroke": {"scale": "color", "field": "key"}, "interpolate": {"value": "monotone"}, "strokeWidth": {"value": 2.5} } } } ], }

// Draw title at the top of the graph , { "type": "text", "properties": { "enter": { "x": {"signal": "rightwidth", "mult": 0.5}, "y": {"value": -15}, "text": {"value": "COVID-19 cases in San Francisco"}, "fontWeight": {"value": "bold"}, "align": {"value": "center"}, "baseline": {"value": "bottom"}, "fill": {"value": "#000"} } } } ] } </graph> Lua error in Module:TNT at line 159: Missing JsonConfig extension; Cannot load https://commons.wikimedia.org/wiki/Data:I18n/Template:Graphs.tab..

<graph> { // // ATTENTION: This code is maintained at https://www.mediawiki.org/wiki/Template:Graph:Lines // Please do not modify it anywhere else, as it may get copied and override your changes. // Suggestions can be made at https://www.mediawiki.org/wiki/Template_talk:Graph:Lines // // Template translation is in https://commons.wikimedia.org/wiki/Data:Original/Template:Graphs.tab //

"version": 2, "width": 800, "height": 300, "padding": "strict",

"signals": [{"name": "rightwidth", "expr": "width + padding.right"}], "data": [{ "name": "chart",

"url": "tabular:///COVID-19 cases in San Mateo County, California.tab", "format": {"type": "json" , "property": "data" , "parse": {"date": "date"} }, "transform": [ // Convert xField parameter into a field "_xfield" {"type": "formula", "field": "_xfield", "expr": "datum.date" } , {"type": "sort", "by": ["_xfield"]} , {"type": "fold", "fields": ["totalConfirmedCases","deaths"]} , {"type": "formula", "field": "_yfield", "expr": "datum.value" }

] }, { "name": "labels", "url": "tabular:///COVID-19 cases in San Mateo County, California.tab", "format": {"type": "json", "property": "fields"} } ], "scales": [ { "name": "x", "type": "time", "domain": {"data": "chart", "field": "_xfield"}, "range": "width",


}, { "name": "y", "type": "linear", "range": "height", "domain": {"data": "chart", "field": "_yfield"}, "zero": false,


}, { "name": "color", "type": "ordinal", "domain": {"data": "chart", "field": "key"}, "range": "category10" }, { "name": "labels", "type": "ordinal", "domain": {"data": "labels", "field": "name"}, "range": {"data": "labels", "field": "title"}, } ], "legends": [{ "fill": "color", "stroke": "color",

"properties": { "labels": { "text": {"scale": "labels", "field": "data"} } } }], "axes": [ {"scale": "x", "type": "x", "tickSizeEnd": 0 , "ticks": 7


}, {"scale": "y", "type": "y", "tickSizeEnd": 0


, "grid": true } ],

"marks": [ // Group data by the group parameter or "key", and draw lines, one line per group { "type": "group", "from": { "data": "chart", "transform": [{"type": "facet", "groupby": ["key"]}] }, "marks": [ { "type": "line", "properties": { "enter": { "y": {"scale": "y", "field": "_yfield"}, "x": {"scale": "x", "field": "_xfield"}, "stroke": {"scale": "color", "field": "key"}, "interpolate": {"value": "monotone"}, "strokeWidth": {"value": 2.5} } } } ], }

// Draw title at the top of the graph , { "type": "text", "properties": { "enter": { "x": {"signal": "rightwidth", "mult": 0.5}, "y": {"value": -15}, "text": {"value": "COVID-19 cases in San Mateo County, California"}, "fontWeight": {"value": "bold"}, "align": {"value": "center"}, "baseline": {"value": "bottom"}, "fill": {"value": "#000"} } } } ] } </graph> Lua error in Module:TNT at line 159: Missing JsonConfig extension; Cannot load https://commons.wikimedia.org/wiki/Data:I18n/Template:Graphs.tab..

<graph> { // // ATTENTION: This code is maintained at https://www.mediawiki.org/wiki/Template:Graph:Lines // Please do not modify it anywhere else, as it may get copied and override your changes. // Suggestions can be made at https://www.mediawiki.org/wiki/Template_talk:Graph:Lines // // Template translation is in https://commons.wikimedia.org/wiki/Data:Original/Template:Graphs.tab //

"version": 2, "width": 800, "height": 300, "padding": "strict",

"signals": [{"name": "rightwidth", "expr": "width + padding.right"}], "data": [{ "name": "chart",

"url": "tabular:///COVID-19 cases in Santa Clara County, California.tab", "format": {"type": "json" , "property": "data" , "parse": {"date": "date"} }, "transform": [ // Convert xField parameter into a field "_xfield" {"type": "formula", "field": "_xfield", "expr": "datum.date" } , {"type": "sort", "by": ["_xfield"]} , {"type": "fold", "fields": ["totalConfirmedCases","deaths"]} , {"type": "formula", "field": "_yfield", "expr": "datum.value" }

] }, { "name": "labels", "url": "tabular:///COVID-19 cases in Santa Clara County, California.tab", "format": {"type": "json", "property": "fields"} } ], "scales": [ { "name": "x", "type": "time", "domain": {"data": "chart", "field": "_xfield"}, "range": "width",


}, { "name": "y", "type": "linear", "range": "height", "domain": {"data": "chart", "field": "_yfield"}, "zero": false,


}, { "name": "color", "type": "ordinal", "domain": {"data": "chart", "field": "key"}, "range": "category10" }, { "name": "labels", "type": "ordinal", "domain": {"data": "labels", "field": "name"}, "range": {"data": "labels", "field": "title"}, } ], "legends": [{ "fill": "color", "stroke": "color",

"properties": { "labels": { "text": {"scale": "labels", "field": "data"} } } }], "axes": [ {"scale": "x", "type": "x", "tickSizeEnd": 0 , "ticks": 7


}, {"scale": "y", "type": "y", "tickSizeEnd": 0


, "grid": true } ],

"marks": [ // Group data by the group parameter or "key", and draw lines, one line per group { "type": "group", "from": { "data": "chart", "transform": [{"type": "facet", "groupby": ["key"]}] }, "marks": [ { "type": "line", "properties": { "enter": { "y": {"scale": "y", "field": "_yfield"}, "x": {"scale": "x", "field": "_xfield"}, "stroke": {"scale": "color", "field": "key"}, "interpolate": {"value": "monotone"}, "strokeWidth": {"value": 2.5} } } } ], }

// Draw title at the top of the graph , { "type": "text", "properties": { "enter": { "x": {"signal": "rightwidth", "mult": 0.5}, "y": {"value": -15}, "text": {"value": "COVID-19 cases in Santa Clara County, California"}, "fontWeight": {"value": "bold"}, "align": {"value": "center"}, "baseline": {"value": "bottom"}, "fill": {"value": "#000"} } } } ] } </graph> Lua error in Module:TNT at line 159: Missing JsonConfig extension; Cannot load https://commons.wikimedia.org/wiki/Data:I18n/Template:Graphs.tab..

<graph> { // // ATTENTION: This code is maintained at https://www.mediawiki.org/wiki/Template:Graph:Lines // Please do not modify it anywhere else, as it may get copied and override your changes. // Suggestions can be made at https://www.mediawiki.org/wiki/Template_talk:Graph:Lines // // Template translation is in https://commons.wikimedia.org/wiki/Data:Original/Template:Graphs.tab //

"version": 2, "width": 800, "height": 300, "padding": "strict",

"signals": [{"name": "rightwidth", "expr": "width + padding.right"}], "data": [{ "name": "chart",

"url": "tabular:///COVID-19 cases in Solano County, California.tab", "format": {"type": "json" , "property": "data" , "parse": {"date": "date"} }, "transform": [ // Convert xField parameter into a field "_xfield" {"type": "formula", "field": "_xfield", "expr": "datum.date" } , {"type": "sort", "by": ["_xfield"]} , {"type": "fold", "fields": ["totalConfirmedCases","deaths",]} , {"type": "formula", "field": "_yfield", "expr": "datum.value" }

] }, { "name": "labels", "url": "tabular:///COVID-19 cases in Solano County, California.tab", "format": {"type": "json", "property": "fields"} } ], "scales": [ { "name": "x", "type": "time", "domain": {"data": "chart", "field": "_xfield"}, "range": "width",


}, { "name": "y", "type": "linear", "range": "height", "domain": {"data": "chart", "field": "_yfield"}, "zero": false,


}, { "name": "color", "type": "ordinal", "domain": {"data": "chart", "field": "key"}, "range": "category10" }, { "name": "labels", "type": "ordinal", "domain": {"data": "labels", "field": "name"}, "range": {"data": "labels", "field": "title"}, } ], "legends": [{ "fill": "color", "stroke": "color",

"properties": { "labels": { "text": {"scale": "labels", "field": "data"} } } }], "axes": [ {"scale": "x", "type": "x", "tickSizeEnd": 0 , "ticks": 7


}, {"scale": "y", "type": "y", "tickSizeEnd": 0


, "grid": true } ],

"marks": [ // Group data by the group parameter or "key", and draw lines, one line per group { "type": "group", "from": { "data": "chart", "transform": [{"type": "facet", "groupby": ["key"]}] }, "marks": [ { "type": "line", "properties": { "enter": { "y": {"scale": "y", "field": "_yfield"}, "x": {"scale": "x", "field": "_xfield"}, "stroke": {"scale": "color", "field": "key"}, "interpolate": {"value": "monotone"}, "strokeWidth": {"value": 2.5} } } } ], }

// Draw title at the top of the graph , { "type": "text", "properties": { "enter": { "x": {"signal": "rightwidth", "mult": 0.5}, "y": {"value": -15}, "text": {"value": "COVID-19 cases in Solano County, California"}, "fontWeight": {"value": "bold"}, "align": {"value": "center"}, "baseline": {"value": "bottom"}, "fill": {"value": "#000"} } } } ] } </graph> Lua error in Module:TNT at line 159: Missing JsonConfig extension; Cannot load https://commons.wikimedia.org/wiki/Data:I18n/Template:Graphs.tab..

<graph> { // // ATTENTION: This code is maintained at https://www.mediawiki.org/wiki/Template:Graph:Lines // Please do not modify it anywhere else, as it may get copied and override your changes. // Suggestions can be made at https://www.mediawiki.org/wiki/Template_talk:Graph:Lines // // Template translation is in https://commons.wikimedia.org/wiki/Data:Original/Template:Graphs.tab //

"version": 2, "width": 800, "height": 300, "padding": "strict",

"signals": [{"name": "rightwidth", "expr": "width + padding.right"}], "data": [{ "name": "chart",

"url": "tabular:///COVID-19 cases in Sonoma County, California.tab", "format": {"type": "json" , "property": "data" , "parse": {"date": "date"} }, "transform": [ // Convert xField parameter into a field "_xfield" {"type": "formula", "field": "_xfield", "expr": "datum.date" } , {"type": "sort", "by": ["_xfield"]} , {"type": "fold", "fields": ["totalConfirmedCases","deaths",]} , {"type": "formula", "field": "_yfield", "expr": "datum.value" }

] }, { "name": "labels", "url": "tabular:///COVID-19 cases in Sonoma County, California.tab", "format": {"type": "json", "property": "fields"} } ], "scales": [ { "name": "x", "type": "time", "domain": {"data": "chart", "field": "_xfield"}, "range": "width",


}, { "name": "y", "type": "linear", "range": "height", "domain": {"data": "chart", "field": "_yfield"}, "zero": false,


}, { "name": "color", "type": "ordinal", "domain": {"data": "chart", "field": "key"}, "range": "category10" }, { "name": "labels", "type": "ordinal", "domain": {"data": "labels", "field": "name"}, "range": {"data": "labels", "field": "title"}, } ], "legends": [{ "fill": "color", "stroke": "color",

"properties": { "labels": { "text": {"scale": "labels", "field": "data"} } } }], "axes": [ {"scale": "x", "type": "x", "tickSizeEnd": 0 , "ticks": 7


}, {"scale": "y", "type": "y", "tickSizeEnd": 0


, "grid": true } ],

"marks": [ // Group data by the group parameter or "key", and draw lines, one line per group { "type": "group", "from": { "data": "chart", "transform": [{"type": "facet", "groupby": ["key"]}] }, "marks": [ { "type": "line", "properties": { "enter": { "y": {"scale": "y", "field": "_yfield"}, "x": {"scale": "x", "field": "_xfield"}, "stroke": {"scale": "color", "field": "key"}, "interpolate": {"value": "monotone"}, "strokeWidth": {"value": 2.5} } } } ], }

// Draw title at the top of the graph , { "type": "text", "properties": { "enter": { "x": {"signal": "rightwidth", "mult": 0.5}, "y": {"value": -15}, "text": {"value": "COVID-19 cases in Sonoma County, California"}, "fontWeight": {"value": "bold"}, "align": {"value": "center"}, "baseline": {"value": "bottom"}, "fill": {"value": "#000"} } } } ] } </graph> Lua error in Module:TNT at line 159: Missing JsonConfig extension; Cannot load https://commons.wikimedia.org/wiki/Data:I18n/Template:Graphs.tab..

kids search engine
COVID-19 pandemic in the San Francisco Bay Area Facts for Kids. Kiddle Encyclopedia.