
California's 26th State Senate district facts for kids
Quick facts for kids California's 26th State Senate district |
|||
|---|---|---|---|
.svg) |
|||
| Current senator |
|
||
| Population (2010) • Voting age • Citizen voting age |
927,757 778,734 669,916 |
||
| Demographics |
|
||
| Registered voters | 666,958 | ||
| Registration | 50.55% Democratic 19.10% Republican 25.03% No party preference |
||
California's 26th State Senate district is one of 40 special areas in California. Each area elects a person to represent them in the California State Senate. Think of it like a team, and the senator is the captain for that part of California.
Currently, this district is represented by Ben Allen. He is a member of the Democratic Party. He lives in Santa Monica.
Contents
What is the 26th State Senate District?
This district covers a big part of Los Angeles County. It includes many well-known areas. These are often called the "Westside" and "South Bay" regions.
Cities and Areas in the District
The 26th district includes many cities and parts of Los Angeles. It also covers some islands off the coast.
- Beverly Hills
- El Segundo
- Hermosa Beach
- Parts of Los Angeles, including:
- Bel Air
- Brentwood
- Hollywood (part of it)
- Pacific Palisades
- Venice
- Manhattan Beach
- Marina del Rey
- Rancho Palos Verdes
- Redondo Beach
- Santa Monica
- Parts of Torrance
- West Hollywood
The district also includes two islands. These are Santa Catalina Island and San Clemente Island. They are part of the southern Channel Islands.
How the District Votes in Statewide Elections
People in the 26th district vote for leaders for the whole state. This includes the Governor and U.S. Senators. The table below shows how people in this district voted in some recent statewide elections.
| Year | Office | Results |
|---|---|---|
| 2018 | Governor | Newsom (Democrat) won with 72.1% of the vote. |
| 2018 | Senator | Feinstein (Democrat) won with 62.4% of the vote. |
| 2016 | President | Clinton (Democrat) won with 71.4% of the vote. |
| 2016 | Senator | Harris (Democrat) won with 72.1% of the vote. |
| 2014 | Governor | Brown (Democrat) won with 65.4% of the vote. |
| 2012 | President | Obama (Democrat) won with 64.9% of the vote. |
| 2012 | Senator | Feinstein (Democrat) won with 68.4% of the vote. |
Recent Election Results for State Senate
Here are the results from the most recent elections for the State Senate seat in this district.
2018 Election
In 2018, Ben Allen ran for re-election. He won by a large margin.
| Primary election | ||||
|---|---|---|---|---|
| Party | Candidate | Votes | % | |
| Democratic | Ben Allen (incumbent) | 144,283 | 76.8 | |
| No party preference | Baron Bruno | 23,119 | 12.3 | |
| Libertarian | Mark Matthew Herd | 20,534 | 10.9 | |
| Total votes | 187,936 | 100.0 | ||
| General election | ||||
| Democratic | Ben Allen (incumbent) | 298,609 | 77.2 | |
| No party preference | Baron Bruno | 87,974 | 22.8 | |
| Total votes | 386,583 | 100.0 | ||
| Democratic hold | ||||
2014 Election
The 2014 election was when Ben Allen was first elected to this seat.
| Primary election | ||||
|---|---|---|---|---|
| Party | Candidate | Votes | % | |
| Democratic | Ben Allen | 25,987 | 22.2 | |
| Democratic | Sandra Fluke | 22,759 | 19.4 | |
| No party preference | Seth Stodder | 20,419 | 17.4 | |
| Democratic | Betsy Butler | 19,301 | 16.5 | |
| Democratic | Amy Howorth | 18,411 | 15.7 | |
| Democratic | Vito Imbasciani | 5,189 | 4.4 | |
| Democratic | Patric Verrone | 3,446 | 2.9 | |
| Democratic | Barbi S. Appelquist | 1,630 | 1.4 | |
| Total votes | 117,142 | 100.0 | ||
| General election | ||||
| Democratic | Ben Allen | 122,901 | 60.3 | |
| Democratic | Sandra Fluke | 80,781 | 39.7 | |
| Total votes | 203,682 | 100.0 | ||
| Democratic hold | ||||
Images for kids
-
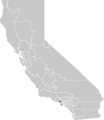
Map of California's 26th State Senate District.
