Climate of Ireland facts for kids

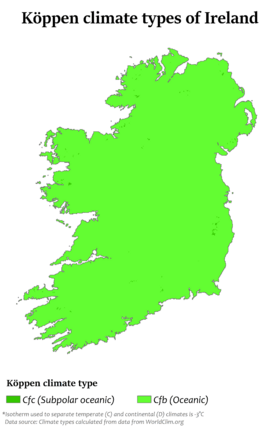
Ireland's climate is usually mild, wet, and changes a lot. It gets plenty of rainfall and doesn't have really hot or really cold temperatures. Ireland has what's called a temperate oceanic climate. This is also known as a Cfb climate in the Köppen climate classification system, which is the same type of climate found in most of northwest Europe. This means the island generally has warm summers and cool winters.
Because Ireland is located downwind from a huge ocean, its winters are much milder than other places at the same distance from the equator. For example, places like Newfoundland in Canada or Sakhalin in Russia are much colder in winter. The North Atlantic Current and Gulf Stream are ocean currents that bring extra heat across the Atlantic Ocean. This warmth is then carried by the winds towards Ireland, making places like Dublin have milder winters than other similar climates.
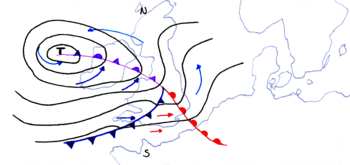
The wind usually blows from the southwest. It hits the tall mountains on Ireland's west coast. This is why the western part of Ireland gets a lot of rain. For example, Valentia Island, off the coast of County Kerry, gets almost twice as much rain each year as Dublin on the east coast (about 1400 mm compared to 714 mm).
January and February are the coldest months. The average daily air temperatures during these months are between 4 and 7 degrees Celsius. July and August are the warmest, with average daily temperatures from 14 to 16 degrees Celsius. The highest daily temperatures in July and August are usually 17 to 18 degrees Celsius near the coast, and 19 to 20 degrees Celsius further inland. May and June are the sunniest months, with about five to seven hours of sunshine per day.
While extreme weather events are not very common in Ireland compared to other European countries, they do happen. Strong storms from the Atlantic, mostly in December, January, and February, can sometimes bring winds up to 160 km/h to the western coastal areas. The winter of 2013/14 was the stormiest ever recorded. During the summer, especially in late July and early August, thunderstorms can form.
Contents
Temperature in Ireland
Ireland doesn't have extreme temperatures like some other places at the same latitude. Temperatures can vary across the country. Inland areas are usually colder in winter and warmer in summer than places near the coast.
The warmest parts of Ireland are along the southwest coast. Valentia Island has the highest average temperature, at 10.9 degrees Celsius.
The coldest areas are found inland. Mullingar has the lowest average temperature, at 9.3 degrees Celsius.
The highest temperature ever recorded in Ireland was 33.3 degrees Celsius. This happened at Kilkenny Castle on June 26, 1887. The lowest temperature was –19.1 degrees Celsius at Markree Castle on January 16, 1881.
Six of the ten warmest years in Ireland have happened since 1990. Because of climate change, it's thought that temperatures across Ireland could rise by up to 3.4 degrees Celsius by the end of this century.
Very hot or very cold weather is rare in Ireland. Summer temperatures above 30 degrees Celsius don't happen often, usually only every few years. However, temperatures often reach the high 20s most summers. Very cold freezes are also rare in winter. Temperatures below –10 degrees Celsius are very uncommon in low-lying areas. In many coastal areas, temperatures rarely drop below freezing. But in the Wicklow Mountains, temperatures are said to reach –10 degrees Celsius every year.
| Climate data for Republic of Ireland | |||||||||||||
|---|---|---|---|---|---|---|---|---|---|---|---|---|---|
| Month | Jan | Feb | Mar | Apr | May | Jun | Jul | Aug | Sep | Oct | Nov | Dec | Year |
| Record high °C (°F) | 18.5 (65.3) |
18.1 (64.6) |
23.6 (74.5) |
25.8 (78.4) |
28.4 (83.1) |
33.3 (91.9) |
33.1 (91.6) |
32.1 (89.8) |
29.1 (84.4) |
25.2 (77.4) |
20.1 (68.2) |
18.1 (64.6) |
33.3 (91.9) |
| Record low °C (°F) | −19.1 (−2.4) |
−17.8 (0.0) |
−17.2 (1.0) |
−7.7 (18.1) |
−5.6 (21.9) |
−3.3 (26.1) |
−0.3 (31.5) |
−2.7 (27.1) |
−3 (27) |
−8.3 (17.1) |
−11.5 (11.3) |
−17.5 (0.5) |
−19.1 (−2.4) |
| Source 1: Met Éireann | |||||||||||||
| Source 2: The Irish Times (November record high), RTE (July record high), Met Éireann (August record high) | |||||||||||||
Frost and Freezing Temperatures
Air frost happens often in winter. Most areas in Ireland see more than 40 days of air frost each year. In northern parts, air frost happens about 10.2 days in January, which is the month with the most frost. In the Sperrins and the Glens of Antrim, air frost occurs around 80 days a year. Ground frost is similar, with about 100 days in lowlands and over 140 days in the mountains. The number of frosty days in Ireland has gone down a lot over the last ten years, especially in winter.
Frost is less common along the coast, in cities, and in western and southern areas.
Roches Point in County Cork has the fewest days with air frost, with an average of 7.0 days each year.
Kilkenny, County Kilkenny has the most days with air frost, with an average of 53.0 days each year.
In Dublin, Dublin Airport sees air frost about 24.3 days per year. Casement Aerodrome, which is further inland, records air frost about 41.3 days per year.
Sunshine in Ireland
The sunniest months in Ireland are May and June. During these months, most of the country gets between 5 and 6.5 hours of sunshine per day. The southeast part of Ireland gets the most sunshine, with over 7 hours a day in early summer. December is the cloudiest month. It gets about 1 hour of sunshine per day in the north and almost 2 hours in the southeast.
Overall, most areas in Ireland get an average of 3.25 to 3.75 hours of sunshine each day. Irish skies are completely covered by clouds about half of the time.
The sunniest part of the island is the southeast coast. Rosslare, County Wexford used to be the sunniest area, but its weather station closed in 2007. From 1981 to 2010, the sunniest station was Ballyrichard HSE in Arklow, County Wicklow. It received an average of 4.41 hours of sunshine per day.
| Climate data for Arklow, County Wicklow, elevation 20m, (1981-2010) | |||||||||||||
|---|---|---|---|---|---|---|---|---|---|---|---|---|---|
| Month | Jan | Feb | Mar | Apr | May | Jun | Jul | Aug | Sep | Oct | Nov | Dec | Year |
| Mean monthly sunshine hours | 62.0 | 85.0 | 118.1 | 154.4 | 220.8 | 206.2 | 205.0 | 184.5 | 145.1 | 101.8 | 64.6 | 64.5 | 1,612 |
| Source: Met Éireann | |||||||||||||
The cloudiest (least sunny) parts of Ireland are generally the west and northwest. From 1971 to 2000, Claremorris, County Mayo was the cloudiest station, with only 1,072 hours of sunshine per year. From 1981 to 2010, Birr, County Offaly, in the middle of the country, was the most cloudy. It received an average of 3.2 hours of sunshine per day, which is less than stations like Malin Head in the north or Belmullet in the west.
Inland areas tend to get less sunshine than coastal areas. This is because clouds form more easily over land due to warm air rising from the ground.
| Climate data for Birr, County Offaly, elevation 73m, (1979-2008) | |||||||||||||
|---|---|---|---|---|---|---|---|---|---|---|---|---|---|
| Month | Jan | Feb | Mar | Apr | May | Jun | Jul | Aug | Sep | Oct | Nov | Dec | Year |
| Mean monthly sunshine hours | 47.3 | 63.5 | 89.2 | 136.5 | 159.7 | 134.7 | 124.3 | 125.3 | 107.7 | 88.8 | 57.6 | 42.7 | 1,177.3 |
| Source 1: Met Éireann | |||||||||||||
| Source 2: European Climate Assessment & Dataset, | |||||||||||||
Precipitation in Ireland
Rainfall is the most common type of precipitation in Ireland. It's very common across the island, though some parts of the west coast get twice as much rain as the east coast. Rain in Ireland usually comes from weather systems that move from the Atlantic Ocean over the island, bringing clouds and rain.
Most of the eastern half of the country gets between 750 and 1000 mm of rain each year. In the west, rainfall generally averages between 1000 and 1250 mm. In many mountainous areas, rainfall can be more than 3000 mm per year. The wettest months almost everywhere are December and January. April is usually the driest month, but in many southern areas, June is the driest.
The average number of "wet days" (days with more than 1 mm of rain) ranges from about 151 days a year along the east and southeast coasts, to about 225 days a year in parts of the west.
The wettest weather station is Glanagimla, Leenane, Co. Galway, which gets an average of 2874.59 mm of rain per year. The wettest main weather station is Valentia Island, which receives 1430.1 mm of rain per year on average.
The driest weather station is at Ringsend, Co. Dublin, which gets 683 mm of rain per year on average.
The weather station with the most "wet days" is Belmullet, with 193 days per year. The station with the fewest "wet days" is Dublin Airport, with 128 days per year.
Rainfall Records
Here are some rainfall records for Ireland:
- The driest year ever recorded in Ireland was 1887. Only 356.6 mm of rain was recorded at Glasnevin, County Dublin.
- The longest period without rain (drought) in Ireland happened in Limerick. It lasted for 37 days, from April 3 to May 10, 1938.
- The most rain in one month was 790.0 mm. This was recorded in the Cummeragh Mountains, County Kerry, in October 1996.
- The most rain in one year was 3964.9 mm. This was recorded at Ballaghbeena Gap in 1960.
- The most rain in one day was 243.5 mm. This happened at Cloone Lake, County Kerry, on September 18, 1993.
Snowfall in Ireland
Very cold weather is not common in Ireland. Most winter precipitation is rain. However, hills and mountainous areas can get up to 30 days of snowfall each year. The Wicklow Mountains sometimes see 50 or more days of snowfall annually. Most low-lying areas of the island only have a few days of snow lying on the ground each year (from December to March), or sometimes no snow at all during some winters.
Ireland prepares for snow and ice by spreading grit, salt, and other materials. In late 2011, the Irish Government started "Winter-Ready" to help the country prepare for severe winter weather.
Ireland's winter weather is hard to predict. This is mainly because of the influence of the Atlantic Ocean, the Gulf Stream, and the North Atlantic Drift. Also, Ireland's northern location and its openness to winds from Siberia or the Arctic make both extremely low and relatively mild temperatures possible.
The snowiest weather station is Clones, County Monaghan. It gets an average of 18 days of snow or sleet per year. On 6.2 of these days, snow is still on the ground at 9:00 AM. The least snowy weather station is Valentia Island, County Kerry. It gets an average of 5.6 days of snow or sleet per year, with snow lying on the ground on only 0.8 of those days.
Hail in Ireland
Hail, like snow and sleet, is also rare in Ireland. However, it can happen at any time of the year. It is most common in spring during thunderstorms.
Malin Head, County Donegal, gets the most hail, with an average of 48.4 days per year.
Roche's Point, County Cork, gets the least hail, with an average of 8.0 days per year.
Thunderstorms in Ireland
Thunderstorms are quite rare in Ireland. They are more likely to happen in late spring, but they can occur at any time of the year.
Cork Airport, County Cork, experiences the least thunder, with an average of 3.7 days per year.
Valentia Island, County Kerry, experiences the most thunder, with an average of 7.1 days per year.
Wind in Ireland
Generally, coastal areas in Ireland are windier than inland areas. Also, the west coast tends to be windier than the east coast.
The weather station with the highest average wind speed is Malin Head, County Donegal. The average wind speed there is 16.3 knots (about 30 km/h). Malin Head also experiences the most gale-force winds, recording them on average 66.0 days per year.
The station with the lowest average wind speed is Kilkenny, County Kilkenny. The average wind speed there is 6.5 knots (about 12 km/h).
The station that records the fewest gale-force winds is Birr, County Offaly. It records them on average 1.2 days per year.
The highest wind speed ever recorded in Ireland was 103 knots (about 191 km/h). This happened at Fastnet Lighthouse, County Cork, on October 16, 2017.
Tornadoes are very rare in Ireland. Less than ten are reported each year, mostly in August.
Fog in Ireland
Fog is more common inland and in higher places. It mostly happens during winter and in the mornings when there is high air pressure.
The foggiest station is at Cork Airport, County Cork, which has 99.5 days of fog per year.
The least foggy station is at Valentia Island, County Kerry, which has 8.9 days of fog per year.
Visibility in Ireland
Visibility in Ireland is usually very good. This is because industries are often near the coast, allowing sea breezes to blow away any smog. Mist and fog often occur, as does coastal fog in the east, but they usually don't last long. However, in winter, fog can sometimes take a while to clear.
Climate Change
Climate Charts
| Weather chart for Belmullet (1981-2010) | |||||||||||||||||||||||||||||||||||||||||||||||
|---|---|---|---|---|---|---|---|---|---|---|---|---|---|---|---|---|---|---|---|---|---|---|---|---|---|---|---|---|---|---|---|---|---|---|---|---|---|---|---|---|---|---|---|---|---|---|---|
| J | F | M | A | M | J | J | A | S | O | N | D | ||||||||||||||||||||||||||||||||||||
|
134
9
4
|
97
9
4
|
99
10
5
|
72
12
6
|
70
15
8
|
72
16
10
|
79
18
12
|
102
18
12
|
102
17
11
|
146
14
8
|
134
11
6
|
137
9
4
|
||||||||||||||||||||||||||||||||||||
| temperatures in °C precipitation totals in mm |
|||||||||||||||||||||||||||||||||||||||||||||||
|
Imperial conversion
|
|||||||||||||||||||||||||||||||||||||||||||||||
| Weather chart for Birr (1979-2008) | |||||||||||||||||||||||||||||||||||||||||||||||
|---|---|---|---|---|---|---|---|---|---|---|---|---|---|---|---|---|---|---|---|---|---|---|---|---|---|---|---|---|---|---|---|---|---|---|---|---|---|---|---|---|---|---|---|---|---|---|---|
| J | F | M | A | M | J | J | A | S | O | N | D | ||||||||||||||||||||||||||||||||||||
|
79
8
2
|
59
9
2
|
67
10
3
|
55
13
4
|
60
16
7
|
67
18
10
|
59
20
12
|
82
19
11
|
66
17
9
|
94
14
7
|
75
10
4
|
84
9
3
|
||||||||||||||||||||||||||||||||||||
| temperatures in °C precipitation totals in mm |
|||||||||||||||||||||||||||||||||||||||||||||||
|
Imperial conversion
|
|||||||||||||||||||||||||||||||||||||||||||||||
| Weather chart for Casement Aerodrome (1981-2010) | |||||||||||||||||||||||||||||||||||||||||||||||
|---|---|---|---|---|---|---|---|---|---|---|---|---|---|---|---|---|---|---|---|---|---|---|---|---|---|---|---|---|---|---|---|---|---|---|---|---|---|---|---|---|---|---|---|---|---|---|---|
| J | F | M | A | M | J | J | A | S | O | N | D | ||||||||||||||||||||||||||||||||||||
|
64
8
2
|
49
8
2
|
51
10
3
|
52
12
4
|
59
15
7
|
63
18
9
|
54
20
12
|
72
20
11
|
60
17
10
|
82
14
7
|
74
10
4
|
76
8
2
|
||||||||||||||||||||||||||||||||||||
| temperatures in °C precipitation totals in mm |
|||||||||||||||||||||||||||||||||||||||||||||||
|
Imperial conversion
|
|||||||||||||||||||||||||||||||||||||||||||||||
| Weather chart for Clones (1978-2007) | |||||||||||||||||||||||||||||||||||||||||||||||
|---|---|---|---|---|---|---|---|---|---|---|---|---|---|---|---|---|---|---|---|---|---|---|---|---|---|---|---|---|---|---|---|---|---|---|---|---|---|---|---|---|---|---|---|---|---|---|---|
| J | F | M | A | M | J | J | A | S | O | N | D | ||||||||||||||||||||||||||||||||||||
|
88
7
2
|
71
8
2
|
84
10
3
|
62
12
4
|
63
15
7
|
71
17
10
|
71
19
11
|
89
19
11
|
76
17
9
|
103
13
7
|
85
10
4
|
98
8
2
|
||||||||||||||||||||||||||||||||||||
| temperatures in °C precipitation totals in mm |
|||||||||||||||||||||||||||||||||||||||||||||||
|
Imperial conversion
|
|||||||||||||||||||||||||||||||||||||||||||||||
| Weather chart for Cork Airport (1981-2010) | |||||||||||||||||||||||||||||||||||||||||||||||
|---|---|---|---|---|---|---|---|---|---|---|---|---|---|---|---|---|---|---|---|---|---|---|---|---|---|---|---|---|---|---|---|---|---|---|---|---|---|---|---|---|---|---|---|---|---|---|---|
| J | F | M | A | M | J | J | A | S | O | N | D | ||||||||||||||||||||||||||||||||||||
|
131
8
3
|
98
8
3
|
98
10
4
|
77
12
5
|
82
14
7
|
81
17
10
|
79
19
12
|
97
19
12
|
95
17
10
|
138
13
8
|
120
10
5
|
133
9
4
|
||||||||||||||||||||||||||||||||||||
| temperatures in °C precipitation totals in mm |
|||||||||||||||||||||||||||||||||||||||||||||||
|
Imperial conversion
|
|||||||||||||||||||||||||||||||||||||||||||||||
| Weather chart for Dublin Airport (1981-2010) | |||||||||||||||||||||||||||||||||||||||||||||||
|---|---|---|---|---|---|---|---|---|---|---|---|---|---|---|---|---|---|---|---|---|---|---|---|---|---|---|---|---|---|---|---|---|---|---|---|---|---|---|---|---|---|---|---|---|---|---|---|
| J | F | M | A | M | J | J | A | S | O | N | D | ||||||||||||||||||||||||||||||||||||
|
63
8
2
|
49
8
2
|
53
10
3
|
54
12
5
|
60
15
7
|
67
18
10
|
56
20
12
|
73
19
12
|
60
17
10
|
79
14
7
|
73
10
5
|
73
8
3
|
||||||||||||||||||||||||||||||||||||
| temperatures in °C precipitation totals in mm |
|||||||||||||||||||||||||||||||||||||||||||||||
|
Imperial conversion
|
|||||||||||||||||||||||||||||||||||||||||||||||
| Weather chart for Kilkenny (1978-2007) | |||||||||||||||||||||||||||||||||||||||||||||||
|---|---|---|---|---|---|---|---|---|---|---|---|---|---|---|---|---|---|---|---|---|---|---|---|---|---|---|---|---|---|---|---|---|---|---|---|---|---|---|---|---|---|---|---|---|---|---|---|
| J | F | M | A | M | J | J | A | S | O | N | D | ||||||||||||||||||||||||||||||||||||
|
78
8
2
|
66
9
2
|
68
11
3
|
56
13
4
|
60
16
7
|
61
18
9
|
55
20
11
|
78
20
11
|
69
18
9
|
95
14
7
|
80
11
4
|
90
9
2
|
||||||||||||||||||||||||||||||||||||
| temperatures in °C precipitation totals in mm |
|||||||||||||||||||||||||||||||||||||||||||||||
|
Imperial conversion
|
|||||||||||||||||||||||||||||||||||||||||||||||
| Weather chart for Malin Head (1981-2010) | |||||||||||||||||||||||||||||||||||||||||||||||
|---|---|---|---|---|---|---|---|---|---|---|---|---|---|---|---|---|---|---|---|---|---|---|---|---|---|---|---|---|---|---|---|---|---|---|---|---|---|---|---|---|---|---|---|---|---|---|---|
| J | F | M | A | M | J | J | A | S | O | N | D | ||||||||||||||||||||||||||||||||||||
|
117
8
4
|
85
8
4
|
86
9
4
|
63
11
6
|
57
13
8
|
69
15
10
|
77
17
12
|
93
17
12
|
92
16
11
|
118
13
9
|
105
10
6
|
114
9
4
|
||||||||||||||||||||||||||||||||||||
| temperatures in °C precipitation totals in mm |
|||||||||||||||||||||||||||||||||||||||||||||||
|
Imperial conversion
|
|||||||||||||||||||||||||||||||||||||||||||||||
| Weather chart for Mullingar (1979-2008) | |||||||||||||||||||||||||||||||||||||||||||||||
|---|---|---|---|---|---|---|---|---|---|---|---|---|---|---|---|---|---|---|---|---|---|---|---|---|---|---|---|---|---|---|---|---|---|---|---|---|---|---|---|---|---|---|---|---|---|---|---|
| J | F | M | A | M | J | J | A | S | O | N | D | ||||||||||||||||||||||||||||||||||||
|
92
7
2
|
72
8
2
|
78
10
3
|
62
12
4
|
69
15
6
|
71
17
9
|
62
19
11
|
81
19
11
|
74
17
9
|
102
13
6
|
82
10
4
|
97
8
2
|
||||||||||||||||||||||||||||||||||||
| temperatures in °C precipitation totals in mm |
|||||||||||||||||||||||||||||||||||||||||||||||
|
Imperial conversion
|
|||||||||||||||||||||||||||||||||||||||||||||||
| Weather chart for Rosslare (1978-2007) | |||||||||||||||||||||||||||||||||||||||||||||||
|---|---|---|---|---|---|---|---|---|---|---|---|---|---|---|---|---|---|---|---|---|---|---|---|---|---|---|---|---|---|---|---|---|---|---|---|---|---|---|---|---|---|---|---|---|---|---|---|
| J | F | M | A | M | J | J | A | S | O | N | D | ||||||||||||||||||||||||||||||||||||
|
88
9
4
|
71
9
4
|
69
10
5
|
59
11
6
|
56
14
9
|
55
16
11
|
50
18
13
|
72
19
13
|
75
17
12
|
109
14
9
|
101
11
7
|
101
10
5
|
||||||||||||||||||||||||||||||||||||
| temperatures in °C precipitation totals in mm |
|||||||||||||||||||||||||||||||||||||||||||||||
|
Imperial conversion
|
|||||||||||||||||||||||||||||||||||||||||||||||
| Weather chart for Shannon Airport (1981-2010) | |||||||||||||||||||||||||||||||||||||||||||||||
|---|---|---|---|---|---|---|---|---|---|---|---|---|---|---|---|---|---|---|---|---|---|---|---|---|---|---|---|---|---|---|---|---|---|---|---|---|---|---|---|---|---|---|---|---|---|---|---|
| J | F | M | A | M | J | J | A | S | O | N | D | ||||||||||||||||||||||||||||||||||||
|
102
9
3
|
76
9
3
|
79
11
5
|
59
13
6
|
65
16
8
|
70
18
11
|
66
20
13
|
82
20
13
|
76
18
11
|
105
14
8
|
94
11
6
|
104
9
4
|
||||||||||||||||||||||||||||||||||||
| temperatures in °C precipitation totals in mm |
|||||||||||||||||||||||||||||||||||||||||||||||
|
Imperial conversion
|
|||||||||||||||||||||||||||||||||||||||||||||||
| Weather chart for Valentia Island (1981-2010) | |||||||||||||||||||||||||||||||||||||||||||||||
|---|---|---|---|---|---|---|---|---|---|---|---|---|---|---|---|---|---|---|---|---|---|---|---|---|---|---|---|---|---|---|---|---|---|---|---|---|---|---|---|---|---|---|---|---|---|---|---|
| J | F | M | A | M | J | J | A | S | O | N | D | ||||||||||||||||||||||||||||||||||||
|
174
10
5
|
124
10
5
|
124
11
5
|
97
13
6
|
94
15
8
|
95
17
11
|
99
18
13
|
115
18
13
|
125
17
11
|
177
14
9
|
169
12
7
|
165
10
5
|
||||||||||||||||||||||||||||||||||||
| temperatures in °C precipitation totals in mm |
|||||||||||||||||||||||||||||||||||||||||||||||
|
Imperial conversion
|
|||||||||||||||||||||||||||||||||||||||||||||||
| Climate data for Dublin (Secondary Climatological Surface Parameters) | |||||||||||||
|---|---|---|---|---|---|---|---|---|---|---|---|---|---|
| Month | Jan | Feb | Mar | Apr | May | Jun | Jul | Aug | Sep | Oct | Nov | Dec | Year |
| Mean number of days with precipitation > 10.0 mm (0.39 in) | 1.3 | 1.1 | 1.0 | 1.1 | 1.3 | 1.9 | 1.4 | 2.0 | 1.7 | 2.1 | 2.2 | 1.7 | 18.8 |
| Mean number of days with Max temperature > 25.0 °C (77.0 °F) | 0.0 | 0.0 | 0.0 | 0.0 | 0.0 | 0.2 | 0.6 | 0.3 | 0.0 | 0.0 | 0.0 | 0.0 | 1.1 |
| Mean number of days with Min temperature < 0.0 °C (32.0 °F) | 7.1 | 7.2 | 5.5 | 3.9 | 0.5 | 0.0 | 0.0 | 0.0 | 0.0 | 0.8 | 3.3 | 6.7 | 35 |
| Mean number of days with thunder | 0.2 | 0.2 | 0.3 | 0.2 | 0.7 | 0.6 | 0.9 | 1.0 | 0.2 | 0.3 | 0.3 | 0.2 | 5.1 |
| Mean number of days with hail | 1.1 | 1.5 | 1.8 | 2.0 | 1.0 | 0.1 | 0.2 | 0.1 | 0.1 | 0.2 | 0.4 | 0.7 | 9.2 |
| Mean number of days with fog | 2.4 | 2.4 | 3.4 | 2.6 | 2.4 | 2.2 | 2.3 | 2.8 | 3.4 | 2.6 | 2.3 | 3.4 | 32.2 |
| Mean number of days with wind speed > 10 m/s (36 km/h) | 18 | 15.9 | 15.7 | 12.2 | 11 | 8.9 | 8.5 | 9.5 | 10.3 | 13.4 | 14.7 | 16 | 154.1 |
| Mean wind speed | 6.3 | 6.2 | 5.9 | 5.3 | 5.1 | 4.7 | 4.7 | 4.7 | 4.9 | 5.4 | 5.8 | 6 | 5.4 |
| Average sea temperature °C (°F) | 9.6 (49.3) |
8.8 (47.8) |
8.4 (47.1) |
9.1 (48.4) |
10.4 (50.7) |
12.3 (54.1) |
14.1 (57.4) |
14.9 (58.8) |
14.8 (58.6) |
14.1 (57.4) |
13.1 (55.6) |
11.3 (52.3) |
11.7 (53.1) |
| Mean daily daylight hours | 8.0 | 10.0 | 12.0 | 14.0 | 16.0 | 17.0 | 16.0 | 15.0 | 13.0 | 11.0 | 9.0 | 8.0 | 12.4 |
| Average Ultraviolet index | 0 | 1 | 2 | 4 | 5 | 6 | 6 | 5 | 4 | 2 | 1 | 0 | 3 |
| Source: NOAA Weather Atlas(daylight-sea temperature-UV) | |||||||||||||
 | George Robert Carruthers |
 | Patricia Bath |
 | Jan Ernst Matzeliger |
 | Alexander Miles |


