Demographic history of the United States facts for kids
The demographic history of the United States is all about how the number of people in the U.S. has changed over time. It also looks at where people came from, how they moved around, and how families grew. This history helps us understand how the country became what it is today.
Contents
How the U.S. Population Grew Over Time
The U.S. government counts its population regularly through something called a census. This table shows how the population has grown from the early 1600s all the way to 2020. It includes Native Americans in some counts.
| Census year |
Population | Growth rate |
|---|---|---|
| 1610 | 350 | N/A |
| 1620 | 2,302 | 557.71% |
| 1630 | 4,646 | 101.82% |
| 1640 | 26,634 | 473.27% |
| 1650 | 50,368 | 89.11% |
| 1660 | 75,058 | 49.02% |
| 1670 | 111,935 | 49.13% |
| 1680 | 151,507 | 35.35% |
| 1690 | 210,372 | 38.85% |
| 1700 | 250,888 | 19.26% |
| 1710 | 331,711 | 32.21% |
| 1720 | 466,185 | 40.54% |
| 1730 | 629,445 | 35.02% |
| 1740 | 905,563 | 43.87% |
| 1750 | 1,170,760 | 29.29% |
| 1760 | 1,593,625 | 36.12% |
| 1770 | 2,148,076 | 34.79% |
| 1780 | 2,780,369 | 29.44% |
| 1790 | 3,929,214 | 41.32% |
| 1800 | 5,308,483 | 35.10% |
| 1810 | 7,239,881 | 36.38% |
| 1820 | 9,638,453 | 33.13% |
| 1830 | 12,866,020 | 33.49% |
| 1840 | 17,069,453 | 32.67% |
| 1850 | 23,191,876 | 35.87% |
| 1860 | 31,443,321 | 35.58% |
| 1870 | 38,558,371 | 22.63% |
| 1880 | 50,189,209 | 30.16% |
| 1890 | 62,979,766 | 25.48% |
| 1900 | 76,212,168 | 21.01% |
| 1910 | 92,228,496 | 21.02% |
| 1920 | 106,021,537 | 14.96% |
| 1930 | 123,202,624 | 16.21% |
| 1940 | 132,164,569 | 7.27% |
| 1950 | 151,325,798 | 14.50% |
| 1960 | 179,323,175 | 18.50% |
| 1970 | 203,211,926 | 13.32% |
| 1980 | 226,545,805 | 11.48% |
| 1990 | 248,709,873 | 9.78% |
| 2000 | 281,421,906 | 13.15% |
| 2010 | 308,745,538 | 9.71% |
| 2020 | 331,449,281 | 7.35% |
a U.S. Census Bureau 2020 census.
When Did People Get Married?
The "median age" is the middle age at which people got married for the first time. This table shows how that age changed for men and women from 1890 to 2021.
| Year | Men | Women |
|---|---|---|
| 1890 | 26.1 | 22.0 |
| 1900 | 25.9 | 21.9 |
| 1910 | 25.1 | 21.6 |
| 1920 | 24.6 | 21.2 |
| 1930 | 24.3 | 21.3 |
| 1940 | 24.5 | 21.5 |
| 1950 | 22.8 | 20.3 |
| 1960 | 22.8 | 20.3 |
| 1970 | 23.2 | 20.6 |
| 1980 | 24.7 | 22.0 |
| 1990 | 26.1 | 23.9 |
| 2000 | 26.8 | 25.1 |
| 2010 | 28.2 | 26.1 |
| 2021 | 30.4 | 28.6 |
How Immigration Shaped the U.S.
Immigration means people moving from one country to another to live. The U.S. has a long history of people arriving from all over the world.
Early Colonial Times: Where Did People Settle?
In the early days, most people who came to the American colonies were from Europe. They often settled in groups, forming small towns and communities.
New England Colonies
The New England colonies, like Massachusetts, had many skilled farmers and craftspeople. They lived in small villages, often for religious reasons. The cold winters helped keep diseases away, and there was plenty of food. This led to a very healthy population with lots of births and few deaths. After 1640, most of the growth in New England was from families already living there, not new immigrants.
Middle Colonies
The middle colonies, such as New York and Pennsylvania, were settled by many different groups. New York was started by the Dutch and became a big trading center. Pennsylvania was founded by Quakers and welcomed many Protestant groups looking for religious freedom and cheap land. Many German and English settlers came here.
Southern Colonies
In the southern colonies like Virginia and Maryland, large farms called plantations grew crops like tobacco and rice for export. Outside these big farms, many independent farmers grew food for their families. A significant number of people of African descent were brought to these colonies.
Frontier Settlements
From the early 1700s, many settlers moved west to the frontier. These were often Presbyterian families from Scotland and Ireland. They landed in cities like Philadelphia and Baltimore, then traveled west for cheaper land.
How the Population Grew Naturally
Most of the growth in the colonies came from families already living there having children, not from new immigrants. The number of foreign-born people rarely went above 10% of the total population. This pattern of internal growth continued throughout U.S. history.
| Estimated Population of American Colonies 1620 to 1780 Series Z-19 U.S. Census |
|||||||||
|---|---|---|---|---|---|---|---|---|---|
|
|
|||||||||
| Year | 1780 | 1760 | 1740 | 1720 | 1700 | 1680 | 1660 | 1640 | 1620 |
|
|
|||||||||
| Tot Pop. | 2,780,400 | 1,593,600 | 905,600 | 466,200 | 250,900 | 151,500 | 75,100 | 26,600 | 500 |
|
|
|||||||||
| Maine | 49,100 | 20,000 | - | - | - | - | - | 900 | - |
| New Hampshire | 87,800 | 39,100 | 23,300 | 9,400 | 5,000 | 2,000 | 1,600 | 1,100 | - |
| Vermont | 47,600 | - | - | - | - | - | - | - | - |
| Plymouth | - | - | - | - | - | 6,400 | 2,000 | 1,000 | 100 |
| Massachusetts | 268,600 | 202,600 | 151,600 | 91,000 | 55,900 | 39,800 | 20,100 | 8,900 | |
| Rhode Island | 52,900 | 45,500 | 25,300 | 11,700 | 5,900 | 3,000 | 1,500 | 300 | - |
| Connecticut | 206,700 | 142,500 | 89,600 | 58,800 | 26,000 | 17,200 | 8,000 | 1,500 | - |
| New York | 210,500 | 117,100 | 63,700 | 36,900 | 19,100 | 9,800 | 4,900 | 1,900 | - |
| New Jersey | 139,600 | 93,800 | 51,400 | 29,800 | 14,000 | 3,400 | - | - | - |
| Pennsylvania | 327,300 | 183,700 | 85,600 | 31,000 | 18,000 | 700 | - | - | - |
| Delaware | 45,400 | 33,300 | 19,900 | 5,400 | 2,500 | 1,000 | 500 | - | - |
| Maryland | 245,500 | 162,300 | 116,100 | 66,100 | 29,600 | 17,900 | 8,400 | 500 | - |
| Virginia | 538,000 | 339,700 | 180,400 | 87,800 | 58,600 | 43,600 | 27,000 | 10,400 | 400 |
| North Carolina | 270,100 | 110,400 | 51,800 | 21,300 | 10,700 | 5,400 | 1,000 | - | - |
| South Carolina | 180,000 | 94,100 | 45,000 | 17,000 | 5,700 | 1,200 | - | - | - |
| Georgia | 56,100 | 9,600 | 2,000 | - | - | - | - | - | - |
| Kentucky | 45,000 | - | - | - | - | - | - | - | - |
| Tennessee | 10,000 | - | - | - | - | - | - | - | - |
|
|
|||||||||
| Year | 1780 | 1760 | 1740 | 1720 | 1700 | 1680 | 1660 | 1640 | 1620 |
| New Eng. (ME to CT) | 712,800 | 449,600 | 289,700 | 170,900 | 92,800 | 68,500 | 33,200 | 13,700 | 100 |
| % Black | 2.0% | 2.8% | 2.9% | 2.3% | 1.8% | 0.7% | 1.8% | 1.5% | 0.0% |
| Middle (NY to DE) | 722,900 | 427,900 | 220,600 | 103,100 | 53,600 | 14,900 | 5,400 | 1,900 | - |
| % Black | 5.9% | 6.8% | 7.5% | 10.5% | 6.9% | 10.1% | 11.1% | 10.5% | 0.0% |
| South (MD to TN) | 1,344,700 | 716,000 | 395,300 | 192,300 | 104,600 | 68,100 | 36,400 | 11,000 | 400 |
| % Black | 38.6% | 39.7% | 31.6% | 28.1% | 21.5% | 7.3% | 4.7% | 1.8% | 0.0% |
Who Lived in the U.S. in 1790?
By 1790, the U.S. population was about 3.9 million. Most people were of British ancestry. However, many other groups had also arrived. The table below shows where people's families came from before 1790.
| U.S. Historical Populations | ||
|---|---|---|
| Country | Immigrants Before 1790 | Population 1790 -1 |
|
|
||
| Africa -2 | 360,000 | 757,000 |
| England* | 230,000 | 2,100,000 |
| Ulster Scot-Irish* | 135,000 | 300,000 |
| Germany -3 | 103,000 | 270,000 |
| Scotland* | 48,500 | 150,000 |
| Ireland* | 8,000 | (Incl. in Scot-Irish) |
| Netherlands | 6,000 | 100,000 |
| Wales* | 4,000 | 10,000 |
| France | 3,000 | 15,000 |
| Jews -4 | 1,000 | 2,000 |
| Sweden | 500 | 2,000 |
| Other -5 | 50,000 | 200,000 |
|
|
||
| Total -6 | 950,000 | 3,900,000 |
- Data From Ann Arbor, Michigan: Inter-university Consortium for Political and Social Research (ICPS)
- Several West African regions were the home to most African slaves transported to America. Population from US 1790 Census
- Germany in this time period consists of a large number of separate countries, the largest of which was Prussia.
- Jewish settlers were from several European countries.
- The Other category probably contains mostly settlers of English ancestry. However, the loss of several states' detailed census records in the Burning of Washington D.C. in the War of 1812 makes estimation difficult. Nearly all states that lost their 1790 (and 1800) census records have tried to reconstitute their original census from tax records etc. with various degrees of success. The summaries of the 1790 and 1800 census from all states survived.
- The Total is the total immigration over the approximately 130-year span of colonial existence of the U.S. colonies as found in the 1790 census. Many of the colonists, especially from the New England colonies, were already into their fifth generation of being in America. At the time of the American Revolution the foreign born population is estimated to be from 300,000 to 400,000.
During the 1600s, many English people moved to Colonial America, but about half returned home. By 1700, they made up 90% of the white population. From 1700 to 1775, about 400,000 to 500,000 Europeans immigrated, mostly from Scotland, Ireland, and Germany. By the time of the American Revolution, most of the population was born in America.
Immigration from 1791 to 1849
After the U.S. became a country, immigration was slow at first. Wars in Europe and the War of 1812 limited travel. In 1808, the U.S. also banned the transport of enslaved people.
After 1820, more people started to arrive. The U.S. government began keeping official records of immigrants. In the 1830s, many Irish and Germans came, even before the terrible potato famine in Ireland (1845-1849).
The 1840s saw a huge increase in immigration, especially from Ireland. Many Irish people were escaping poverty and famine. Thousands traveled on crowded "coffin ships" to Canada, then often walked or sailed to the U.S. Bad times in Europe, like failed revolutions, also led many Germans and British people to seek new lives in America. They were looking for land, freedom, and jobs.
| Population and Foreign Born 1790 to 1849 Census Population, Immigrants per Decade |
||||
|---|---|---|---|---|
| Census | Population | Immigrants-1 | Foreign Born | % |
|
|
||||
| 1790 | 3,918,000 | 60,000 | ||
| 1800 | 5,236,000 | 60,000 | ||
| 1810 | 7,036,000 | 60,000 | ||
| 1820 | 10,086,000 | 60,000 | ||
| 1830 | 12,785,000 | 143,000 | 200,000 -2 | 1.6% |
| 1840 | 17,018,000 | 599,000 | 800,000 -2 | 4.7% |
| 1850 | 23,054,000 | 1,713,000 | 2,244,000 | 9.7% |
- The total number immigrating in each decade from 1790 to 1820 are estimates.
- The number foreign born in 1830 and 1840 decades are extrapolations.
By 1830, about 98.5% of the U.S. population was born in the country. By 1850, this changed to about 90% native-born, as more immigrants arrived.
Immigration from 1965 to Today
In 1965, U.S. immigration laws changed. Before, the laws mostly favored immigrants from Europe. The new law gave priority to people with relatives already in the U.S. or those sponsored by an employer. Because of this, most immigrants since the 1970s have come from Latin America or Asia.
How People Moved Within the United States
Moving West: The American West
After the Mexican–American War in 1848, the U.S. gained new territories like California and New Mexico. This meant about 70,000 Mexican residents became U.S. citizens. Many Americans had already moved into these areas.
In 1849, the California Gold Rush caused a huge rush of people to California. People came from Mexico, South America, China, Australia, Europe, and from other parts of the U.S. This rapid growth led to California becoming a state in 1850.
Moving from Farms to Cities: Rural Flight
Rural flight is when many people, especially young adults, leave farm areas to live in cities. This happened a lot in the U.S. after 1920. For example, during the Dust Bowl in the 1930s, whole families left their farms because of severe droughts. Many rural areas have seen their populations shrink since then.
The Great Migration of African Americans
The Great Migration was a huge movement of millions of African Americans. From 1914 to 1960, they moved from the rural Southern United States to big industrial cities in the North and West. They moved for many reasons:
Why People Left the South
- Many African Americans wanted to escape the harsh Jim Crow system in the South. This system enforced racial segregation and violence. They hoped for more fairness in the North.
- A tiny insect called the boll weevil damaged cotton fields in the late 1910s. This meant less work for sharecroppers (farmers who worked on land owned by others).
- The Great Mississippi Flood of 1927 forced hundreds of thousands of African American farm workers from their homes.
Why People Moved North and West
- Wages were much higher in the North, even for service jobs.
- The growth of industries during World War I and World War II created many new jobs for African Americans.
- World War I also slowed down immigration from Europe. This meant factories needed more workers, and African Americans filled those jobs.
- During the 1930s, government programs like the Works Progress Administration offered more help and better pay to African Americans in the North.
- After 1940, as the U.S. prepared for World War II, factories produced more goods. This created even more job openings.
- Laws promoting equal opportunity, like those from the Fair Employment Practice Committee, were more often followed in the North and West.
Recent Moving Trends (Since 1990)
Since 1990, fewer Americans have been moving across state lines. This means that people might stay in areas even if the economy isn't great. By 2011, people were moving less than at any time since World War II.
Recent Population Changes
The Post-War Baby Boom
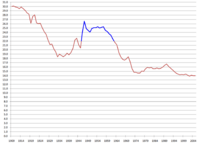
After World War II, the U.S. saw a big and sudden increase in the number of babies being born. This is known as the "baby boom." During the war, birth rates were low because many men were away fighting. When millions of soldiers came home, couples were eager to start families.
This led to a sharp rise in births between 1946 and 1964. The birth rate for third and fourth children doubled or even tripled. Many new homes were built in the suburbs to house these growing families. The number of children under five years old grew from 11 million in 1940 to 20 million in the 1960s.
The total number of children under 19 increased by 35.3% from 1950 to 1960. The total fertility rate (the average number of children a woman has) jumped from 2.49 in 1945 to 2.94 in 1946, starting the baby boom. It peaked at 3.77 in 1957 before slowly declining after 1964, ending the boom.
| Year | Fertility rate | Change | White Non-Hispanic |
Black Non-Hispanic |
Hispanic | Asian | Native |
|---|---|---|---|---|---|---|---|
| 1940 | 2.30 | ||||||
| 1941 | 2.40 | ||||||
| 1942 | 2.62 | ||||||
| 1943 | 2.72 | ||||||
| 1944 | 2.58 | ||||||
| 1945 | 2.49 | ||||||
| 1946 | 2.94 | ||||||
| 1947 | 3.27 | ||||||
| 1948 | 3.11 | ||||||
| 1949 | 3.11 | ||||||
| 1950 | 3.10 | ||||||
| 1951 | 3.27 | ||||||
| 1952 | 3.35 | ||||||
| 1953 | 3.42 | ||||||
| 1954 | 3.54 | ||||||
| 1955 | 3.58 | ||||||
| 1956 | 3.68 | ||||||
| 1957 | 3.77 | ||||||
| 1958 | 3.71 | ||||||
| 1959 | 3.69 | ||||||
| 1960 | 3.65 | ||||||
| 1961 | 3.62 | ||||||
| 1962 | 3.46 | ||||||
| 1963 | 3.31 | ||||||
| 1964 | 3.19 | ||||||
| 1965 | 2.91 | ||||||
| 1966 | 2.72 | ||||||
| 1967 | 2.55 | ||||||
| 1968 | 2.46 | ||||||
| 1969 | 2.46 | ||||||
| 1970 | 2.48 | ||||||
| 1971 | 2.27 | ||||||
| 1972 | 2.01 | ||||||
| 1973 | 1.87 | ||||||
| 1974 | 1.83 | ||||||
| 1975 | 1.77 | ||||||
| 1976 | 1.74 | ||||||
| 1977 | 1.79 | ||||||
| 1978 | 1.76 | ||||||
| 1979 | 1.79 | ||||||
| 1980 | 1.84 | ||||||
| 1981 | 1.81 | ||||||
| 1982 | 1.81 | ||||||
| 1983 | 1.80 | ||||||
| 1984 | 1.82 | ||||||
| 1985 | 1.86 | ||||||
| 1986 | 1.85 | ||||||
| 1987 | 1.90 | ||||||
| 1988 | 1.97 | ||||||
| 1989 | 2.03 | 1.77 | 2.42 | 2.90 | 1.95 | 2.25 | |
| 1990 | 2.08 | 1.85 | 2.55 | 2.96 | 2.00 | 2.18 | |
| 1991 | 2.06 | 1.82 | 2.53 | 2.96 | 1.93 | 2.14 | |
| 1992 | 2.04 | 1.80 | 2.48 | 2.96 | 1.89 | 2.14 | |
| 1993 | 2.01 | 1.79 | 2.41 | 2.89 | 1.84 | 2.05 | |
| 1994 | 1.99 | 1.78 | 2.31 | 2.84 | 1.83 | 1.95 | |
| 1995 | 1.97 | 1.78 | 2.19 | 2.80 | 1.80 | 1.88 | |
| 1996 | 1.97 | 1.78 | 2.14 | 2.77 | 1.79 | 1.86 | |
| 1997 | 1.97 | 1.79 | 2.14 | 2.68 | 1.76 | 1.83 | |
| 1998 | 2.00 | 1.83 | 2.16 | 2.65 | 1.73 | 1.85 | |
| 1999 | 2.01 | 1.84 | 2.13 | 2.65 | 1.75 | 1.78 | |
| 2000 | 2.06 | 1.87 | 2.18 | 2.73 | 1.89 | 1.77 | |
| 2001 | 2.03 | 1.84 | 2.10 | 2.75 | 1.84 | 1.75 | |
| 2002 | 2.01 | 1.83 | 2.05 | 2.72 | 1.82 | 1.74 | |
| 2003 | 2.03 | 1.86 | 2.03 | 2.79 | 1.87 | 1.73 | |
| 2004 | 2.04 | 1.85 | 2.02 | 2.82 | 1.90 | 1.73 | |
| 2005 | 2.05 | 1.84 | 2.02 | 2.89 | 1.89 | 1.75 | |
| 2006 | 2.10 | 1.86 | 2.12 | 2.96 | 1.92 | 1.83 | |
| 2007 | 2.12 | 1.87 | 2.13 | 3.00 | 2.04 | 1.87 | |
| 2008 | 2.08 | 1.83 | 2.11 | 2.91 | 2.05 | 1.84 | |
| 2009 | 2.01 | 1.78 | 2.03 | 2.73 | 1.96 | 1.78 | |
| 2010 | 1.93 | 1.79 | 1.97 | 2.35 | 1.69 | 1.40 | |
| Sources | 1970–2009, 2010 | ||||||
Marriage Trends in the U.S.
The U.S. has a high marriage rate compared to many other developed countries. In 2008, about 7.1 out of every 1,000 people got married. The average age for a first marriage has changed over time.
During the Great Depression in the 1930s, fewer people got married. But after World War II ended in 1945, marriages quickly increased. In 1946, over 2 million marriages happened. The average age for first marriages also dropped after the war. In 1956, it was 22.5 for men and 20.1 for women. By 1959, nearly half of all first-time brides were teenagers.
Future Population Growth
The U.S. population has grown a lot over the last century. In 1900, it was 76 million. By 2000, it reached 282 million. Experts predict it could reach between 422 million and 458 million by 2050. This depends on how many people continue to immigrate to the country.
How Demographics Explain History
Economists like Richard Easterlin study how population changes affect history. Easterlin's "relative income" theory tries to explain why there was a "baby boom" and then a "baby bust" (fewer births).
He suggests that couples decide to have children based on how much money they can earn compared to how many material things they want. After the Great Depression and World War II, people wanted fewer material things. There were also many job opportunities. This led to a "high relative income," encouraging more births (the baby boom). Later, the next generation wanted more material things, but jobs were harder to find. This "lower relative income" led to fewer births (the baby bust).
Population Shifts Within States
Between 1880 and 1920, more and more Americans moved to cities. The urban population grew from 28% to 50%. This was partly because 9 million European immigrants arrived. Also, new machines meant fewer farmers were needed, so many moved to cities for factory jobs.
After World War II, there was another big shift. People started moving out of crowded cities and into the suburbs. This happened because land was cheaper, government loans made buying homes easier, and new highways made commuting possible. Many older manufacturing cities lost a lot of their population as people moved to less crowded areas with single-family homes.
 | Selma Burke |
 | Pauline Powell Burns |
 | Frederick J. Brown |
 | Robert Blackburn |


