
Demographics of Alberta facts for kids

Alberta has grown a lot recently, mostly because of its strong economy. Between 2003 and 2004, many babies were born there, lots of people moved in from other countries, and many Canadians moved to Alberta from other provinces. About 81% of people in Alberta live in cities, while only 19% live in rural areas. The area between Calgary and Edmonton is the most urban part of Alberta and is one of Canada's busiest city regions. Many cities and towns in Alberta have also grown quickly. In 1901, Alberta had only 73,022 people. By 2021, it had grown to 4,262,635 people! This means Alberta went from having less than 1.5% of Canada's population to 11.5%. It is now the fourth most populated province in Canada. Between 2016 and 2021, Alberta's population grew by 4.8%.
Contents
How Alberta's Population Has Grown
Alberta's population has increased a lot over the years. For example, in 1901, when it was still part of the North-West Territories, it had just over 73,000 people. By 1951, it had grown to almost a million people. This growth continued steadily, reaching over 4 million people by 2016. This shows how much Alberta has changed and become a popular place to live in Canada.
Where People Live in Alberta
Major City Areas
Alberta has large city areas called census metropolitan areas (CMAs). These are big cities and the towns around them. As of 2021, Alberta has four main CMAs:
- Calgary: This is the largest CMA, with about 1.48 million people in 2021.
- Edmonton: This is the second largest, with about 1.41 million people in 2021.
- Lethbridge: This CMA had about 123,000 people in 2021.
- Red Deer: This CMA had about 100,000 people in 2021.
These CMAs have grown a lot over the years, showing how more and more people are choosing to live in Alberta's bigger cities.
Towns and Communities

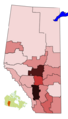
Population growth of Alberta's census subdivisions between 2006 and 2011 censuses
Besides the big cities, many other towns and communities in Alberta have also grown. Some of the larger ones include Strathcona County, St. Albert, Medicine Hat, and Grande Prairie. These places offer different types of living, from busy city life to more spread-out communities.
Different Backgrounds of Albertans
People from many different parts of the world and different backgrounds call Alberta home. This makes Alberta a very diverse place!
Ethnic Origins
The most common ethnic backgrounds reported in Alberta include:
- English: Many people have English roots.
- German: A large number of Albertans have German heritage.
- Scottish: Scottish ancestry is also very common.
- Irish: Many people also report Irish origins.
- Canadian: Some people identify simply as Canadian.
- Ukrainian: There's a significant Ukrainian community in Alberta.
- French: French heritage is also present.
- Filipino: The number of people with Filipino backgrounds has grown a lot.
- First Nations: Indigenous peoples, like First Nations, are an important part of Alberta's population.
- Chinese: The Chinese community has also grown over the years.
- Dutch: Many Albertans have Dutch ancestry.
- Polish: Polish heritage is also common.
- Indian: The number of people with Indian backgrounds has increased significantly.
This mix of cultures makes Alberta a vibrant and interesting place to live.
Future Population Mix
Experts predict that Alberta will continue to become even more diverse in the future. By 2041, it's expected that the number of people with South Asian, Southeast Asian, Indigenous, African, East Asian, and Middle Eastern backgrounds will grow significantly. This means Alberta will be an even more multicultural province in the years to come.
Visible Minorities and Indigenous Peoples
Indigenous and visible minority identity (2021): European Canadian (65.4%) Visible minority (27.8%) First Nations (3.5%) Métis (3.1%) Inuit (0.1%) Other Indigenous (0.2%)

Largest panethnic groups in Alberta by percentage of total population by census division, 2021 census
In 2021, about 65.4% of Alberta's population identified as having European roots. About 27.8% of the population identified as a Visible minority group. The largest visible minority groups include:
Indigenous peoples make up about 6.8% of Alberta's population. This includes:
- First Nations (3.5%)
- Métis (3.1%)
- Inuk (Inuit) (0.1%)
Languages Spoken in Alberta
Knowing Different Languages
| Knowledge of official languages of Canada in Alberta (2016) | ||||
|---|---|---|---|---|
| Language | Percent | |||
| English only | 91.86% | |||
| French only | 0.10% | |||
| English and French | 6.57% | |||
| Neither English nor French | 1.47% | |||
Most people in Alberta know English. In 2021, about 98.46% of people could speak English. Many also know French, which is another official language of Canada. About 6.65% of Albertans could speak French in 2016.
Besides English and French, many other languages are spoken in Alberta. Some of the most common ones include:
- Tagalog (from the Philippines)
- Punjabi (from India)
- Spanish
- Hindi (from India)
- Mandarin (a Chinese language)
- Arabic
- Cantonese (another Chinese language)
- German
- Urdu (from Pakistan and India)
Mother Tongue
Languages of Alberta (2021): English (76.6%) French (2.1%) Indigenous language (0.6%) Other language (20.9%) Multiple (2.3%)
Your "mother tongue" is the first language you learned at home. In Alberta, the most common mother tongue is English, spoken by about 76.6% of people in 2021.
Other common mother tongues include:
- Tagalog (Filipino/Pilipino)
- Chinese (including Mandarin and Cantonese)
- Punjabi
- French
- Spanish
- German
- Arabic
- Urdu
- Vietnamese
- Languages from the Niger-Congo family (like Yoruba and Swahili)
- Indigenous languages (like Cree and Blackfoot)
Many people in Alberta also speak more than one language at home, showing the rich language diversity of the province.
Religions in Alberta
Religious affiliation (2021): Christian (48.1%) Muslim (4.8%) Sikh (2.5%) Hindu (1.9%) Buddhist (1.0%) Jewish (0.3%) Aboriginal spirituality (0.5%) Other religions (0.8%) Irreligious (40.1%)
Christian sub-affiliation (2021): Roman Catholic (41.4%) United Church (7.7%) Anglican (4.8%) Lutheran (3.9%) Orthodox (3.2%) Pentecostal (2.7%) Latter Day Saints (2.3%) Baptist (2.2%) Presbyterian (1.1%) Jehovah's Witnesses (0.9%) Reformed (0.7%) Other Christian (26.9%)
Alberta is home to people of many different faiths. In 2021, just under half of Albertans (48.1%) identified as Christian. However, a large number of residents (over 40%) said they had no religion.
Among Christians, the largest groups are:
- Roman Catholic
- United Church
- Anglican
- Lutheran
- Eastern Orthodox and Oriental Orthodox Churches
Alberta also has many followers of other religions:
- Muslim is the second largest religion, with 4.8% of the population. Canada's first mosque, Al-Rashid Mosque, was built in Edmonton in 1938.
- Sikh (2.5%)
- Hindu (1.9%)
- Buddhist (1.0%)
- Jewish (0.3%)
This wide range of beliefs shows how diverse Alberta's population is.
People Moving to Alberta
Coming from Other Countries

Many people move to Alberta from other countries. In 2021, about 23.2% of Alberta's population were immigrants, meaning they were born outside Canada.
The top countries people have moved from to Alberta include:
- Philippines
- India
- China
- United Kingdom
- Pakistan
- United States
- Vietnam
- Nigeria
Alberta has always been a place where people from all over the world come to build a new life.
Moving from Other Provinces
Alberta has also seen many people move there from other parts of Canada. Over the last 50 years, Alberta has had the highest number of people moving in from other provinces compared to any other province.
This often happens because of Alberta's oil industry. When oil prices are good, many Canadians move to Alberta for work. However, when oil prices drop, fewer people move in, and some might even leave. For example, after a big drop in oil prices in 2014, fewer people moved to Alberta. But in recent years, more people have started moving to Alberta again.
Images for kids
-
Alberta's census divisions by population

See also
- Demographics of Calgary
- Demographics of Canada
- Demographics of Edmonton
- Population of Canada by province and territory
