kids encyclopedia robot

Economy of Wales facts for kids

Kids Encyclopedia Facts
Quick facts for kids
Economy of Wales
Golygfa gyffredinol Bae Caerdydd.jpg
Cardiff: Wales's capital city
Currency Pound sterling (GBP)
Statistics
GDP Increase£77.5billion (2019)
GDP growth
Increase2.7% (2019)
GDP per capita
Increase£24,586 (2019)
Population below poverty line
Steady23% (2020)
Labour force
Increase1.428 million (September 2015)
Unemployment 3.9% (July 2021)
Main industries
Agriculture, aerospace, construction, electronics, emergency services, food, forestry, manufacturing, oil and gas, renewable energy, services, textiles, tourism, transport
External
Exports Decrease £13.4 billion (2020)
(2019: £17.7 billion)
Export goods
Aerospace systems, business and financial services, cereals, chemical products, dairy products, electricity, electronics, iron and steel, machinery, oil and gas, pharmaceuticals, plastics, renewable energy, road vehicles, textiles, timber, water
Main export partners
Excluding the rest of the  UK

All values, unless otherwise stated, are in US dollars.

The monetary policies which create the economy of Wales are, on the whole, created by the United Kingdom Government and as such, Wales is not allowed to borrow money, issue bonds, exercise quantitative easing etc. In 2017, the area of lowest income in Northern Europe was West Wales and the Valleys. This featured alongside nine other regions of similar income lying in England and mainland Europe.

The percentage of all individuals, living in relative income poverty in Wales in 2016–17 was 23%, compared to 22% in England, and only 19% in Scotland and Northern Ireland. More than one in five people in Wales were living in poverty between 2001 and 2016.

However, in 2018, according to OECD and Eurostat data, gross domestic product (GDP) in Wales was £75 billion, an increase of 3.3% from 2017. GDP per head in Wales in 2018 was £23,866, an increase of 2.9% on 2017. In 2019 Wales generated tax revenue of £27bn, which is around 36% of GDP, and has expenditure of £40.1bn, leaving an deficit of £13.1bn.

Economy by country and region

Map of GDP per capita in the UK in 2007 (NUTS 3)
A map of the UK divided by the average GDP per capita in 2007 (in euros) showing the distribution of economic activity

According to Eurostat figures there are huge regional disparities in the UK with GDP per capita ranging from €15,000 in West Wales to €179,800 in Inner-London West. There are 26 areas in the UK where the GDP per person is under €20,000.

These areas are the following:

  • 4.5 million (8.5% of English) live in these deprived English districts. 11 of these deprived regions in England: Durham, Northumberland, Greater Manchester North, Blackpool, Sefton, Wirral, Barnsley Doncaster Rotherham, South Nottinghamshire, Dudley, Outer London – East North East, Torbay
  • 1.4 million (45% of Welsh) live in these deprived Welsh districts. 6 of these deprived regions in Wales: Isle of Anglesey, Conwy & Denbighshire, South West Wales, Central Valleys, Gwent Valley, Powys
  • 1.1 million (20% of Scottish) live in these deprived Scottish districts. 5 of these deprived regions in Scotland: Clackmannshire & Fife, East & Mid Lothian, East & West Dumbartonshire, East & North Ayrshire, Caithness Sutherland & Ross,
  • 1.1 million (60% of Northern Irish) live in these deprived Northern Irish districts.3 of these in Northern Ireland: Outer Belfast, North of Northern Ireland, West & South of Northern Ireland.

Regional variations

In recent years, Cardiff, the northern and southern coastal belts and some rural parts of Wales have experienced the biggest increase in employment, while the South Wales Valleys and other industrial towns have suffered a decline. This pattern probably reflects a combination of

  • the increasing importance of quality of life factors in location decisions;
  • the greater role played by the largest conurbations as centres of service sector businesses and
  • the effects of skill-biased technical change on the demand for labour, disadvantaging "skills poor" declining industrial districts.

Average earnings and employment vary considerably across Wales. They are both generally higher in east Wales, especially in urban areas, but lower in south west Wales and the Valleys, although earnings in Bridgend and Neath Port Talbot, which are still centres of skilled manufacturing employment, are relatively high. In north and north west Wales, earnings are low but the employment rates are above the Welsh average.

A significant part of the earnings (and value added per job) variations within Wales are due to structural factors such as economic mass and occupational mix rather than like-for-like lower pay or productivity. Cardiff, with over 400,000 people, benefits from its size, capital status, a hinterland in south east Wales and good connections to London and the M4 corridor. Cardiff is the primary location for service sector activities in Wales, with 26% of Welsh service sector output and 22% of Welsh service sector employment, compared to 19% of all employment in Wales. North east Wales benefits from proximity to Cheshire, Greater Manchester and Merseyside and there is significant cross-border commuting. The Valleys and the western areas of Wales have less economic mass and are more distant from major economic centres. These are some of the poorest regions in Europe and qualify for Objective One funding.

Many parts of Wales suffered from a continuous decline in heavy industry over the 20th century, culminating in the virtual disappearance of coal-mining in the 1980s. The demise of 'smokestack' industries left a legacy of high unemployment, and although unemployment has declined in recent years, unemployment in West Wales and the Valleys still tends to be higher than the Welsh average and economic inactivity (a form of hidden unemployment) continues to be a major problem in these areas. Merthyr Tydfil and Neath Port Talbot have some of the largest proportions of people in the UK not working due to long-term illness or disability, though some believe that in reality many people classified as "unable to work" through sickness are low-skilled workers encouraged to exit the labour market by the benefits system as well as declining demand for their skills.

The figures below for 2013 come from Eurostat and are denoted in Euros.

Regions (NUTS3) GDP € (2013) GDP per capita € (2013) GDP € (2016) GDP per capita € (2016)
Isle of Anglesey €1.167 bn €16,700 Increase €1.305 bn Increase €18,600
Gwynedd €2.956 bn €24,200 Increase €3.224 bn Increase €26,000
Conwy & Denbighshire €4.246 bn €20,200 Increase €4.767 bn Increase €22,600
South West Wales €7.678 bn €20,000 Increase €8.723 bn Increase €22,700
Central Valleys €5.939 bn €20,100 Increase€6.812 bn Increase €22,900
Gwent Valleys €5.962 bn €17,500 Increase €6.923 bn Increase €20,200
Bridgend & Neath Port Talbot €6.016 bn €21,500 Increase €7.240 bn Increase €25,400
Swansea €5.532 bn €23,100 Increase €6.332 bn Increase €25,800
Monmouthshire & Newport €6.322 bn €26,500 Increase €7.260 bn Increase €30,000
Cardiff & Vale of Glamorgan €14.361 bn €30,000 Increase €16.590 bn Increase €33,900
Flintshire & Wrexham €8.346 bn €28,800 Increase €9.374 bn Increase €32,200
Powys €2.869 bn €21,600 Increase €3.134 bn Increase €23,700
TOTAL 71.396 bn 23,200 81.683 bn 26,200

The GDP per head for Wales was €23,200, which was 84% of the EU average of €26,600, whereas for the UK as a whole this figure was 118%. The region of Wales with the highest GDP per head was Cardiff & Vale of Glamorgan with 114% of the EU average, and the region with the lowest GDP per head was Isle of Anglesey with 57% of the EU average.

Sectors

Agriculture and forestry

"Why has Nigel locked our Mums in there" - geograph.org.uk - 1423470
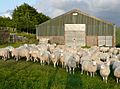
Sheep at Ty'n-y-Cornel farm, near Tregaron in West Wales

In 2003, agriculture contributed £418 million to Welsh GVA, or 1.1% (including subsidies). 1.6m hectares (around 77% of Wales' total land area) is used for agricultural production and an estimated 57,500 people are directly employed in the sector. Farming is dominated by beef, sheep and the dairy sector, with the arable sector accounting for 10% of agricultural output. Average farm size is 30–40 hectares, small by UK standards, and dominated by family-run enterprises.

Forest and woodland makes up 14% of the land area of Wales and there are 4,000 jobs and in forest-based industries.

The Welsh fishing industry is the smallest in the UK, with about 1,000 full-time and 400 part-time fishermen. The minor role that the Welsh industry holds is largely due to its geographical isolation, weak distribution networks and the demise of the Wales distant-water fleet from the 1960s onwards.

Manufacturing

Port talbot large
Port Talbot Steelworks, one of the last remaining heavy industrial plants in south Wales

Wales has a diverse manufacturing sector. Heavy industry, once a mainstay of the Welsh economy, has largely been in decline over the past century but is still very apparent. Metal ore refining is a long established industry in Wales. As of 2007, Corus had manufacturing facilities at Port Talbot, Llanwern, Newport, Trostre, Shotton, Ammanford, Pontardulais, Tafarnaubach and Caerphilly, although only the Port Talbot Steelworks remains as a major integrated steelmaking plant. Nearly all the tinplate and much of the aluminium produced in the UK are made in Welsh plants.

Milford Haven has two oil refineries: around a fifth of United Kingdom capacity.

Wales is an important producer of automotive components: Ford has a major engine plant at Bridgend, and BorgWarner has a major components plant in Kenfig, South Wales.

Timet has a plant in Waunarlwydd, Swansea, which is one of the world's major suppliers of titanium for jet engine blades and medical applications.

During the 1980s and 1990s, a major growth sector in manufacturing was the electronics industry with over 130 North American and 35 Japanese companies establishing operations in Wales. However, this is a characteristic of a "branch factory" economy where routine production is located in one region while higher skill activities are located in another.

Major trading partners

Excluding intra UK trade, the European Union and the United States constitute the largest markets for Wales's exports. As part of the United Kingdom and the European Union, Wales fully participates in the single market and free trade area which exists across all EU member states and regions. Recently, with the high rates of growth in many emerging economies of southeast Asia and the Middle East such as China, UAE and Singapore, there has been a drive towards marketing Welsh products and manufactured goods in these countries, with China and Qatar entering the top ten destinations for Welsh exports in 2013.

Top 10 export destinations, 2015
Destination Value
 United States Decrease£2.80 billion
 UAE Decrease£1.05 billion
 Germany Decrease£1.04 billion
 Ireland Decrease£1.03 billion
 France Increase£0.65 billion
 Netherlands Decrease£0.60 billion
 Belgium Decrease£0.49 billion
 Singapore Decrease£0.29 billion
 Qatar Decrease£0.29 billion
 Japan Increase£0.29 billion
Source: Welsh exports: Fourth quarter 2015

The total value of international exports from Wales in 2015 was estimated at £12.2 billion (2014: £13.4 billion). The top five exporting industries in 2013 were power generating machinery £4.0 billion (2013: £4.2 billion), petroleum, petroleum products & related materials £2.6 billion (2013: £3.8 billion), Iron & Steel £1.288 billion (2013: £1.3 billion), electric machinery £0.69 billion (2013: £0.7 billion), and professional and scientific services £0.346 billion (2013: £0.353 billion).

Services

In recent years, the service sector in Wales has seen above average growth; however in 2005 its share of GVA was small compared with most other regions of the UK. Wales does not have a favourable occupational structure, and a relatively high proportion of jobs are in public administration, health and education. Compared to more prosperous parts of the UK, Wales lacks high value added service sector employment in sectors such as finance, business services and research and development. This is partly due to a weaker agglomeration effect, due to the small size of towns and cities in Wales compared to some other UK regions and small countries.

Tourism

With its mountainous landscape and numerous sandy beaches, Wales attracts significant tourism. In 2002, nearly 13 million trips of one night or more were made in Wales, generating expenditure of £1.8 billion. Of these trips, 11.9 million were made by UK residents and 0.9 million by overseas visitors. Cardiff is the most popular destination for visitors to Wales, with 11.7 million visitors in 2006.

In 2014, over 10 million domestic trips of one night or more were made in Wales, generating expenditure of £1.7 billion.

Wales' top 10 tourist attractions (2014)
Attraction No of Visitors
Wales Millennium Centre Increase1,197,566
The LC Increase774,617
St Fagans National History Museum Increase564,195
Folly Farm Adventure Park and Zoo Increase485,936
Cyfarthfa Castle Museum Decrease481,907
National Museum Cardiff Decrease442,972
Pembrey Country Park Increase440,000
Elan Valley Visitor Centre 400,000
Snowdon Summit Visitor Centre 393,432
Cardiff Castle Increase272,327
Source: Visits to Tourist Attractions in Wales 2014

Property

In November 2008, the average price of a house in Wales was £126,181, a fall of 11.7% since the previous year. The average house price in England and Wales as a whole was £161,883. In August 2008, average house prices in Wales ranged from £109,000 in Blaenau Gwent to £238,000 in Monmouthshire.

Economy by region

Map of GDP per capita in the UK in 2007 (NUTS 3)
A map of the UK divided by the average GDP per capita in 2007 (in euros) showing the distribution of economic activity

According to Eurostat figures there are huge regional disparities in the UK with GDP per capita ranging from €15,000 in West Wales to €179,800 in Inner-London West. There are 26 areas in the UK where the GDP per person is under €20,000.

These areas are the following:

  • 4.5 million (8.5% of English) live in these deprived English districts. 11 of these deprived regions in England: Durham, Northumberland, Greater Manchester North, Blackpool, Sefton, Wirral, Barnsley Doncaster Rotherham, South Nottinghamshire, Dudley, Outer London – East North East, Torbay
  • 1.4 million (45% of Welsh) live in these deprived Welsh districts. 6 of these deprived regions in Wales: Isle of Anglesey, Conwy & Denbighshire, South West Wales, Central Valleys, Gwent Valley, Powys
  • 1.1 million (20% of Scottish)live in these deprived Scottish districts. 5 of these deprived regions in Scotland: Clackmannshire & Fife, East & Mid Lothian, East & West Dumbartonshire, East & North Ayrshire, Caithness Sutherland & Ross,
  • 1.1 million (60% of Northern Irish) live in these deprived Northern Irish districts.3 of these in Northern Ireland: Outer Belfast, North of Northern Ireland, West & South of Northern Ireland.

Comparison with France and Ireland

In Wales, GDP per capita varies from €15,000 in Isle of Anglesey to €30,400 in Cardiff.

When compared to France, GDP per capita ranges from €18,900 in French Overseas Territories to €92,300 in Hauts-de-Seine and France has only 4 regions where GDP per capita is under €20,000. This suggests the level of social equality is much greater in France than in the UK.

When compared to the Republic Of Ireland, GDP per capita ranges from €20,100 in the Irish Midlands to €57,200 in Dublin. There are no regions in Ireland where GDP per person is under €20,000.

Regional variations

In recent years, Cardiff, the northern and southern coastal belts and some rural parts of Wales have experienced the biggest increase in employment, while the South Wales Valleys and other industrial towns have suffered a decline. This pattern probably reflects a combination of

  • the increasing importance of quality of life factors in location decisions;
  • the greater role played by the largest conurbations as centres of service sector businesses and
  • the effects of skill-biased technical change on the demand for labour, disadvantaging "skills poor" declining industrial districts.

Average earnings and employment vary considerably across Wales. They are both generally higher in east Wales, especially in urban areas, but lower in south west Wales and the Valleys, although earnings in Bridgend and Neath Port Talbot, which are still centres of skilled manufacturing employment, are relatively high. In north and north west Wales, earnings are low but the employment rates are above the Welsh average.

A significant part of the earnings (and value added per job) variations within Wales are due to structural factors such as economic mass and occupational mix rather than like-for-like lower pay or productivity. Cardiff, with 324,800 people, benefits from its capital status, a hinterland in south east Wales and good connections to London, the Greater Bristol area and the M4 corridor. Cardiff is the primary location for service sector activities in Wales, with 26% of Welsh service sector output and 22% of Welsh service sector employment, compared to 19% of all employment in Wales. North east Wales benefits from proximity to Cheshire, Greater Manchester and Merseyside and there is significant cross-border commuting. The Valleys and the western areas of Wales have less economic mass and are more distant from major economic centres. These are some of the poorest regions in Europe and qualify for Objective One funding.

Many parts of Wales suffered from a continuous decline in heavy industry over the 20th century, culminating in the virtual disappearance of coal-mining in the 1980s. The demise of 'smokestack' industries left a legacy of high unemployment, and although unemployment has declined in recent years, unemployment in West Wales and the Valleys still tends to be higher than the Welsh average and economic inactivity (a form of hidden unemployment) continues to be a major problem in these areas. Merthyr Tydfil and Neath Port Talbot have some of the largest proportions of people in the UK not working due to long-term illness or disability, though some believe that in reality many people classified as "unable to work" through sickness are low-skilled workers encouraged to exit the labour market by the benefits system as well as declining demand for their skills.

The figures below for 2013 come from Eurostat and are denoted in Euros.

Regions (NUTS3) GDP € GDP per capita €
Isle of Anglesey €1.1 bn €15,000
Gwynedd €2.9 bn €23,700
Conwy & Denbighshire €4.1 bn €19,700
South West Wales €7.0 bn €18,100
Central Valleys €5.6 bn €18,900
Gwent Valleys €6.0 bn €17,600
Bridgend & Neath Port Talbot €5.8 bn €20,600
Swansea €5.5 bn €23,100
Monmouthshire & Newport €6.3 bn €26,500
Cardiff & Vale of Glamorgan €14.6 bn €30,400
Flintshire & Wrexham €7.4 bn €25,700
Powys €2.6 bn €19,600
TOTAL 68.8 bn 22,300

The GDP per head for Wales was €22,300, which was 84% of the EU average of €26,600, whereas for the UK as a whole this figure was 118%. The region of Wales with the highest GDP per head was Cardiff & Vale of Glamorgan with 114% of the EU average, and the region with the lowest GDP per head was Isle of Anglesey with 57% of the EU average.

Infrastructure

Transport

Rail network of Wales 2021
Railway lines in Wales
CardiffAirport1
Cardiff Airport

Rail

Wales is one of the few countries in the world where you must travel through another country when traveling from the capital to the furtherst point of that country, with nearly all line going East to West, rather than north–south. Rail infrastructure is not devolved to Wales; Wales has 11% of the rail network of Wales and England and 5.3% of the population, however the income received from Westminster in 2019-20 was 1.6%. In 2021 there were no electrified lines in Wales.

Many major English cities, however, have direct rail connections to Wales. The South Wales coast as far as Swansea is served by the South Wales Main Line which passes under the Severn Estuary through the Severn Tunnel; the West Wales Line connects it to the Pembrokeshire ferry ports. The main north–south railway line is the Welsh Marches Line between Newport and Shrewsbury enabling direct services between Holyhead and Cardiff. An urban rail network, serving 81 stations, is focused on the capital, Cardiff. Mid and North Wales (away from the coast) are served by a limited number of branch lines, some of which connect with revived narrow gauge railways.

Roads

The M4 motorway, A449, A465, A48, A40, and A477 in the south, the A55 and A483 plus border links in the north, form part of the Trans-European Road Network.

Ports

Wales has ten main commercial ports. Milford Haven is the UK's largest energy port and is capable of delivering 30% of the UK gas demand. Newport is the busiest UK port for iron and steel and Port Talbot is the third busiest for ores.

Airports

Cardiff Airport is the only Welsh airport offering international scheduled flights. In 2007, Anglesey Airport became a public airport. The UK Government's Treasury has repeatedly refused Welsh Government calls to devolve Air Passenger Duty, as doing so would give Cardiff Airport an advantage over Bristol Airport.

Telecommunications

On 28 November 2006, a trial of a new telecommunications network technology was rolled out in the village of Wick in the Vale of Glamorgan. The new network BT 21CN, offers broadband data transfer speeds of up to 24Mbit/s.

Energy and utilities

The Dinorwig HEP station inlet and outlet pool - geograph.org.uk - 311036
The Dinorwig Power Station largest pumped storage power station in Europe

In 2018, the annual production of electricity in Wales was 30.2 TWh and consumed 14.9 TWh, which means that Wales generates twice as much electricity as it consumes and is a net exporter of electricity to England, Ireland and Europe. In the same year, 25% was from renewable sources, up from 22% in 2017. Electricity generation encompasses a broad mix of technologies including Coal (e.g. Aberthaw), Gas (e.g. Baglan Bay), Wind (Cefn Croes), hydro-electricity (Dinorwig), solar thermal/PV and biomass electricity.

In 2017, the Welsh Government announced a target of meeting 70% of Wales’ electricity demand from Welsh renewable electricity sources by 2030. By 2018, Wales generated over 3,864 MW renewable energy from 68,728 projects.

In June 2018 the Welsh Government backed the Tidal Lagoon Swansea Bay project with an offer to invest £200 million; the project would see the world's largest tidal hydro-electricity plant. However, in June 2018, the UK Government refused to back the plan.

In 2021, the Welsh government said that more than half the country's energy needs were being met by renewable sources, 2 percent of which was from 363 hydropower projects.

Images for kids

See also

Kids robot.svg In Spanish: Economía de Gales para niños

kids search engine
Economy of Wales Facts for Kids. Kiddle Encyclopedia.