Tom Green County, Texas facts for kids
Quick facts for kids
Tom Green County
|
||
|---|---|---|
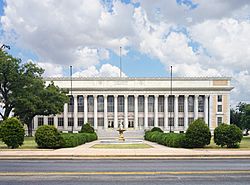
Tom Green County Courthouse in San Angelo
|
||
|
||
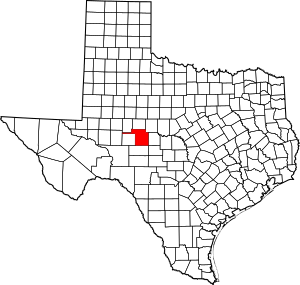
Location within the U.S. state of Texas
|
||
 Texas's location within the U.S. |
||
| Country | ||
| State | ||
| Founded | 1875 | |
| Named for | General Thomas Green | |
| Seat | San Angelo | |
| Largest city | San Angelo | |
| Area | ||
| • Total | 1,541 sq mi (3,990 km2) | |
| • Land | 1,522 sq mi (3,940 km2) | |
| • Water | 19 sq mi (50 km2) 1.2% | |
| Population
(2020)
|
||
| • Total | 120,003 |
|
| • Density | 78/sq mi (30/km2) | |
| Time zone | UTC−6 (Central) | |
| • Summer (DST) | UTC−5 (CDT) | |
| Congressional district | 11th | |
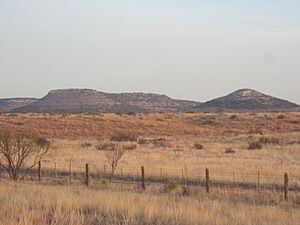
Tom Green County is a county located in the state of Texas, USA. It sits on a high flat area called the Edwards Plateau. In 2020, about 120,003 people lived here. The main city and county seat is San Angelo.
The county was created in 1874 and started operating in 1875. It is named after Thomas Green, who was a lawyer and a general in the Confederate Army during the American Civil War. Tom Green County is part of the San Angelo metropolitan area. It is also home to Goodfellow Air Force Base and Angelo State University, which is part of the Texas Tech University System.
Contents
History of Tom Green County
The state government officially created Tom Green County on March 13, 1874. It was named after Thomas Green, a general from the Confederate States Army. When it was first formed, the county was very large, covering over 60,000 square miles (155,000 km2).
Early County Seat and a Big Flood
The first county seat was a town called Ben Ficklin. But in 1882, a big flood from the Concho River destroyed the town. Sadly, 65 people drowned. After this disaster, the county seat was moved to a nearby town called Santa Angela. In 1883, the U.S. Post Office officially changed the town's name to San Angelo.
Growth and Changes
After the Santa Fe Railway was finished in September 1888, the county started sending out many cattle by train. Between 3,500 and 5,000 train cars of cattle were exported. In 1889, San Angelo became an official city. Around the same time, Fort Concho, a military fort that had been open for 22 years, closed down.
The Unusual Shape of the County
Tom Green County has a long, narrow strip of land that stretches to the west. This unique shape exists because Reagan County, which is to the west, used to be part of Tom Green County. Texas law required that all parts of a county had to be connected to the county seat by land. So, this small strip of land was created to connect the two main areas. In 1903, people in the western part voted to form Reagan County. They also decided that the connecting strip would stay part of Tom Green County.
Weather Events
In 2021, during a big winter storm called Uri, San Angelo experienced very cold temperatures. It was at or below freezing for 152 hours straight. Tom Green County has also been affected by hurricanes and tropical storms, including:
- Hurricane Matagorda (1942)
- Tropical Storm Delia (1973)
- Hurricane Gilbert (1988)
- Tropical Storm Erin (2007)
- Tropical Storm Hermine (2010)
Geography of Tom Green County
Tom Green County covers a total area of about 1,541 square miles (3,991 km2). Most of this is land (1,522 square miles or 3,942 km2), and a small part is water (19 square miles or 49 km2), which is about 1.2% of the total area.
Lakes and Rivers
The county has several important water bodies and protected areas, including:
- Lake Nasworthy
- O.C. Fisher Reservoir
- Twin Buttes Reservoir
- San Angelo State Park
- Heart of Texas Wildlife Trail
The county is also home to the Concho Rivers, including the North Concho River and South Concho River. There is also a small stream called Kickapoo Creek.
Neighboring Counties
Tom Green County shares borders with these other counties:
- Coke County (north)
- Runnels County (northeast)
- Concho County (east)
- Menard County (southeast)
- Schleicher County (south)
- Irion County (west)
- Reagan County (west)
- Sterling County (northwest)
People of Tom Green County
| Historical population | |||
|---|---|---|---|
| Census | Pop. | %± | |
| 1880 | 3,615 | — | |
| 1890 | 5,152 | 42.5% | |
| 1900 | 6,804 | 32.1% | |
| 1910 | 17,882 | 162.8% | |
| 1920 | 15,210 | −14.9% | |
| 1930 | 36,033 | 136.9% | |
| 1940 | 39,302 | 9.1% | |
| 1950 | 58,929 | 49.9% | |
| 1960 | 64,630 | 9.7% | |
| 1970 | 71,047 | 9.9% | |
| 1980 | 84,784 | 19.3% | |
| 1990 | 98,458 | 16.1% | |
| 2000 | 104,010 | 5.6% | |
| 2010 | 110,224 | 6.0% | |
| 2020 | 120,003 | 8.9% | |
| U.S. Decennial Census 1850–2010 2010 2020 |
|||
Population and Diversity
In 2020, Tom Green County had 120,003 people. The county is home to a diverse group of people. The table below shows the different racial and ethnic groups living in the county over the years.
| Race / Ethnicity (NH = Non-Hispanic) | Pop 2000 | Pop 2010 | Pop 2020 | % 2000 | % 2010 | % 2020 |
|---|---|---|---|---|---|---|
| White alone (NH) | 65,508 | 63,799 | 62,390 | 62.98% | 57.88% | 51.99% |
| Black or African American alone (NH) | 4,122 | 3,997 | 4,010 | 3.96% | 3.63% | 3.34% |
| Native American or Alaska Native alone (NH) | 380 | 406 | 366 | 0.37% | 0.37% | 0.30% |
| Asian alone (NH) | 855 | 1,046 | 1,704 | 0.82% | 0.95% | 1.42% |
| Pacific Islander alone (NH) | 53 | 78 | 143 | 0.05% | 0.07% | 0.12% |
| Other Race alone (NH) | 88 | 129 | 369 | 0.08% | 0.12% | 0.31% |
| Mixed Race or Multiracial (NH) | 1,058 | 1,454 | 3,955 | 1.02% | 1.32% | 3.30% |
| Hispanic or Latino (any race) | 31,946 | 39,315 | 47,066 | 30.71% | 35.67% | 39.22% |
| Total | 104,010 | 110,224 | 120,003 | 100.00% | 100.00% | 100.00% |
In 2000, there were 104,010 people living in the county. About 39,503 households and 26,783 families were counted. The average number of people in a household was 2.52, and for families, it was 3.09.
The median age in the county was 34 years old. This means half the people were younger than 34 and half were older.
Education in Tom Green County
Tom Green County offers various educational opportunities for its residents.
Colleges and Universities
- Angelo State University
- Howard College
Public School Districts
- Christoval Independent School District
- Grape Creek Independent School District
- Miles Independent School District
- San Angelo Independent School District
- Veribest Independent School District
- Wall Independent School District
- Water Valley Independent School District
Transportation
Major Highways
Communities in Tom Green County
City
- San Angelo (This is the county seat, where the main county government offices are located.)
Census-Designated Places
These are areas identified by the U.S. Census Bureau for statistical purposes.
Unincorporated Communities
These are smaller towns or areas that do not have their own local government.
Ghost Town
- Ben Ficklin (A town that no longer exists, often due to a historical event.)
Military Base
- Goodfellow Air Force Base
Politics
| Year | Republican | Democratic | Third party | |||
|---|---|---|---|---|---|---|
| No. | % | No. | % | No. | % | |
| 2024 | 33,399 | 73.47% | 11,585 | 25.48% | 477 | 1.05% |
| 2020 | 32,313 | 71.47% | 12,239 | 27.07% | 658 | 1.46% |
| 2016 | 27,494 | 71.45% | 9,173 | 23.84% | 1,812 | 4.71% |
| 2012 | 26,878 | 73.20% | 9,294 | 25.31% | 548 | 1.49% |
| 2008 | 27,362 | 70.41% | 11,158 | 28.71% | 341 | 0.88% |
| 2004 | 28,185 | 75.33% | 9,007 | 24.07% | 225 | 0.60% |
| 2000 | 24,733 | 71.43% | 9,288 | 26.82% | 605 | 1.75% |
| 1996 | 18,112 | 55.21% | 11,782 | 35.91% | 2,914 | 8.88% |
| 1992 | 14,989 | 40.80% | 11,437 | 31.13% | 10,313 | 28.07% |
| 1988 | 21,463 | 63.10% | 12,283 | 36.11% | 266 | 0.78% |
| 1984 | 23,847 | 72.46% | 8,981 | 27.29% | 82 | 0.25% |
| 1980 | 16,555 | 60.71% | 9,892 | 36.27% | 824 | 3.02% |
| 1976 | 12,316 | 52.29% | 11,064 | 46.97% | 174 | 0.74% |
| 1972 | 15,784 | 71.87% | 6,082 | 27.69% | 95 | 0.43% |
| 1968 | 9,682 | 49.56% | 6,774 | 34.67% | 3,080 | 15.77% |
| 1964 | 6,664 | 40.53% | 9,767 | 59.40% | 12 | 0.07% |
| 1960 | 8,176 | 53.63% | 7,031 | 46.12% | 39 | 0.26% |
| 1956 | 9,070 | 64.63% | 4,923 | 35.08% | 40 | 0.29% |
| 1952 | 9,698 | 62.49% | 5,797 | 37.35% | 24 | 0.15% |
| 1948 | 1,822 | 19.99% | 6,777 | 74.34% | 517 | 5.67% |
| 1944 | 1,125 | 13.54% | 6,272 | 75.51% | 909 | 10.94% |
| 1940 | 1,049 | 13.99% | 6,433 | 85.81% | 15 | 0.20% |
| 1936 | 627 | 11.40% | 4,803 | 87.34% | 69 | 1.25% |
| 1932 | 739 | 12.93% | 4,957 | 86.75% | 18 | 0.32% |
| 1928 | 2,618 | 63.11% | 1,528 | 36.84% | 2 | 0.05% |
| 1924 | 554 | 19.83% | 2,116 | 75.73% | 124 | 4.44% |
| 1920 | 256 | 15.52% | 1,264 | 76.61% | 130 | 7.88% |
| 1916 | 92 | 6.52% | 1,243 | 88.16% | 75 | 5.32% |
| 1912 | 50 | 4.48% | 906 | 81.18% | 160 | 14.34% |
| Year | Republican | Democratic | Third party(ies) | |||
|---|---|---|---|---|---|---|
| No. | % | No. | % | No. | % | |
| 2024 | 31,686 | 70.15% | 12,332 | 27.30% | 1,152 | 2.55% |
Tom Green County typically votes for the Republican Party in presidential elections. This means that more people in the county usually vote for the Republican candidate than for candidates from other parties.
Notable Person
- August Pfluger is a politician and former military officer. He currently represents Texas's 11th congressional district in the U.S. House of Representatives.
See also
 In Spanish: Condado de Tom Green para niños
 | Percy Lavon Julian |
 | Katherine Johnson |
 | George Washington Carver |
 | Annie Easley |


