
1856 United States presidential election facts for kids
|
|||||||||||||||||||||||||||||||||||||||||
|
296 members of the Electoral College 149 electoral votes needed to win |
|||||||||||||||||||||||||||||||||||||||||
|---|---|---|---|---|---|---|---|---|---|---|---|---|---|---|---|---|---|---|---|---|---|---|---|---|---|---|---|---|---|---|---|---|---|---|---|---|---|---|---|---|---|
| Turnout | 78.9% |
||||||||||||||||||||||||||||||||||||||||
|
|||||||||||||||||||||||||||||||||||||||||
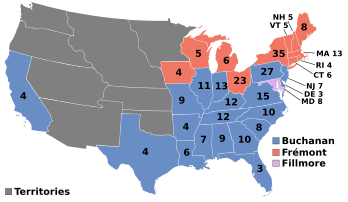 Presidential election results map. Blue denotes states won by Buchanan/Breckinridge, red by Frémont/Dayton, and lilac by Fillmore/Donelson. Numbers indicate the number of electoral votes cast by each state.
|
|||||||||||||||||||||||||||||||||||||||||
|
|||||||||||||||||||||||||||||||||||||||||
.jpg)
.jpg)
The 1856 United States presidential election was the 18th time Americans voted for their president. It happened on November 4, 1856. In this election, three main candidates ran. James Buchanan from the Democratic Party won. He beat John C. Frémont from the new Republican Party. He also defeated former President Millard Fillmore, who ran for the Know Nothing party.
This election was special because it was the only time a political party chose not to re-nominate the current president, but still won the election. The sitting Democratic President, Franklin Pierce, was not very popular. Many people in the North disliked his support for the pro-slavery side in the conflict known as Bleeding Kansas. This was a violent struggle happening in the Kansas area. Buchanan, who had been a Secretary of State, was away as the Ambassador to the United Kingdom. This meant he avoided the arguments about the Kansas–Nebraska Act, which made him a good choice for his party.
The biggest issue in this election was slavery. People wondered if the United States could survive with such deep divisions. The Democrats were generally seen as supporting slavery. The new Republican Party wanted to stop slavery from spreading into new federal territories. They also wanted to remove it from the District of Columbia. The Know Nothings, officially called the American Party, focused on stopping immigration and anti-Catholic policies. They hoped to replace the older Whig Party as the main opposition to the Democrats.
The Republicans chose John C. Frémont, an explorer and military officer. The Know Nothings chose former Whig President Millard Fillmore. Both Buchanan and Fillmore were appealing partly because they had been out of the country. This meant they hadn't taken sides on the difficult slavery issues.
The Democrats supported the idea of "popular sovereignty." This meant people in a territory could decide if slavery would be allowed before it became a state. But in Kansas, this idea led to a civil war. The Democrats blamed abolitionists like John Brown for the violence. Frémont and the Republicans were against the spread of slavery. Buchanan called this view "extremist." He warned that a Republican win could lead to the country breaking apart. The Know Nothings tried to present themselves as the only party that could unite the country. All three parties had some support in the North. However, the Republicans had almost no support in the South.
Buchanan won the most popular votes and a majority of the electoral votes. He won almost all the slave states and five free states. His lead in popular votes was the largest between 1836 and 1904. However, the election was closer than it looked. If a few thousand votes had changed in certain states, the election might have been decided by the House of Representatives.
Frémont won most of the electoral votes from free states. He came in second in the total popular vote. Fillmore won 21.5% of the popular vote and carried Maryland. The Know Nothing party soon fell apart. Many of its members who were against slavery joined the Republican Party. This happened after the important 1857 Dred Scott v. Sandford ruling by the Supreme Court. The 1856 election was also the last time the Democrats won the presidency until 1884. The Republicans became the main party during and after the Civil War.
Contents
Choosing the Candidates
The 1856 presidential election mainly involved three political parties. Other smaller parties were also active earlier in the year. Let's look at how the main parties chose their candidates.
Democratic Party Candidates
| 1856 Democratic Party ticket | |||||||||||||||||||||||||||||
| James Buchanan | John C. Breckinridge | ||||||||||||||||||||||||||||
|---|---|---|---|---|---|---|---|---|---|---|---|---|---|---|---|---|---|---|---|---|---|---|---|---|---|---|---|---|---|
| for President | for Vice President | ||||||||||||||||||||||||||||
 |
 |
||||||||||||||||||||||||||||
| Former U.S. Minister to Great Britain (1853–1856) |
Former U.S. Representative for Kentucky's 8th (1851–1855) |
||||||||||||||||||||||||||||
The Democratic Party had lost many elections in 1854–1855. Stephen A. Douglas, a U.S. Senator from Illinois, wanted to be president. He had supported the Kansas-Nebraska Act. President Franklin Pierce also wanted to be re-nominated. James Buchanan from Pennsylvania was another strong candidate.
The Democratic National Convention was held in Cincinnati, Ohio, from June 2 to 6, 1856. The delegates were very divided over the issue of slavery. Buchanan led in the early votes. Douglas gained support as voting continued. Eventually, Douglas withdrew from the race. He feared his continued presence would split the party. This was the first time a sitting president was not chosen to run again by his party.
For Vice President, many people were suggested. John C. Breckinridge of Kentucky was chosen on the second vote.
Republican Party Candidates
| 1856 Republican Party ticket | |||||||||||||||||||||||||||||
| John C. Frémont | William L. Dayton | ||||||||||||||||||||||||||||
|---|---|---|---|---|---|---|---|---|---|---|---|---|---|---|---|---|---|---|---|---|---|---|---|---|---|---|---|---|---|
| for President | for Vice President | ||||||||||||||||||||||||||||
 |
 |
||||||||||||||||||||||||||||
| Former U.S. Senator from California (1850–1851) |
Former U.S. Senator from New Jersey (1842–1851) |
||||||||||||||||||||||||||||
 |
|||||||||||||||||||||||||||||
The Republican Party started in 1854 to oppose the Kansas-Nebraska Act. This act allowed new territories to decide on slavery. The party quickly grew and won many seats in Congress. They also won three governorships in 1855.
The first Republican National Convention was held in Philadelphia, Pennsylvania, from June 17 to 19, 1856. The party's platform was against slavery. They wanted Congress to control slavery in the territories. They also wanted to end polygamy in Mormon areas. And they supported federal help for a transcontinental railroad.
Several people were considered for president, including John C. Frémont and John McLean. Some, like William Seward and Salmon Chase, chose not to run. They felt the party wasn't ready to win the White House yet. Charles Sumner was also considered, but he had been violently attacked in the Senate. Frémont was chosen as the presidential candidate. William L. Dayton was nominated for vice president.
American (Know-Nothing) Party Candidates
| 1856 American Party ticket | |||||||||||||||||||||||||||||
| Millard Fillmore | Andrew J. Donelson | ||||||||||||||||||||||||||||
|---|---|---|---|---|---|---|---|---|---|---|---|---|---|---|---|---|---|---|---|---|---|---|---|---|---|---|---|---|---|
| for President | for Vice President | ||||||||||||||||||||||||||||
 |
 |
||||||||||||||||||||||||||||
| 13th President of the United States (1850–1853) |
2nd U.S. Envoy to Prussia (1846–1849) |
||||||||||||||||||||||||||||
The American Party was also known as the Know Nothing movement. It took in many members of the old Whig Party. By 1855, it was the main party opposing the Democrats. They won many seats in the House of Representatives. They even helped elect Nathaniel P. Banks as Speaker of the House.
The American National Convention was held in Philadelphia from February 22 to 25, 1856. The party leaders decided not to focus on slavery. This caused some anti-slavery members from northern states to leave the convention. This weakened the party's support in the North.
Former President Millard Fillmore was the only candidate with much support. He was nominated with 179 votes. Andrew Jackson Donelson of Tennessee was chosen for vice president. Fillmore was not a true Know-Nothing or anti-immigrant. He was out of the country when he was nominated. He focused his campaign on keeping the country united.
Other Parties and Nominations
Some anti-slavery "Americans" from the North formed their own party. They were called the North American Party. They hoped to join forces with the Republicans. They nominated John C. Frémont for president. However, their vice presidential nominee, William F. Johnston, later withdrew.
A smaller group, called the North American Seceders, also formed. They nominated Robert F. Stockton for president. But their ticket later withdrew, and Stockton supported Millard Fillmore.
The Whig Party was almost gone by 1856. Most of its anti-slavery members had joined the Republicans. The last Whig National Convention was held in Baltimore, Maryland, in September 1856. The delegates decided to support the American Party's candidates, Fillmore and Donelson.
A very small group called the Liberty Party also ran a candidate, Gerrit Smith. Most of its members had joined other parties by then.
The Main Election Campaign

None of the three main candidates campaigned in public. The Republican Party was against slavery spreading into new territories. Their slogan was "Free speech, free press, free soil, free men, Frémont and victory!" They warned that "the Slave Power" (the influence of slave owners) was harming American values. Democrats warned that a Republican victory would lead to a civil war.
The Republicans opposed the Kansas–Nebraska Act. This act allowed settlers to decide if a new state would be free or slave. Republicans said the Pierce administration allowed a fake government in Kansas. This led to the violence in Bleeding Kansas. They wanted Kansas to become a free state right away. They also opposed the Ostend Manifesto, which wanted to take Cuba from Spain. Overall, their campaign was against slavery, which they felt was destroying the country's founding values.
The Democratic Party supported the Kansas-Nebraska Act and popular sovereignty. They supported the pro-slavery government in Kansas. They called the Topeka Constitution (written by free-state supporters) illegal. Democrats also supported the plan to annex Cuba. The most important part of their campaign was warning that a Republican win would cause southern states to leave the Union. They also made fun of Frémont's military past.
Fillmore and the Americans said they were the only "national party." They argued that the Democrats favored the South, and the Republicans favored the North and abolition.
A small scandal happened when the Americans spread a rumor that Frémont was Catholic. Many voters believed this because of his French-Canadian background. The Democrats used this rumor. Republicans found it hard to fight the rumor without losing support from German Catholics. The rumor continued throughout the campaign. It might have cost Frémont some votes from American Party members.
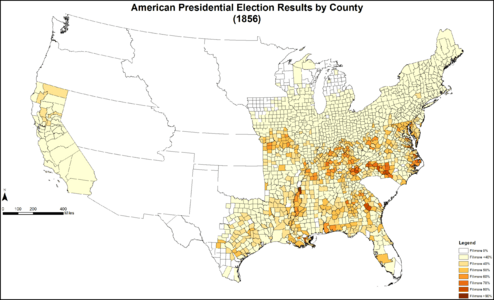
The campaign was different in the free states and the slave states. In the free states, Frémont won with 45.2% of the vote. Buchanan got 41.5%, and Fillmore got 13.3%. Frémont won 114 electoral votes in these states, while Buchanan got 62. In the slave states, it was mostly a fight between Buchanan and Fillmore. Buchanan won 56.1% of the vote, and Fillmore got 43.8%. Frémont got almost no votes in the slave states. Buchanan won 112 electoral votes there, and Fillmore got 8.
Overall, Buchanan won 174 electoral votes, which was a majority. So, he became president. Frémont received no votes in ten of the fourteen slave states.
This was the last presidential election where the Know Nothing Party ran a campaign. The party began to break apart. After the Dred Scott v. Sandford ruling in 1857, most anti-slavery members joined the Republicans. By the 1860 election, the Know Nothings were no longer a major national political force.
This election was also the last time the Democrats won Pennsylvania until 1936. It was the last time they won Illinois until 1892, and California until 1880. It was also the last time a Democrat was elected to follow another Democrat as president.
Election Results

| Presidential candidate | Party | Home state | Popular vote(a) | Electoral vote |
Running mate | |||
|---|---|---|---|---|---|---|---|---|
| Count | Percentage | Vice-presidential candidate | Home state | Electoral vote | ||||
| James Buchanan Jr. | Democratic | Pennsylvania | 1,836,072 | 45.28% | 174 | John Cabell Breckinridge | Kentucky | 174 |
| John Charles Frémont | Republican | California | 1,342,345 | 33.11% | 114 | William Lewis Dayton | New Jersey | 114 |
| Millard Fillmore | American | New York | 873,053 | 21.53% | 8 | Andrew Jackson Donelson | Tennessee | 8 |
| Other | 3,177 | 0.08% | — | Other | — | |||
| Total | 4,054,647 | 100% | 296 | 296 | ||||
| Needed to win | 149 | 149 | ||||||
Source (Popular Vote): Source (Electoral Vote):
(a) The popular vote figures exclude South Carolina where the Electors were chosen by the state legislature rather than by popular vote.
| Popular vote | ||||
|---|---|---|---|---|
| Buchanan | 45.28% | |||
| Frémont | 33.11% | |||
| Fillmore | 21.53% | |||
| Others | 0.08% | |||
| Electoral vote | ||||
|---|---|---|---|---|
| Buchanan | 58.78% | |||
| Frémont | 38.51% | |||
| Fillmore | 2.70% | |||
Where Did Each Candidate Win?
Map Gallery
-
Map of presidential election results by county
-
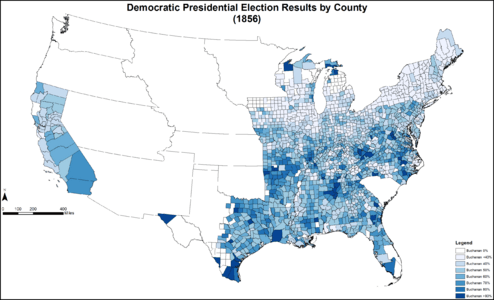
Map of Northern Democratic presidential election results by county
-
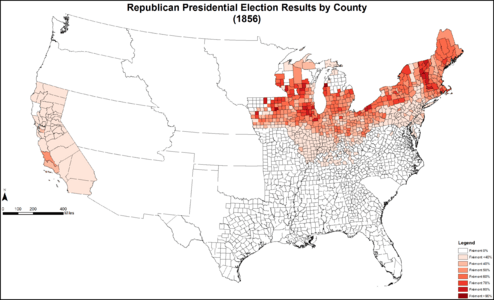
Map of Republican presidential election results by county
-
Map of American "Know-Nothing" presidential election results by county
-
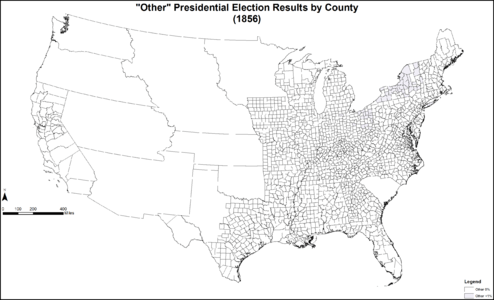
Map of "Other" presidential election results by county
-
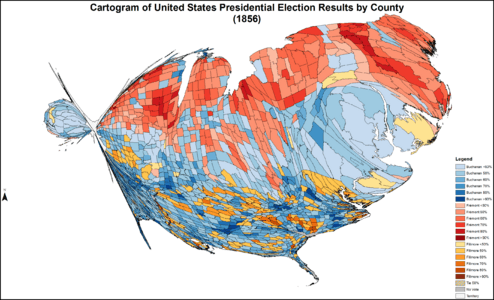
Cartogram of presidential election results by county


Results by State
Source: Data from Walter Dean Burnham, Presidential ballots, 1836–1892 (Johns Hopkins University Press, 1955) pp 247–57.
| States/districts won by Buchanan/Breckinridge |
| States/districts won by Frémont/Dayton |
| States/districts won by Fillmore/Donelson |
| James Buchanan Democratic |
John C. Fremont Republican |
Millard Fillmore American |
Margin | State Total | ||||||||||||||
|---|---|---|---|---|---|---|---|---|---|---|---|---|---|---|---|---|---|---|
| State | electoral votes |
# | % | electoral votes |
# | % | electoral votes |
# | % | electoral votes |
# | % | # | |||||
| Alabama | 9 | 46,739 | 62.08 | 9 | no ballots | 28,552 | 37.92 | – | 18,187 | 24.16 | 75,291 | AL | ||||||
| Arkansas | 4 | 21,910 | 67.12 | 4 | no ballots | 10,732 | 32.88 | – | 11,178 | 34.24 | 32,642 | AR | ||||||
| California | 4 | 53,342 | 48.38 | 4 | 20,704 | 18.78 | – | 36,195 | 32.83 | – | 17,147 | 15.55 | 110,255 | CA | ||||
| Connecticut | 6 | 34,997 | 43.57 | – | 42,717 | 53.18 | 6 | 2,615 | 3.26 | – | −7,720 | −9.61 | 80,329 | CT | ||||
| Delaware | 3 | 8,004 | 54.83 | 3 | 310 | 2.12 | – | 6,275 | 42.99 | – | 1,729 | 11.84 | 14,589 | DE | ||||
| Florida | 3 | 6,358 | 56.81 | 3 | no ballots | 4,833 | 43.19 | – | 1,525 | 13.62 | 11,191 | FL | ||||||
| Georgia | 10 | 56,581 | 57.14 | 10 | no ballots | 42,439 | 42.86 | – | 14,142 | 14.28 | 99,020 | GA | ||||||
| Illinois | 11 | 105,528 | 44.09 | 11 | 96,275 | 40.23 | – | 37,531 | 15.68 | – | 9,253 | 3.86 | 239,334 | IL | ||||
| Indiana | 13 | 118,670 | 50.41 | 13 | 94,375 | 40.09 | – | 22,386 | 9.51 | – | 24,295 | 10.32 | 235,431 | IN | ||||
| Iowa | 4 | 37,568 | 40.70 | – | 45,073 | 48.83 | 4 | 9,669 | 10.47 | – | −7,505 | −8.13 | 92,310 | IA | ||||
| Kentucky | 12 | 74,642 | 52.54 | 12 | no ballots | 67,416 | 47.46 | – | 7,226 | 5.08 | 142,058 | KY | ||||||
| Louisiana | 6 | 22,164 | 51.70 | 6 | no ballots | 20,709 | 48.30 | – | 1,455 | 3.40 | 42,873 | LA | ||||||
| Maine | 8 | 39,140 | 35.68 | – | 67,279 | 61.34 | 8 | 3,270 | 2.98 | – | −28,139 | −25.66 | 109,689 | ME | ||||
| Maryland | 8 | 39,123 | 45.04 | – | 285 | 0.33 | – | 47,452 | 54.63 | 8 | −8,329 | −9.59 | 86,860 | MD | ||||
| Massachusetts | 13 | 39,244 | 23.08 | – | 108,172 | 63.61 | 13 | 19,626 | 11.54 | – | −68,928 | −40.53 | 170,048 | MA | ||||
| Michigan | 6 | 52,139 | 41.52 | – | 71,762 | 57.15 | 6 | 1,660 | 1.32 | – | −19,623 | −15.63 | 125,561 | MI | ||||
| Mississippi | 7 | 35,456 | 59.44 | 7 | no ballots | 24,191 | 40.56 | – | 11,265 | 18.88 | 59,647 | MS | ||||||
| Missouri | 9 | 57,964 | 54.43 | 9 | no ballots | 48,522 | 45.57 | – | 9,442 | 8.86 | 106,486 | MO | ||||||
| New Hampshire | 5 | 31,891 | 45.71 | – | 37,473 | 53.71 | 5 | 410 | 0.59 | – | −5,582 | −8.00 | 69,774 | NH | ||||
| New Jersey | 7 | 46,943 | 47.23 | 7 | 28,338 | 28.51 | – | 24,115 | 24.26 | – | 22,828 | 18.72 | 99,396 | NJ | ||||
| New York | 35 | 195,878 | 32.84 | – | 276,004 | 46.27 | 35 | 124,604 | 20.89 | – | −80,126 | −13.43 | 596,486 | NY | ||||
| North Carolina | 10 | 48,243 | 56.78 | 10 | no ballots | 36,720 | 43.22 | – | 11,523 | 13.56 | 84,963 | NC | ||||||
| Ohio | 23 | 170,874 | 44.21 | – | 187,497 | 48.51 | 23 | 28,126 | 7.28 | – | −16,623 | −4.30 | 386,497 | OH | ||||
| Pennsylvania | 27 | 230,686 | 50.13 | 27 | 147,286 | 32.01 | – | 82,189 | 17.86 | – | 83,400 | 18.12 | 460,161 | PA | ||||
| Rhode Island | 4 | 6,680 | 33.70 | – | 11,467 | 57.85 | 4 | 1,675 | 8.45 | – | −4,787 | −24.15 | 19,822 | RI | ||||
| South Carolina | 8 | no popular vote | 8 | no popular vote | no popular vote | – | – | – | SC | |||||||||
| Tennessee | 12 | 69,704 | 52.18 | 12 | no ballots | 63,878 | 47.82 | – | 5,826 | 4.36 | 133,582 | TN | ||||||
| Texas | 4 | 31,169 | 66.59 | 4 | no ballots | 15,639 | 33.41 | – | 15,530 | 33.18 | 46,808 | TX | ||||||
| Vermont | 5 | 10,577 | 20.84 | – | 39,561 | 77.96 | 5 | 545 | 1.07 | – | −28,984 | −57.12 | 50,748 | VT | ||||
| Virginia | 15 | 90,083 | 59.96 | 15 | no ballots | 60,150 | 40.04 | – | 29,933 | 19.92 | 150,223 | VA | ||||||
| Wisconsin | 5 | 52,843 | 44.22 | – | 66,090 | 55.30 | 5 | 579 | 0.48 | – | −13,247 | −11.08 | 119,512 | WI | ||||
| TOTALS: | 296 | 1,835,140 | 45.29 | 174 | 1,340,668 | 33.09 | 114 | 872,703 | 21.54 | 8 | 494,472 | 12.2 | 4,051,605 | US | ||||
| TO WIN: | 149 | |||||||||||||||||
States with Close Results
States where the winner won by less than 5% of the votes:
- Louisiana 3.40% (1,455 votes)
- Illinois 3.86% (9,253 votes)
- Ohio 4.30% (16,623 votes)
- Tennessee 4.36% (5,826 votes)
States where the winner won by less than 10% of the votes:
- Kentucky 5.08% (7,226 votes)
- New Hampshire 8.00% (5,582 votes)
- Iowa 8.13% (7,505 votes)
- Missouri 8.86% (9,442 votes)
- Maryland 9.59% (8,329 votes)
- Connecticut 9.61% (7,720 votes)
Counting Electoral Votes
On February 11, 1857, during a special meeting of Congress to count the electoral votes, a small issue came up. The electors from Wisconsin were late in casting their votes for Frémont and Dayton. This was because of a snowstorm. When the votes were opened, the acting Vice President, James Murray Mason, counted them. He did this even though some leaders in Congress disagreed.
Images for kids
-
President Franklin Pierce
(Name Withdrawn on the 15th Ballot in favor of Stephen Douglas) -
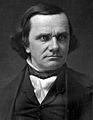
Senator Stephen A. Douglas from Illinois
(Name Withdrawn on the 17th Ballot in favor of James Buchanan) -
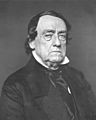
Senator Lewis Cass from Michigan -
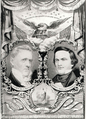
Buchanan/Breckinridge campaign poster
-
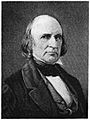
Supreme Court Associate Justice John McLean -
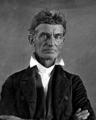
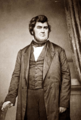
abolitionist John Brown from New York
(Declined to Run) -
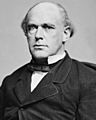
Governor Salmon P. Chase of Ohio
(Declined to Run) -
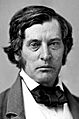
Senator Charles Sumner from Massachusetts
(Declined to Run) -
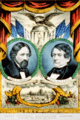
Fremont/Dayton campaign poster
-
Steamboat entrepreneur George Law from New York
-
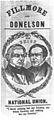
1856 Know-Nothing campaign poster
-
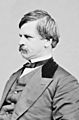
Speaker Nathaniel P. Banks
(Declined Nomination) -
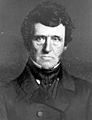
Former Senator Robert F. Stockton -
Governor William F. Johnston of Pennsylvania -
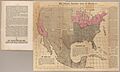
An anti-slavery map printed during the Presidential election campaign of 1856 by the John C. Fremont Campaign.


.jpg)


See also
 In Spanish: Elecciones presidenciales de Estados Unidos de 1856 para niños
