
2010–11 NHL season facts for kids
Quick facts for kids 2010–11 NHL season |
|
|---|---|
| League | National Hockey League |
| Sport | Ice hockey |
| Duration | October 7, 2010 – June 15, 2011 |
| Regular season | |
| Presidents' Trophy | Vancouver Canucks |
| Season MVP | Corey Perry (Anaheim) |
| Top scorer | Daniel Sedin (Vancouver) |
| Playoffs | |
| Eastern champions | Boston Bruins |
| Eastern runners-up | Tampa Bay Lightning |
| Western champions | Vancouver Canucks |
| Western runners-up | San Jose Sharks |
| Playoffs MVP | Tim Thomas (Boston) |
| Stanley Cup | |
| Stanley Cup champions | Boston Bruins |
| Runners-up | Vancouver Canucks |
| NHL seasons | |
|
← 2009–10 |
2011–12 → |
The 2010–11 NHL season was an exciting year for the National Hockey League (NHL). It was the 94th season for the league. Teams played many games from October 2010 to June 2011. This season ended with a big championship game.
Contents
About the Season
The 2010–11 NHL season started with some special games. A few NHL teams traveled to Europe. They played exhibition games against European teams. This was a fun way to begin the hockey year.
Regular Season Highlights
The regular season ran from October 2010 to April 2011. All 30 NHL teams played 82 games. Teams worked hard to earn enough points. This helped them get a spot in the playoffs.
The Vancouver Canucks were the best team overall. They won the Presidents' Trophy. This award goes to the team with the most points. Winning it also gave them home-ice advantage. This means they played more games at home during the playoffs. The Washington Capitals were the top team in the Eastern Conference.
The Playoffs

The 2011 playoffs began on April 13, 2011. This is when the top teams battled for the Stanley Cup. The playoffs ended on June 15, 2011.
How the Playoffs Work
In the playoffs, teams play a series of games. Each series is "best-of-seven." This means a team must win four games to move on. The team that wins the regular season usually gets to play more games at home. This is called home-ice advantage. The playoffs have four rounds. Teams play within their conference first. Then, the best team from the Eastern Conference plays the best team from the Western Conference. This final series is for the Stanley Cup.
| Conference Quarterfinals | Conference Semifinals | Conference Finals | Stanley Cup Final | |||||||||||||||
| 1 | Washington Capitals | 4 | ||||||||||||||||
| 8 | New York Rangers | 1 | ||||||||||||||||
| 1 | Washington Capitals | 0 | ||||||||||||||||
| 5 | Tampa Bay Lightning | 4 | ||||||||||||||||
| 2 | Philadelphia Flyers | 4 | ||||||||||||||||
| 7 | Buffalo Sabres | 3 | ||||||||||||||||
| 5 | Tampa Bay Lightning | 3 | ||||||||||||||||
| Eastern Conference | ||||||||||||||||||
| 3 | Boston Bruins | 4 | ||||||||||||||||
| 3 | Boston Bruins | 4 | ||||||||||||||||
| 6 | Montreal Canadiens | 3 | ||||||||||||||||
| 2 | Philadelphia Flyers | 0 | ||||||||||||||||
| 3 | Boston Bruins | 4 | ||||||||||||||||
| 4 | Pittsburgh Penguins | 3 | ||||||||||||||||
| 5 | Tampa Bay Lightning | 4 | ||||||||||||||||
| E3 | Boston Bruins | 4 | ||||||||||||||||
| W1 | Vancouver Canucks | 3 | ||||||||||||||||
| 1 | Vancouver Canucks | 4 | ||||||||||||||||
| 8 | Chicago Blackhawks | 3 | ||||||||||||||||
| 1 | Vancouver Canucks | 4 | ||||||||||||||||
| 5 | Nashville Predators | 2 | ||||||||||||||||
| 2 | San Jose Sharks | 4 | ||||||||||||||||
| 7 | Los Angeles Kings | 2 | ||||||||||||||||
| 1 | Vancouver Canucks | 4 | ||||||||||||||||
| Western Conference | ||||||||||||||||||
| 2 | San Jose Sharks | 1 | ||||||||||||||||
| 3 | Detroit Red Wings | 4 | ||||||||||||||||
| 6 | Phoenix Coyotes | 0 | ||||||||||||||||
| 2 | San Jose Sharks | 4 | ||||||||||||||||
| 3 | Detroit Red Wings | 3 | ||||||||||||||||
| 4 | Anaheim Ducks | 2 | ||||||||||||||||
| 5 | Nashville Predators | 4 | ||||||||||||||||
Stanley Cup Final
The 2011 Stanley Cup Final was played between the Boston Bruins and the Vancouver Canucks. It was a very close series. The Bruins won the Stanley Cup in Game 7. This was their first championship since 1972. Tim Thomas of the Bruins won the Conn Smythe Trophy. This award goes to the most valuable player in the playoffs.
NHL Awards
Many players and teams received awards for their great performance during the season:
Top Players
Many players had amazing seasons. Here are some of the top scorers and goaltenders.
Scoring Leaders
These players earned the most points during the regular season. Points are given for goals and assists.
GP = Games played; G = Goals; A = Assists; Pts = Points; +/– = Plus/minus rating; PIM = Penalty minutes
| Player | Team | GP | G | A | Pts | +/– | PIM |
|---|---|---|---|---|---|---|---|
| Daniel Sedin | Vancouver Canucks | 82 | 41 | 63 | 104 | +29 | 32 |
| Martin St. Louis | Tampa Bay Lightning | 82 | 31 | 68 | 99 | 0 | 12 |
| Corey Perry | Anaheim Ducks | 82 | 50 | 48 | 98 | +9 | 104 |
| Henrik Sedin | Vancouver Canucks | 82 | 19 | 75 | 94 | +26 | 40 |
| Steven Stamkos | Tampa Bay Lightning | 82 | 45 | 46 | 91 | +3 | 74 |
| Jarome Iginla | Calgary Flames | 82 | 43 | 43 | 86 | 0 | 40 |
| Alexander Ovechkin | Washington Capitals | 79 | 32 | 53 | 85 | +24 | 41 |
| Teemu Selanne | Anaheim Ducks | 73 | 31 | 49 | 80 | +6 | 49 |
| Henrik Zetterberg | Detroit Red Wings | 80 | 24 | 56 | 80 | –1 | 40 |
| Brad Richards | Dallas Stars | 72 | 28 | 49 | 77 | +1 | 24 |
Leading Goaltenders
These goalies had the best goals against average (GAA). This means they let in the fewest goals per game.
GP = Games played; Min = Minutes played; W = Wins; L = Losses; OT = Overtime/shootout losses; GA = Goals against; SO = Shutouts; SV% = Save percentage; GAA = Goals against average
| Player | Team | GP | Min | W | L | OT | GA | SO | SV% | GAA |
|---|---|---|---|---|---|---|---|---|---|---|
| Tim Thomas | Boston Bruins | 57 | 3,363:58 | 35 | 11 | 9 | 112 | 9 | .938 | 2.00 |
| Roberto Luongo | Vancouver Canucks | 60 | 3,589:39 | 38 | 15 | 7 | 126 | 4 | .928 | 2.11 |
| Pekka Rinne | Nashville Predators | 64 | 3,789:15 | 33 | 22 | 9 | 134 | 6 | .930 | 2.12 |
| Jonathan Quick | Los Angeles Kings | 61 | 3,590:34 | 35 | 22 | 3 | 134 | 6 | .918 | 2.24 |
| Henrik Lundqvist | New York Rangers | 68 | 4,006:40 | 36 | 27 | 5 | 152 | 11 | .923 | 2.28 |
| Corey Crawford | Chicago Blackhawks | 57 | 3,336:37 | 33 | 18 | 6 | 128 | 4 | .917 | 2.30 |
| Marc-Andre Fleury | Pittsburgh Penguins | 65 | 3,695:10 | 36 | 20 | 5 | 143 | 3 | .918 | 2.32 |
| Carey Price | Montreal Canadiens | 72 | 4,206:08 | 38 | 28 | 6 | 165 | 8 | .923 | 2.35 |
| Antti Niemi | San Jose Sharks | 60 | 3,523:54 | 35 | 18 | 6 | 140 | 6 | .920 | 2.38 |
| Brian Boucher | Philadelphia Flyers | 34 | 1,884:34 | 18 | 10 | 4 | 76 | 0 | .916 | 2.42 |
Images for kids
-
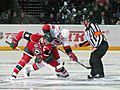
The first face off of the season, Hurricanes at Wild in Helsinki, Finland.

See also
 In Spanish: Temporada 2010-11 de la NHL para niños
