Climate of Oregon facts for kids
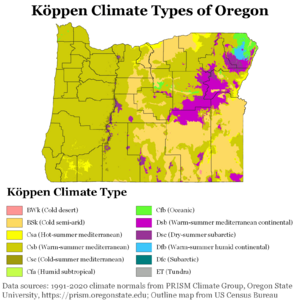
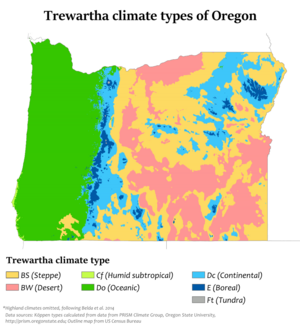
Oregon has many different types of weather! In Western Oregon, near the coast, it's often like a warm-summer Mediterranean climate. This means summers are warm and dry. Winters are wet, cloudy, and often overcast. But if you go to Eastern Oregon, it's much drier. This area has a cold semi-arid climate, which means it's like a dry grassland.
West of the Cascade Range, winters are cool with lots of rain. Sometimes it snows, but not often. Very cold temperatures can happen, but they are rare. This is usually due to cold air coming from the Arctic. The high desert in Eastern Oregon is much drier. It gets less rain but more snow. Winters there are colder, and summers are hotter.
Contents
Oregon's Rainy and Dry Weather
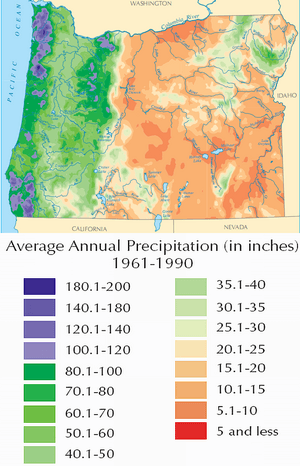
The amount of rain and snow in Oregon changes a lot. Some places on the western coast get a huge amount of rain, up to 200 inches (5,080 mm) each year! But the driest spots, like the Alvord Desert in eastern Oregon, get as little as 5 inches (127 mm). This desert is in a "rain shadow" behind Steens Mountain.
The Pacific Ocean is a big reason for Oregon's weather. Air filled with moisture from the ocean moves east. When this moist air hits the Oregon Coast Range, it has to rise. As it goes up, it cools down and drops its moisture as heavy rain. The most rain falls in these coastal mountains, usually between 2,000 to 4,000 feet (610 to 1,219 m) high. Lower areas along the coast still get a lot of rain, about 60 to 80 inches (1,524 to 2,032 mm) each year.
East of the Coast Range is the Willamette Valley. Storms from the Pacific still bring enough moisture here. This area, where most people live, gets about 35 to 45 inches (889 to 1,143 mm) of rain yearly. Further east, the air rises again as it reaches the Cascade Range. It cools and drops more rain or snow. High peaks like Mount Hood, over 11,000 feet (3,353 m) tall, catch most of the remaining moisture.
The eastern two-thirds of Oregon is quite dry. It's called "semi-arid," meaning it's partly dry. Many areas get no more than 12 inches (305 mm) of rain a year. However, higher places like the Blue Mountains and Wallowa Mountains get more. They can receive 50 to 80 inches (1,270 to 2,032 mm) of rain or snow each year.
Oregon's wet season is from November to March. This is when the jet stream is strongest. Less rain falls in spring (April to June) and fall (September and October). July and August are the driest months. During these months, rain mostly comes from afternoon thunderstorms in the mountains. Sometimes, storms reach the north coast too.
Snow in Oregon
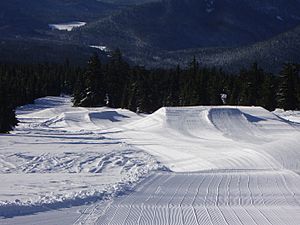
The most snow in Oregon falls in the Cascade Range. Ski resorts and weather stations show that the Cascades can get 300 to 550 inches (762 to 1,397 cm) of snow each year. The most snow ever recorded in Oregon was 903 inches (2,294 cm). This happened at Crater Lake in the Cascades in 1950. The Blue Mountains in eastern Oregon also get a lot of snow, between 150 and 300 inches (381 and 762 cm). The Coast Range mostly gets rain, but heavy snow can happen there too.
In most mountain areas above 4,500 feet (1,372 m), snow covers the ground from December to April. Snow depths change with how high up you are and the time of year. In the Cascades, snow is usually 50 to 100 inches (127 to 254 cm) deep by late January. In the Blue Mountains, it's about 25 to 65 inches (64 to 165 cm) deep. By late April, the snow gets thinner. Some Glaciers stay all year on Cascade peaks higher than 7,000 feet (2,134 m).
Along the coast, only about 1 to 3 inches (3 to 8 cm) of snow falls each year, and some years have none. Inland, between the Coast Range and the Cascades, snow usually averages 5 to 10 inches (13 to 25 cm) a year. East of the Cascades, outside the mountains, annual snow totals are 15 to 75 inches (38 to 191 cm). This depends on the location. The least snow is in the north-central region and the Snake River basin. The most is in the northeastern valleys and southern high plateaus.
Oregon's Temperatures
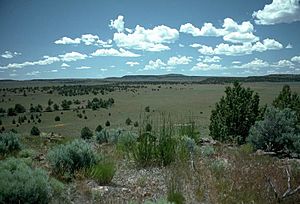
Oregon's temperatures change with the seasons. They are also affected by the Pacific Ocean and how high up a place is. The Cascade Range also plays a big role. Generally, temperatures drop about 4°F (2°C) for every 1,000 feet (305 m) you go up. So, higher places are usually cooler. The Cascades run north to south. They tend to keep warm Pacific air on the western side. They also keep cooler air from the continent on the eastern side. Sometimes, very cold air flows down the Columbia Gorge. This can make temperatures much colder than usual in the Willamette Valley, from Portland to Eugene.
Oregon has a wide range of temperatures, but extreme hot or cold days are rare. The hottest temperature ever recorded was 119°F (48°C). This happened on July 29, 1898, in Hermiston, Oregon. It happened again on August 10, 1898, in Pendleton, Oregon and Redmond, Oregon. And most recently, on June 29, 2021, at Pelton Dam. All these places are east of the Cascades. The coldest temperature was -54°F (-48°C). This happened on February 9, 1933, in Ukiah, and on February 10, 1933, in Seneca. These places are also east of the Cascades.
In the Willamette Valley, temperatures are milder. High temperatures of 90°F (32°C) or more happen only 5 to 15 times a year. Low temperatures below 30°F (-1°C) are also not very common. The warmest part of the state in summer is the southwest. Jackson County is the hottest place during summer.
| Climate data for Oregon | |||||||||||||
|---|---|---|---|---|---|---|---|---|---|---|---|---|---|
| Month | Jan | Feb | Mar | Apr | May | Jun | Jul | Aug | Sep | Oct | Nov | Dec | Year |
| Record high °F (°C) | 82 (28) |
89 (32) |
99 (37) |
102 (39) |
108 (42) |
119 (48) |
119 (48) |
119 (48) |
111 (44) |
104 (40) |
89 (32) |
81 (27) |
119 (48) |
| Record low °F (°C) | −52 (−47) |
−54 (−48) |
−30 (−34) |
−23 (−31) |
0 (−18) |
11 (−12) |
14 (−10) |
13 (−11) |
2 (−17) |
−9 (−23) |
−32 (−36) |
−53 (−47) |
−54 (−48) |
| Source: https://www.factmonster.com/math-science/weather/oregon-temperature-extremes | |||||||||||||
Climate Charts for Oregon Cities
| Weather chart for Astoria | |||||||||||||||||||||||||||||||||||||||||||||||
|---|---|---|---|---|---|---|---|---|---|---|---|---|---|---|---|---|---|---|---|---|---|---|---|---|---|---|---|---|---|---|---|---|---|---|---|---|---|---|---|---|---|---|---|---|---|---|---|
| J | F | M | A | M | J | J | A | S | O | N | D | ||||||||||||||||||||||||||||||||||||
|
10
50
38
|
7.2
52
37
|
7.5
54
39
|
5.2
56
41
|
3.3
60
46
|
2.6
64
50
|
1
67
53
|
1.2
69
53
|
2.1
68
49
|
6
61
44
|
11
54
40
|
9.9
49
37
|
||||||||||||||||||||||||||||||||||||
| temperatures in °F precipitation totals in inches |
|||||||||||||||||||||||||||||||||||||||||||||||
|
Metric conversion
|
|||||||||||||||||||||||||||||||||||||||||||||||
| Weather chart for Bend | |||||||||||||||||||||||||||||||||||||||||||||||
|---|---|---|---|---|---|---|---|---|---|---|---|---|---|---|---|---|---|---|---|---|---|---|---|---|---|---|---|---|---|---|---|---|---|---|---|---|---|---|---|---|---|---|---|---|---|---|---|
| J | F | M | A | M | J | J | A | S | O | N | D | ||||||||||||||||||||||||||||||||||||
|
1.5
41
24
|
1.1
44
24
|
0.7
51
28
|
0.7
57
30
|
0.9
65
36
|
0.8
72
42
|
0.6
82
48
|
0.5
81
46
|
0.4
74
40
|
0.6
62
33
|
1.4
47
28
|
2.1
39
23
|
||||||||||||||||||||||||||||||||||||
| temperatures in °F precipitation totals in inches |
|||||||||||||||||||||||||||||||||||||||||||||||
|
Metric conversion
|
|||||||||||||||||||||||||||||||||||||||||||||||
| Weather chart for Brookings | |||||||||||||||||||||||||||||||||||||||||||||||
|---|---|---|---|---|---|---|---|---|---|---|---|---|---|---|---|---|---|---|---|---|---|---|---|---|---|---|---|---|---|---|---|---|---|---|---|---|---|---|---|---|---|---|---|---|---|---|---|
| J | F | M | A | M | J | J | A | S | O | N | D | ||||||||||||||||||||||||||||||||||||
|
12
55
42
|
10
56
43
|
9.4
58
43
|
6.5
60
44
|
3.9
63
47
|
2
67
50
|
0.4
68
52
|
0.7
68
53
|
1.4
64
51
|
5.4
64
48
|
11
58
45
|
15
55
42
|
||||||||||||||||||||||||||||||||||||
| temperatures in °F precipitation totals in inches |
|||||||||||||||||||||||||||||||||||||||||||||||
|
Metric conversion
|
|||||||||||||||||||||||||||||||||||||||||||||||
| Weather chart for Burns | |||||||||||||||||||||||||||||||||||||||||||||||
|---|---|---|---|---|---|---|---|---|---|---|---|---|---|---|---|---|---|---|---|---|---|---|---|---|---|---|---|---|---|---|---|---|---|---|---|---|---|---|---|---|---|---|---|---|---|---|---|
| J | F | M | A | M | J | J | A | S | O | N | D | ||||||||||||||||||||||||||||||||||||
|
1.2
35
15
|
1
39
18
|
1.1
49
25
|
0.9
57
29
|
1.2
66
36
|
0.8
75
42
|
0.4
86
47
|
0.4
85
45
|
0.4
76
36
|
0.8
62
28
|
1.2
45
22
|
1.6
34
14
|
||||||||||||||||||||||||||||||||||||
| temperatures in °F precipitation totals in inches |
|||||||||||||||||||||||||||||||||||||||||||||||
|
Metric conversion
|
|||||||||||||||||||||||||||||||||||||||||||||||
| Weather chart for Eugene | |||||||||||||||||||||||||||||||||||||||||||||||
|---|---|---|---|---|---|---|---|---|---|---|---|---|---|---|---|---|---|---|---|---|---|---|---|---|---|---|---|---|---|---|---|---|---|---|---|---|---|---|---|---|---|---|---|---|---|---|---|
| J | F | M | A | M | J | J | A | S | O | N | D | ||||||||||||||||||||||||||||||||||||
|
6.9
47
35
|
5.4
51
35
|
5
56
37
|
3.3
61
40
|
2.7
67
44
|
1.5
73
48
|
0.6
82
52
|
0.6
83
51
|
1.3
77
47
|
3.3
64
42
|
7.7
52
38
|
7.8
46
34
|
||||||||||||||||||||||||||||||||||||
| temperatures in °F precipitation totals in inches |
|||||||||||||||||||||||||||||||||||||||||||||||
|
Metric conversion
|
|||||||||||||||||||||||||||||||||||||||||||||||
| Weather chart for Medford | |||||||||||||||||||||||||||||||||||||||||||||||
|---|---|---|---|---|---|---|---|---|---|---|---|---|---|---|---|---|---|---|---|---|---|---|---|---|---|---|---|---|---|---|---|---|---|---|---|---|---|---|---|---|---|---|---|---|---|---|---|
| J | F | M | A | M | J | J | A | S | O | N | D | ||||||||||||||||||||||||||||||||||||
|
2.4
48
32
|
2
54
34
|
1.7
59
36
|
1.4
65
40
|
1.3
73
45
|
0.6
82
51
|
0.3
92
57
|
0.4
91
56
|
0.6
84
49
|
1.1
70
42
|
3
53
36
|
3.5
46
30
|
||||||||||||||||||||||||||||||||||||
| temperatures in °F precipitation totals in inches |
|||||||||||||||||||||||||||||||||||||||||||||||
|
Metric conversion
|
|||||||||||||||||||||||||||||||||||||||||||||||
| Weather chart for Newport | |||||||||||||||||||||||||||||||||||||||||||||||
|---|---|---|---|---|---|---|---|---|---|---|---|---|---|---|---|---|---|---|---|---|---|---|---|---|---|---|---|---|---|---|---|---|---|---|---|---|---|---|---|---|---|---|---|---|---|---|---|
| J | F | M | A | M | J | J | A | S | O | N | D | ||||||||||||||||||||||||||||||||||||
|
11
50
38
|
8.1
52
39
|
8.2
54
40
|
4.9
56
41
|
3.5
59
45
|
2.7
62
49
|
1
64
50
|
1.3
65
51
|
2.6
65
49
|
5.4
61
46
|
11
55
42
|
12
51
39
|
||||||||||||||||||||||||||||||||||||
| temperatures in °F precipitation totals in inches |
|||||||||||||||||||||||||||||||||||||||||||||||
|
Metric conversion
|
|||||||||||||||||||||||||||||||||||||||||||||||
| Weather chart for Ontario | |||||||||||||||||||||||||||||||||||||||||||||||
|---|---|---|---|---|---|---|---|---|---|---|---|---|---|---|---|---|---|---|---|---|---|---|---|---|---|---|---|---|---|---|---|---|---|---|---|---|---|---|---|---|---|---|---|---|---|---|---|
| J | F | M | A | M | J | J | A | S | O | N | D | ||||||||||||||||||||||||||||||||||||
|
1.3
34
18
|
0.9
43
24
|
1
55
31
|
0.7
65
37
|
0.9
74
45
|
0.6
84
51
|
0.3
93
57
|
0.3
91
54
|
0.5
81
45
|
0.6
66
34
|
1.2
47
27
|
1.4
36
20
|
||||||||||||||||||||||||||||||||||||
| temperatures in °F precipitation totals in inches |
|||||||||||||||||||||||||||||||||||||||||||||||
|
Metric conversion
|
|||||||||||||||||||||||||||||||||||||||||||||||
| Weather chart for Pendleton | |||||||||||||||||||||||||||||||||||||||||||||||
|---|---|---|---|---|---|---|---|---|---|---|---|---|---|---|---|---|---|---|---|---|---|---|---|---|---|---|---|---|---|---|---|---|---|---|---|---|---|---|---|---|---|---|---|---|---|---|---|
| J | F | M | A | M | J | J | A | S | O | N | D | ||||||||||||||||||||||||||||||||||||
|
1.4
42
29
|
1.1
47
30
|
1.3
55
35
|
1.2
62
39
|
1.3
70
46
|
1
78
52
|
0.3
88
57
|
0.4
87
57
|
0.6
77
49
|
1
64
40
|
1.5
49
33
|
1.5
40
27
|
||||||||||||||||||||||||||||||||||||
| temperatures in °F precipitation totals in inches |
|||||||||||||||||||||||||||||||||||||||||||||||
|
Metric conversion
|
|||||||||||||||||||||||||||||||||||||||||||||||
| Weather chart for Portland | |||||||||||||||||||||||||||||||||||||||||||||||
|---|---|---|---|---|---|---|---|---|---|---|---|---|---|---|---|---|---|---|---|---|---|---|---|---|---|---|---|---|---|---|---|---|---|---|---|---|---|---|---|---|---|---|---|---|---|---|---|
| J | F | M | A | M | J | J | A | S | O | N | D | ||||||||||||||||||||||||||||||||||||
|
4.9
47
36
|
3.7
51
36
|
3.7
57
40
|
2.7
61
43
|
2.5
68
49
|
1.7
74
54
|
0.7
81
58
|
0.7
81
58
|
1.5
76
53
|
3
64
46
|
5.6
53
41
|
5.5
46
35
|
||||||||||||||||||||||||||||||||||||
| temperatures in °F precipitation totals in inches |
|||||||||||||||||||||||||||||||||||||||||||||||
|
Metric conversion
|
|||||||||||||||||||||||||||||||||||||||||||||||
 | Leon Lynch |
 | Milton P. Webster |
 | Ferdinand Smith |


