
List of countries by GDP (nominal) facts for kids
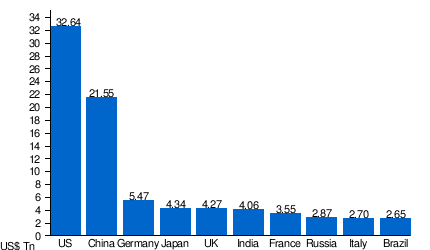 |
| Largest economies in the world by nominal GDP in 2026 according to International Monetary Fund projections |

Gross domestic product (GDP) is the total market value of all finished goods and services made inside a nation during a year. When economists want to see which country has the biggest economy, they often rank them by nominal GDP. Nominal means the values are counted using official money exchange rates compared to the United States dollar.
Nominal GDP gives a quick look at global financial strength. However, it does not measure the local cost of living in each country. Because values depend on paper currency, a nation's ranking can change quickly if exchange rates go up or down. Even if a spot changes, the daily life of citizens may stay the same.
Contents
Understanding Gross Domestic Product and World Wealth
To understand how wealth works across our planet, economists use different tools. Nominal GDP acts like a giant receipt for a whole nation. It counts cars built, haircuts given, crops harvested, and software designed. Big groups like the International Monetary Fund, the World Bank, and the United Nations Statistics Division gather this huge amount of information every year.
How Experts Compare Different Economies
Comparing countries can be tricky because prices vary around the world. A loaf of bread might cost far more in one place than in another. To solve this problem, experts often use purchasing power parity (PPP). This measurement adjusts numbers based on what money can actually buy in local shops.
When researchers want to know how wealthy an average person might be, they divide the total money by the population. This number is called nominal GDP per capita. Another helpful score is the GDP (PPP) per capita. These numbers help us understand the local standard of living and daily comfort of families.
How Global Economic Leaders Change Over Time
Economic power does not stay in one place forever. History shows many changes over the centuries. For example, the United States grew quickly and passed the British Empire as the leading economic powerhouse around 1916. After World War II, Japan rebuilt its industries and became the second-largest economy by the 1970s.
China also changed its rules for trade and business starting in 1978. Because of these changes, China jumped from ninth place to second place by 2010. Today, large nations like India, Germany, and the United Kingdom continue to build more factories, schools, and technology to help their economies expand.
Top National Economies in the World
International lists include independent sovereign states, as well as non-sovereign nations and several dependent territories. Even regions with special political status, such as Taiwan and Kosovo, appear in official global reports. The table below highlights many of the leading economies using estimates from the International Monetary Fund, the World Bank, and the United Nations.
| Country or Territory | IMF (2026) | World Bank (2025) | United Nations (2024) |
|---|---|---|---|
 United States |
32,642,373 | 30,769,700 | 29,298,000 |
 China |
21,546,403 | 19,498,039 | 18,743,802 |
 Germany |
5,471,299 | 5,050,923 | 4,659,929 |
 Japan |
4,341,986 | 4,435,163 | 4,026,211 |
 United Kingdom |
4,268,446 | 4,002,588 | 3,685,881 |
 India |
4,060,207 | 3,956,067 | 3,952,244 |
 France |
3,554,155 | 3,366,316 | 3,160,443 |
 Russia |
2,861,156 | 2,561,310 | 2,173,386 |
 Italy |
2,701,737 | 2,551,557 | 2,380,825 |
 Brazil |
2,654,761 | 2,279,920 | 2,185,822 |
 Canada |
2,490,256 | 2,319,900 | 2,270,076 |
 South Korea |
2,245,847 | 1,872,375 | 1,875,388 |
 Mexico |
2,176,236 | 1,832,641 | 1,852,723 |
 Australia |
2,110,657 | 1,798,519 | 1,830,610 |
 Spain |
2,085,276 | 1,906,453 | 1,722,746 |
 Indonesia |
1,479,954 | 1,445,643 | 1,396,300 |
 Netherlands |
1,423,856 | 1,332,768 | 1,214,928 |
 Saudi Arabia |
1,343,346 | 1,276,943 | 1,254,141 |
 Switzerland |
1,135,739 | 1,043,530 | 936,564 |
 Poland |
1,133,088 | 1,035,492 | 914,696 |
Wealth Across Continents and Trading Blocs
Countries frequently team up to form trade partnerships, creating immense economic areas. The European Union lets goods and workers travel freely across member states. Another major group is the G7, which brings together advanced industrial nations to discuss global problems.
Groups like ASEAN connect growing trade partners in Southeast Asia, while other reports track combined production across Sub-Saharan Africa, Latin America, and the Caribbean. By looking at these regional groupings, economists can observe how whole areas of our world cooperate to produce goods and provide services.
See also
 In Spanish: Anexo:Países por PIB (nominal) para niños
- List of countries by GDP (nominal) per capita
- List of countries by GDP (PPP)
- List of countries by GDP (PPP) per capita
- List of countries by past and projected GDP (nominal)
- List of countries by past and projected GDP (PPP)
- List of cities by GDP
- List of continents by GDP
- Largest country subdivisions by GDP
- List of regions by past GDP (PPP)
