
Economy of Australia facts for kids

Sydney's central business district is Australia's largest financial and business services hub.
|
|
| Currency | Australian dollar (AUD) |
|---|---|
| 1 July – 30 June | |
|
Trade organisations
|
APEC, CPTPP, G20, OECD, WTO, RCEP |
| Statistics | |
| Population | |
| GDP | |
| GDP rank | |
|
GDP growth
|
|
|
GDP per capita
|
|
|
GDP per capita rank
|
|
|
GDP by sector
|
|
|
|
|
Population below poverty line
|
13.4% (2020) |
| ▼ 33.0 medium (2021) | |
|
|
|
Labour force
|
|
|
Labour force by occupation
|
|
| Unemployment |
|
|
Average gross salary
|
A$7,890 / $5,031.37 monthly (2022) |
|
Average net salary
|
A$6,076 / $3,874.21 monthly (2022) |
|
Main industries
|
|
| External | |
| Exports | A$671.1 billion (2023) |
|
Export goods
|
iron ore, coal, natural gas, gold, aluminium, beef, crude petroleum, copper, meat (non-beef) |
|
Main export partners
|
|
| Imports | A$526.8 billion (2023) |
|
Import goods
|
petroleum, cars, telecom equipment and parts, goods vehicles, computers, medicaments, gold, civil engineering equipment, furniture |
|
Main import partners
|
|
|
FDI stock
|
|
|
Gross external debt
|
▼ US$2.095 trillion (Q1, 2019) |
| Public finances | |
|
Public debt
|
66.4% of GDP (October 2021) |
| Revenues | A$668.1 billion (2023) |
| Expenses | A$682.1 billion (2023) |
| Economic aid | donor: ODA, $4.09 billion (2022) |
|
Credit rating
|
|
|
Foreign reserves
|
$66.58 billion (31 December 2017 est.) |
Australia is a very developed country with a mixed economy. This means it has a mix of private businesses and government involvement. In 2023, Australia had the 13th largest economy in the world based on its total output (called nominal GDP). It was also the 19th largest when comparing what people can buy with their money (called PPP-adjusted GDP).
Australia holds a record for the longest time without a recession (when the economy shrinks for two quarters in a row) among developed countries. This streak lasted from 1991 until 2020. The country's economy is mostly driven by its service sector, which includes jobs like healthcare, education, and finance. This sector made up about 62.7% of Australia's total economic activity in 2017. It also employed most of the workers, about 78.8%.
Even though mining is a big part of Australia's economy, the country has stayed strong and stable. The Australian Securities Exchange in Sydney is one of the biggest stock markets globally. Australia's money is the Australian dollar, which is also used by some nearby Pacific island nations.
Australia's economy is closely connected to countries in East and Southeast Asia. About 64% of Australia's exports went to these regions in 2016. China is Australia's biggest trading partner for both exports and imports. Australia is also part of important international groups like APEC, G20, and the WTO. It has also made special trade deals with many countries, including the United States, Japan, and New Zealand.
Contents
Australia's Economic Journey
How Australia's Economy Grew
Australia's economy grew steadily through the 20th century. From 1901 to 2000, the average growth was about 3.4% each year. Unlike some countries, Australia became independent peacefully. This helped its economy and people's living standards stay strong. Growth was especially high in the 1920s, 1950s, and 1980s. However, there were tough times too, like in the 1930s and early 1990s.
Changes to the Economy


Since the early 1980s, Australia has made its economy more open and free. In 1983, the Australian dollar was allowed to float, meaning its value changed based on the market. Also, rules for banks and financial businesses were made simpler. These changes helped the economy become more flexible.
The Early 1990s Downturn
In the early 1990s, Australia faced a recession. This happened after a big stock market crash in 1987. During this time, the total value of goods and services produced (GDP) fell by 1.7%. Many people lost their jobs, and the unemployment rate went up to 10.8%. However, this period also helped to keep inflation (prices going up) low in Australia for many years afterward.
Mining's Big Role

Mining has always been a huge part of Australia's economic success, starting with the gold rush in the 1840s. Mining and farming attracted a lot of money from Britain. The government also spent a lot on roads, communication, and city buildings, which also relied on British money. As the economy grew, many people moved to Australia to work. This was especially true after the end of sending convicts there in 1840.
Mining continues to boost Australia's economy. Places like Western Australia have greatly benefited from mining iron ore and gold. This helped cities like Perth grow and become more modern.
The Global Financial Crisis (2008)
Around 2008, there was a big financial crisis around the world. The Australian government quickly put together a plan to spend $11.8 billion to help the economy. This plan worked, and Australia managed to avoid a recession during this global crisis.
Experts from groups like the World Bank and International Monetary Fund predicted that Australia's economy would keep growing. While the national economy grew, some states that didn't rely much on mining did experience a slowdown.
The 2020 Downturn
In September 2020, Australia officially entered a recession for the first time in almost 30 years. This was because of the COVID-19 pandemic. The country's total economic output (GDP) fell by 7% in the middle of 2020. However, the recession officially ended by December 2020.
Understanding Australia's Economy
Australia's economy is strong. Its average income per person (GDP per capita) is higher than many other developed countries like the UK, Canada, Germany, and France. In 2022, Australia was ranked 10th in the world for its Human Development Index, which measures things like health, education, and living standards.
Australia is also very good at exporting raw materials like minerals and farm products. This has helped its trade a lot. However, many companies in Australia are owned by foreign businesses. This means that even when Australia sells a lot of goods, some of the profits go overseas.
Inflation (how fast prices go up) in Australia is usually low, between 2% and 3%. The main interest rate, which affects borrowing money, has also been lowered to help the economy grow. The service sector, which includes things like tourism, education, and banking, makes up about 69% of Australia's economy.
Australia is rich in natural resources. It exports a lot of farm products, especially wheat and wool. It also exports minerals like iron ore and gold, and energy sources like liquified natural gas and coal. Even though farming and natural resources are a small part of the total economy (3% and 5% of GDP), they are very important for Australia's exports. Its biggest export markets are Japan, China, South Korea, India, and the United States.
At the start of the 2000s, Australia had a big mining boom. The mining industry's share of the economy grew a lot. The services sector also grew, especially property and business services. This growth meant that the manufacturing sector became a smaller part of the economy.
In 2018, Australia had the highest average wealth per adult in the world. This means people in Australia generally have a lot of assets.
Differences Across Australia
Between 2010 and 2013, much of Australia's economic growth came from areas with a lot of mining. States like Western Australia and the Northern Territory saw strong growth. However, other states like Victoria and New South Wales experienced slower times. This was called a "two-speed economy." More recently, the eastern states have started growing again, while mining-dependent states have slowed down.
How Australia Collects Taxes

In Australia, taxes are collected by the federal (national) government, state governments, and local councils. The federal government collects most of its money from income taxes and business taxes. Other taxes include the Goods and Services Tax (GST), which is added to the price of most goods and services.
State governments also have their own taxes, like payroll tax on businesses and stamp duty on property sales. Local councils collect taxes called "rates" to pay for local services like road repairs, garbage collection, and parks.
During World War II, the federal government took over collecting income tax from the states. This made the federal government much more powerful financially. Now, states and territories collect only about 18% of all government money but are responsible for almost 50% of the spending. This means the federal government often gives money to the states with conditions on how they spend it.
Jobs in Australia


As of June 2024, the unemployment rate in Australia was 4.1%. This means that 4.1% of people who wanted to work could not find a job. The number of young people (15-24 years old) looking for work was 9.6%.
Many people also work part-time, and some want to work more hours than they have. These people are called "underemployed." If you combine the unemployed and underemployed, the total is about 10.5%.
The main industries where Australians work are:
- Health care and social assistance
- Retail trade (shops)
- Construction (building things)
- Professional, scientific, and technical services (like IT and engineering)
- Education and training
Job Outlook for New Professionals
For people who have just finished their studies, finding a full-time job can vary. For example, between 2012 and 2015, the percentage of new dentistry graduates finding full-time jobs increased. However, for computer science and nursing graduates, the percentage decreased slightly.
Even if it takes a little while to find a job right after graduating, studies show that in the long run, most graduates find good employment.
Unemployment Rates by State
The unemployment rate can be different in various parts of Australia. For example, in June 2024, the Australian Capital Territory had the lowest unemployment rate at 3.0%, while the Northern Territory had the highest at 4.6%.
| Rank | States | Unemployment rate (June 2024) |
|---|---|---|
| 1 | Northern Territory | 4.6% |
| 2 | Victoria | 4.5% |
| 3 | New South Wales | 3.9% |
| 4 | South Australia | 3.9% |
| 5 | Queensland | 3.9% |
| 6 | Western Australia | 3.8% |
| 7 | Tasmania | 3.7% |
| 8 | Australian Capital Territory | 3.0% |
Key Economic Sectors

Industries that Make Things
Mining in Australia
Mining is a very important industry in Australia. In 2019, Australia was one of the world's top producers of many minerals. It was the largest producer of iron ore and bauxite (used to make aluminum). It was also the second-largest producer of gold and manganese. Australia also produces a lot of copper, lead, zinc, cobalt, and uranium.
Australia is also known for its precious stones. It is the world's largest producer of opal and a major producer of diamonds, rubies, and sapphires.
In terms of energy, Australia produces oil, natural gas, and a lot of coal. It is the world's leading exporter of coal. Big mining companies like Rio Tinto Group and BHP are based in Australia.
Manufacturing in Australia
The manufacturing industry, which makes goods, has become smaller in Australia over the years. In the 1960s, it made up 30% of the country's economy, but by 2007, it was only 12%.
For example, Australia used to make a lot of cars. But by 2017, all major car manufacturers like Holden and Toyota stopped making cars there. The textile industry (making clothes and fabrics) has also moved mostly to Asia.
Service Industries
Service industries are those that provide help or work for others, rather than making physical goods.
Finance and Banking
Australia's four biggest banks (National Australia Bank, Commonwealth Bank, Australia and New Zealand Banking Group, and Westpac) are considered among the safest banks in the world. This means they are very stable and reliable.
Tourism in Australia

Tourism is a big part of Australia's economy. In 2017/18, it added A$57.2 billion to the economy, which is about 3.1% of the total. Most of this comes from Australians traveling within their own country. Tourism also provides jobs for many people, about 646,000 in 2017–18.
Creative and Cultural Industries
The creative industries, like music, film, and design, are becoming more important to Australia's economy. In 2016, these industries added $122.8 billion to the economy. This was more than the manufacturing, healthcare, and mining sectors that year.
Media and Communication
Australia has a strong media industry, including newspapers, TV, radio, and streaming services. Large companies like News Corp Australia and Nine Entertainment own many of these. There are also national broadcasters like the ABC and SBS.
Education Services
Education is very important in Australia. Children must go to school from age 5 until about 16. Australia also has a very high adult literacy rate, meaning almost everyone can read and write.
Australia is a popular place for international students. In 2018, over half a million students from other countries came to study in Australia. This brings a lot of money into the country.
Australia's Infrastructure
Transportation Networks
Australia's transport system is crucial for its economy, making up 7.9% of its GDP in 2020-21. Road transport is especially important, helping industries like farming, manufacturing, and construction. Australia has over 300 airports with paved runways. There are also train networks for passengers in major cities and for transporting goods, especially minerals, to ports for export.
Energy Supply

Australia's economy relies heavily on imported oil and petroleum products. About 80% of its petroleum needs come from other countries.
Trade and Economic Performance
Australia's trade has changed a lot. In the past, it traded mostly with Europe and North America. Now, it trades much more with countries in Asia, like Japan and China.
In the late 1800s, Australia had one of the highest GDPs per person in the world because of its natural resources. As its population grew, its GDP per person became lower compared to countries like the US and Norway. However, Australia's economy has been growing steadily for over 20 years, often doing better than many other developed countries.
Australia's National Debt
Australia's total debt to other countries went over $1 trillion in 2017. This is partly because Australia often buys more goods and services from other countries than it sells. The government also has debt, with about 60% of it owed to foreigners.
China's Investment in Australia
China is a very important trading partner for Australia. Australia exports a lot of iron ore, wool, and other raw materials to China. Many Chinese students also study in Australia. China is also a major buyer of Australian government debt.
Chinese companies have invested billions of dollars in Australia's mining industry. A special investor visa program, started in 2012, has encouraged wealthy Chinese people to invest in Australia. This program makes it easier for them to get visas if they invest a large amount of money.
In 2017, Australia was the most popular place for millionaires to move to, especially from China. This was due to Australia's closeness, cleaner environment, stable economy, and investor visa programs.
However, a survey in 2018 showed that more Australians are concerned about too much investment from China.
Trade Agreements
Australia has many free trade agreements (FTAs) with other countries. These agreements make it easier and cheaper for businesses to trade goods and services. Some important FTAs include those with New Zealand, Singapore, the United States, China, and Japan. Australia is also working on new trade deals with groups like the European Union.
FTA (Free Trade Agreement) effective
|
FTA (Free Trade Agreement) negotiation
|
Australia's Balance of Payments


Australia has often had a "current account deficit." This means that more money leaves the country (for imports, or profits going to foreign owners) than comes in (from exports). This happens partly because Australia relies on exporting raw materials, which can have changing prices. Also, many companies in Australia are foreign-owned, so profits go overseas.
To help with this, the Australian government has tried to boost its manufacturing sector. This has helped manufacturing grow.
Personal Wealth in Australia

Australia is a wealthy country. In 2011, a report found that Australia was the second-wealthiest country in the world based on average wealth per adult. It also had the highest "median wealth," meaning that half of all adults had more than US$222,000 in wealth. This was due to a strong Australian dollar, many people owning homes, and a good job market.
Compared to other countries, very few Australians have a low net worth. This is because Australians generally have less credit card and student loan debt. In 2017, Australia was the top place for millionaires to move to, attracting more than the United States.
Poverty and Homelessness
Poverty in Australia
A report in 2022 showed that poverty is increasing in Australia. About 3.3 million people, or 13.5% of the population, live below the poverty line. This line is usually set at 50% of a country's average income. The report also found that about 761,000 children under 15 are living in poverty.
Homelessness in Australia
In 2011, over 105,000 people in Australia were experiencing homelessness in Australia. This means about 1 in 200 Australians had no stable home. By 2016, this number had increased to 116,000 people.
Images for kids
-
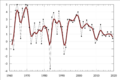
Annual percentage growth in real (chain volume) GDP per capita since 1961. This chart shows how much the economy grew per person each year, after adjusting for price changes.
-
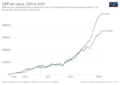
Real GDP per capita development in Australia and New Zealand. This chart compares how much money each person in Australia and New Zealand earned, adjusted for prices.
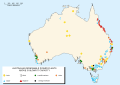
-
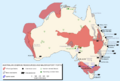
Australian energy resources and major export ports map. This map shows where Australia's energy resources are found and the main ports they are shipped from.
-
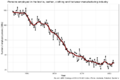
Total employment in Australian textile, clothing and footwear manufacturing (thousands of people) since 1984. This chart shows how many people worked in this industry over time.
-
Australian renewable power plants. This map shows where Australia's power plants that use renewable energy sources are located.

See also
 In Spanish: Economía de Australia para niños
