United States presidential election in Texas, 2016 facts for kids
The 2016 United States presidential election in Texas happened on November 8, 2016. This election was part of the larger 2016 United States presidential election where people in all other states and Washington, D.C., also voted.
On March 1, 2016, people in Texas also voted to choose who they wanted to be the main candidate for their political parties. This step helps decide who will run for president.
Contents
Who Won the Texas Presidential Vote?
What Experts Thought Would Happen
Texas has voted for the Republican Party candidate in every presidential election since 1980. Before the 2016 election, many news groups predicted how Texas would vote. Most thought the Republican candidate, Donald Trump, would win.
- Los Angeles Times: Thought Trump would likely win.
- CNN: Believed Trump would definitely win.
- Sabato's Crystal Ball: Also thought Trump would definitely win.
- NBC: Thought Trump would likely win.
- Electoral-vote.com: Thought Trump would likely win.
- RealClearPolitics: Thought Trump would likely win.
- Fox News: Thought Trump would likely win.
- ABC: Believed Trump would definitely win.
Official Election Results
In the actual election, Donald Trump won the most votes in Texas. Here's how the main candidates did:
| Presidential Election Results in Texas | ||
|---|---|---|
| Candidate | Total Votes | Percentage of Votes |
| Donald Trump (Republican) | 4,681,590 | 52.42% |
| Hillary Clinton (Democrat) | 3,867,816 | 43.31% |
| Gary Johnson | 282,524 | 3.16% |
| Jill Stein | 71,307 | 0.79% |
| Evan McMullin | 20,227 | 0.22% |
| Total votes | 8,929,462 | 100% |
How Counties Voted
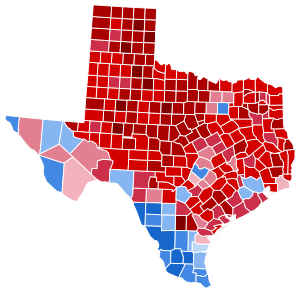
The map shows how each county in Texas voted. Most counties voted for Donald Trump, but some larger cities and their surrounding areas voted for Hillary Clinton.
| County | Trump Votes | Trump % | Clinton Votes | Clinton % | Other Votes | Other % | Total |
|---|---|---|---|---|---|---|---|
| Anderson | 13,165 | 77.95 | 3,358 | 19.88 | 364 | 2.16 | 16,887 |
| Andrews | 3,925 | 79.43 | 836 | 16.91 | 180 | 3.64 | 4,941 |
| Angelina | 21,666 | 72.47 | 7,538 | 25.21 | 692 | 2.32 | 29,896 |
| Aransas | 7,730 | 73.71 | 2,458 | 23.44 | 298 | 2.85 | 10,486 |
| Archer | 3,785 | 88.49 | 394 | 9.21 | 98 | 2.29 | 4,277 |
| Armstrong | 924 | 90.49 | 70 | 6.85 | 27 | 2.65 | 1,021 |
| Atascosa | 8,598 | 63.05 | 4,635 | 33.99 | 403 | 2.96 | 13,636 |
| Austin | 9,637 | 78.52 | 2,319 | 18.89 | 317 | 2.58 | 12,273 |
| Bailey | 1,343 | 74.94 | 397 | 22.15 | 52 | 2.90 | 1,792 |
| Bandera | 8,159 | 79.88 | 1,726 | 16.89 | 329 | 3.22 | 10,214 |
| Bastrop | 16,314 | 57.39 | 10,555 | 37.13 | 1,555 | 5.48 | 28,424 |
| Baylor | 1,267 | 84.52 | 191 | 12.74 | 41 | 2.74 | 1,499 |
| Bee | 4,743 | 55.91 | 3,443 | 40.58 | 300 | 3.54 | 8,483 |
| Bell | 51,780 | 54.76 | 37,608 | 39.77 | 5,163 | 5.46 | 94,551 |
| Bexar | 240,333 | 40.42 | 319,550 | 53.74 | 34,099 | 5.74 | 598,691 |
| Blanco | 4,212 | 74.08 | 1,244 | 21.88 | 229 | 4.03 | 5,685 |
| Borden | 330 | 90.41 | 31 | 8.49 | 4 | 1.10 | 365 |
| Bosque | 6,325 | 80.85 | 1,277 | 16.32 | 221 | 2.82 | 7,823 |
| Bowie | 24,913 | 71.99 | 8,831 | 25.52 | 809 | 2.34 | 34,603 |
| Brazoria | 72,653 | 60.08 | 43,075 | 35.62 | 5,183 | 4.29 | 120,911 |
| Brazos | 38,662 | 57.67 | 23,041 | 34.37 | 5,326 | 7.95 | 67,029 |
| Brewster | 2,073 | 48.87 | 1,869 | 44.06 | 299 | 7.05 | 4,241 |
| Briscoe | 625 | 84.91 | 91 | 12.36 | 20 | 2.72 | 736 |
| Brooks | 613 | 23.61 | 1,937 | 74.61 | 46 | 1.77 | 2,596 |
| Brown | 12,010 | 85.67 | 1,621 | 11.56 | 387 | 2.76 | 14,018 |
| Burleson | 5,316 | 76.37 | 1,491 | 21.42 | 153 | 2.20 | 6,960 |
| Burnet | 14,595 | 76.23 | 3,785 | 19.76 | 766 | 4.00 | 19,146 |
Choosing Party Candidates (Caucuses)
Before the main election, political parties hold events called caucuses or primaries. This is where party members vote to choose their favorite candidate to represent their party in the presidential election.
Democratic Party Choices
The Democratic Party caucus in Texas happened on March 26, 2016. Here's how the votes for their candidates turned out:
| Democratic Party Caucus Results | |||
|---|---|---|---|
| Candidate | Total Votes | Percentage of Votes | Delegates Won |
| Hillary Clinton | 936,004 | 65.19% | 168 |
| Bernie Sanders | 476,547 | 33.19% | 75 |
| Rocky De La Fuente | 8,429 | 0.59% | |
| Martin O'Malley | 5,364 | 0.37% | |
| Willie Wilson | 3,254 | 0.23% | |
| Keith Judd | 2,569 | 0.18% | |
| Calvis L. Hawes | 2,017 | 0.14% | |
| Star Locke | 1,711 | 0.12% | |
| Total votes | 1,435,895 | 100% | 20 |
Republican Party Choices
The Republican Party caucus in Texas took place on March 1, 2016. Here are the results for their candidates:
Uncommitted
| Republican Party Caucus Results | |||
|---|---|---|---|
| Candidate | Total Votes | Percentage of Votes | Delegates Won |
| Ted Cruz | 1,241,118 | 43.76% | 104 |
| Donald Trump | 758,762 | 26.75% | 48 |
| Marco Rubio | 503,055 | 17.74% | 3 |
| John Kasich | 120,473 | 4.25% | |
| Ben Carson | 117,969 | 4.16% | |
| Jeb Bush | 35,420 | 1.25% | |
| 29,609 | 1.04% | ||
| Rand Paul | 8,000 | 0.28% | |
| Mike Huckabee | 6,226 | 0.22% | |
| Elizabeth Gray | 5,449 | 0.19% | |
| Chris Christie | 3,448 | 0.12% | |
| Carly Fiorina | 3,247 | 0.11% | |
| Rick Santorum | 2,006 | 0.07% | |
| Lindsey Graham | 1,706 | 0.06% | |
| Total votes | 2,836,488 | 100% | 155 |
Images for kids


