Climate of New York (state) facts for kids
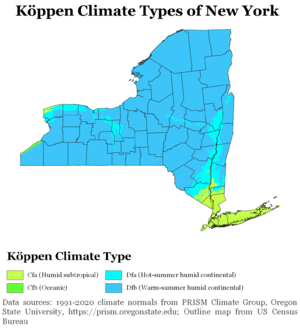
New York State mostly has a humid continental climate. This means it has warm, humid summers and cold, snowy winters. However, the very southeastern part of the state, like New York City and Long Island, has a slightly warmer humid subtropical climate.
In most of New York, winter temperatures are usually below freezing in January and February. But along the Atlantic coast, including New York City, it's a few degrees warmer. Summer weather usually lasts from June to early September across the state. In southern New York and New York City, summer conditions can start in late May and last until mid-October.
Northern New York experiences winter from November to April. In southern New York, winter is from December to March. Western New York often has more clouds than other parts of the state. Many of these clouds come from the Great Lakes. New York City's many buildings and paved areas create an "urban heat island" effect. This makes temperatures warmer overnight in the city during all seasons.
New York State gets a fair amount of rain and snow throughout the year. The Great Lakes region gets the most rain and snow. Heavy lake-effect snow is common in western and central New York during winter. In warmer months, big thunderstorms can move into the state from Canada and the Great Lakes. Sometimes, tropical cyclones (like hurricanes) bring strong winds and heavy rains from the southwest in summer and fall. On average, New York experiences a hurricane about every 18–19 years. About ten tornadoes touch down in New York each year.
Contents
Temperatures in New York
The average yearly temperature across New York State changes a lot. It's about 39 °F (4 °C) in the Adirondack Mountains. It gets warmer as you go south, reaching about 53 °F (12 °C) in the Hudson Valley and Long Island. In New York City, the average is around 56 °F (13 °C).
New York's weather is mainly affected by two types of air:
- Warm, humid air from the southwest.
- Cold, dry air from the northwest.
Sometimes, cool, humid air comes from the North Atlantic. This can cause many clouds and rain or snow that lasts for a long time. Temperatures can be very different between the warm coast and the cold northern inland areas. There might be rain near the coast while sleet or freezing rain falls inland. This often happens between November and April.
New York City has a humid subtropical climate (Koppen Cfa), which is different from most of the state. It's also an urban heat island, meaning temperatures are 5 °F (−15 °C) to 7 °F (−14 °C) warmer overnight than in nearby areas. To help cool the city, some buildings are painting their roofs white. This helps reflect sunlight and reduce heat.
Summer Weather
Summer weather in New York State varies a lot by region. The Adirondacks are cooler in summer because they are at a higher elevation. They usually have pleasant, dry weather. Temperatures there are typically between 66 °F (19 °C) and 73 °F (23 °C). Evenings in the Adirondacks are cool, usually between 45 °F (7 °C) and 54 °F (12 °C).
Most of Western New York, Central New York, the mid-Hudson Valley, and the Catskills have moderate but humid summers. Temperatures are usually between 80 °F (27 °C) and 85 °F (29 °C). Nights in central New York are often muggy, between 61 °F (16 °C) and 67 °F (19 °C).
The New York City area and the Lower Hudson Valley have hotter, more tropical summers. They often have high temperatures and high humidity. Temperatures here are usually between 86 °F (30 °C) and Template:91. Areas right by the ocean and south-facing parts of Long Island are slightly cooler, between 85 °F (29 °C) and Template:90. Nights are warm and muggy, between 68 °F (20 °C) and Template:75. The hottest temperature ever recorded in New York State was 108 °F (42 °C). This happened in Troy on July 22, 1926.
Heat Waves
Heat waves are common in New York State. They bring very hot and humid weather. Heat waves happen at least twice each summer and usually last for 3 to 5 days. Only the Adirondacks usually avoid the most extreme heat during these times. The Adirondacks will be warm to hot and humid, but still cooler than the rest of the state during a heat wave.
Winter Snowfall
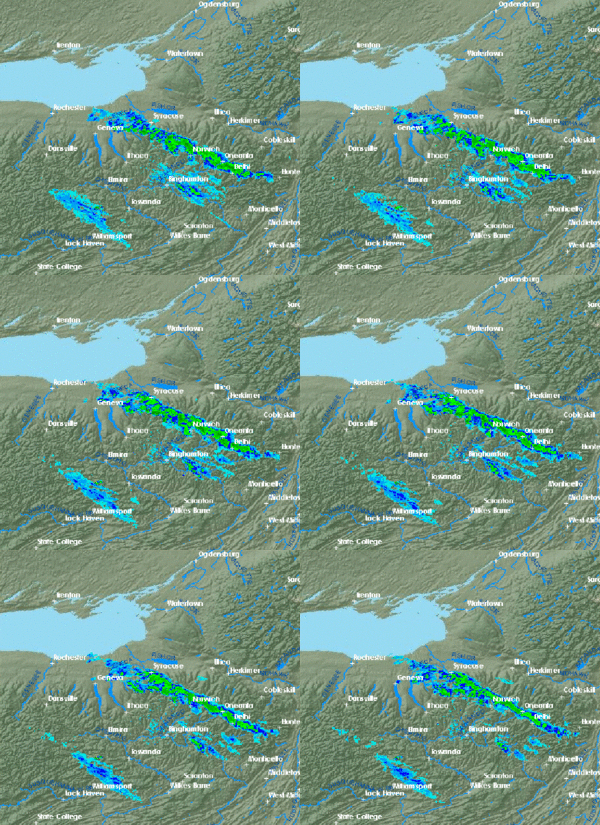
Snowfall in New York State also changes a lot by region. Lake-effect snow happens in Western New York and the Adirondacks. This snow forms over Lake Ontario and Lake Erie. Lake-effect snow is very local. Some areas might get feet of snow, while others nearby get only an inch or none at all.
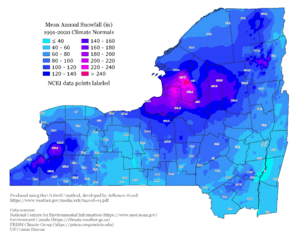
The Adirondacks get the most snowfall. This is because of lake-effect snow and their higher elevations. They see between 100 and 200 inches of snow per year. Some western parts of the Adirondacks can get even more than 200 inches. Western and Central New York get between 75 and 150 inches per year. This depends on your exact location and where the snow bands hit.
The Catskills get an average amount of snow, between 25 and 50 inches. Most of this snow comes from nor'easter storms. New York City, Long Island, and the Hudson Valley get the least amount of snow. This is because they have warmer temperatures from the ocean. Nor'easters in these areas often bring a mix of rain and snow. These areas usually get between 10 and 25 inches of snow.
Winter Temperatures
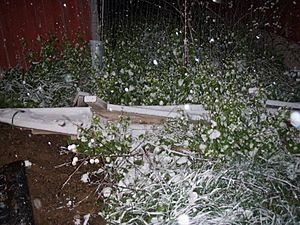
Winter temperatures vary, just like summer temperatures. The Adirondacks are the coldest part of New York. They are almost always below freezing for about three months straight. Temperatures there are usually between 18 °F (−8 °C) and Template:23. Nights are very cold, between −2 °F (−19 °C) and Template:4.
Most of Central New York, the Mid-Hudson Valley, and the Catskills have moderate winter temperatures. They are not extremely cold, but not mild either. Temperatures are between 30 °F (−1 °C) and Template:35. Nights are cold but not freezing, between 18 °F (−8 °C) and Template:23.
New York City, the Lower Hudson Valley, and Long Island are the warmest parts of New York State. Warmer ocean temperatures keep these areas between 37 °F (3 °C) and Template:42. This is warmer than locations upstate. Nights in these downstate areas are usually between 27 °F (−3 °C) and Template:31.
The coldest temperature ever recorded in New York State was −52 °F (−47 °C). This happened in Stillwater Reservoir on February 9, 1934, and in Old Forge on February 18, 1979.
Records
| Event | Measurement | Date | Location | County |
|---|---|---|---|---|
| Highest temperature | 108 °F (42.2 °C) | July 22, 1926 | Troy | Rensselaer |
| Lowest temperature | −52 °F (−46.7 °C) | February 18, 1979 | Old Forge | Herkimer |
| Lowest temperature | −52 °F (−46.7 °C) | February 9, 1934 | Stillwater Reservoir | Herkimer |
Plant Growing Zones
New York State has different growing seasons depending on the area. This is important for gardening and farming.
- The Adirondacks have the shortest growing season. They are in hardiness zones 3 to 4.
- Central New York, Western New York, the Catskills, and the Mid-Hudson Valley have much longer growing seasons. They are in zones 5 to 6, which means more agriculture is possible.
- The Lower Hudson Valley, New York City, and Long Island have the longest growing season in the state. They are in zones 6 to 7. Some parts of New York City are even in zone 8. This is because of the ocean's influence and the urban heat island effect.
Cloudiness
Southeastern New York, near New York City, has clouds covering the sky about 59-62% of the year. Areas in western New York, around Buffalo, are cloudier. They have clouds about 71–75% of the year.
Precipitation
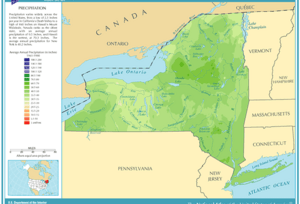
The amount of rain and snow across New York State varies. The mountains of the Appalachians usually get the most. New York gets between 28 inches (710 mm) and 62 inches (1,600 mm) of precipitation each year. Some areas get over 60 inches (1,500 mm). These include parts of Lewis, Oneida, Hamilton, and Ulster Counties. The lowest amounts of precipitation are near the borders with Vermont and Ontario, and in parts of southwestern New York.
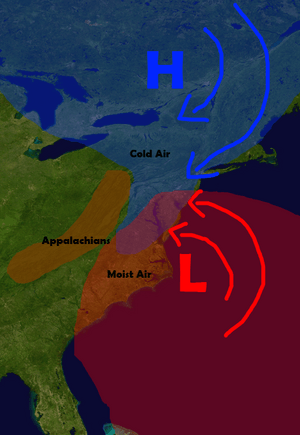
During the cold season, storms called nor'easters bring a lot of winter precipitation. These storms form along the coast and move north. The Appalachian Mountains mostly protect New York City from lake-effect snow. Lake-effect snow forms when cold air moves over the warmer Great Lakes. The Finger Lakes in New York are also long enough to cause lake-effect snow. This snow happens until the lakes freeze over. Areas downwind of Lake Erie can get over 150 inches (380 cm) of lake-effect snow each year. Areas downwind of Lake Ontario can get over 200 inches (510 cm).
In summer and early fall, large thunderstorm systems can move into New York from Canada and the Great Lakes. Sometimes, tropical storms or what's left of them move into the state from the south.
Records
| Event | Measurement | Date | Location | County |
|---|---|---|---|---|
| Greatest 24-hour precipitation | 13.57 inches (345 mm) | August 12–13, 2014 | Islip | Suffolk |
| Greatest 24-hour snowfall | 50 inches (130 cm) | January 31, 1966 | Camden | Oneida |
| Greatest snow depth | 119 inches (300 cm) | April 20, 1943 | Whiteface Mountain | Essex County |
Air Pollution
New York State ranks low in greenhouse gases produced per person. This is because many people, especially in and around New York City, use public transportation like subways and buses.
However, New York City, especially Manhattan, has high rates of air pollution. This is due to the very high number of people living closely together.
Severe Weather
New York experiences about ten tornadoes each year. About one strong tornado (EF2-EF5) happens every five years. A hurricane impacts the state about every 18–19 years. A major hurricane impacts the state about every 70–74 years. In 2016, much of New York had a severe drought. This included the Finger Lakes region, where the drought followed a very mild winter with little snow.
Climate Data for Select Cities
| Climate data for Albany International Airport, New York (1991–2020 normals, extremes 1874–present ) | |||||||||||||
|---|---|---|---|---|---|---|---|---|---|---|---|---|---|
| Month | Jan | Feb | Mar | Apr | May | Jun | Jul | Aug | Sep | Oct | Nov | Dec | Year |
| Record high °F (°C) | 71 (22) |
74 (23) |
89 (32) |
93 (34) |
97 (36) |
100 (38) |
104 (40) |
102 (39) |
100 (38) |
91 (33) |
82 (28) |
72 (22) |
104 (40) |
| Mean maximum °F (°C) | 55 (13) |
54 (12) |
66 (19) |
81 (27) |
88 (31) |
92 (33) |
93 (34) |
91 (33) |
87 (31) |
78 (26) |
68 (20) |
56 (13) |
95 (35) |
| Mean daily maximum °F (°C) | 32.8 (0.4) |
36.0 (2.2) |
45.3 (7.4) |
59.2 (15.1) |
71.2 (21.8) |
79.4 (26.3) |
83.9 (28.8) |
82.0 (27.8) |
74.4 (23.6) |
61.6 (16.4) |
49.3 (9.6) |
38.2 (3.4) |
59.4 (15.2) |
| Daily mean °F (°C) | 24.4 (−4.2) |
26.8 (−2.9) |
35.7 (2.1) |
48.1 (8.9) |
59.6 (15.3) |
68.4 (20.2) |
73.1 (22.8) |
71.4 (21.9) |
63.5 (17.5) |
51.4 (10.8) |
40.5 (4.7) |
30.4 (−0.9) |
49.4 (9.7) |
| Mean daily minimum °F (°C) | 15.9 (−8.9) |
17.6 (−8.0) |
26.1 (−3.3) |
36.9 (2.7) |
48.1 (8.9) |
57.4 (14.1) |
62.4 (16.9) |
60.7 (15.9) |
52.6 (11.4) |
41.1 (5.1) |
31.6 (−0.2) |
22.7 (−5.2) |
39.4 (4.1) |
| Mean minimum °F (°C) | −6 (−21) |
−2 (−19) |
8 (−13) |
24 (−4) |
34 (1) |
43 (6) |
52 (11) |
49 (9) |
38 (3) |
27 (−3) |
16 (−9) |
5 (−15) |
−8 (−22) |
| Record low °F (°C) | −28 (−33) |
−22 (−30) |
−21 (−29) |
9 (−13) |
26 (−3) |
35 (2) |
40 (4) |
34 (1) |
24 (−4) |
16 (−9) |
−11 (−24) |
−22 (−30) |
−28 (−33) |
| Average precipitation inches (mm) | 2.60 (66) |
2.28 (58) |
3.09 (78) |
3.11 (79) |
3.41 (87) |
4.05 (103) |
4.55 (116) |
3.76 (96) |
3.73 (95) |
3.85 (98) |
2.99 (76) |
3.26 (83) |
40.68 (1,033) |
| Average snowfall inches (cm) | 15.6 (40) |
13.7 (35) |
12.0 (30) |
1.6 (4.1) |
0.1 (0.25) |
0.0 (0.0) |
0.0 (0.0) |
0.0 (0.0) |
0.0 (0.0) |
0.3 (0.76) |
2.6 (6.6) |
13.3 (34) |
59.2 (150) |
| Average precipitation days (≥ 0.01 in) | 12.7 | 10.6 | 11.8 | 12.2 | 12.7 | 12.2 | 11.4 | 11.0 | 9.7 | 11.2 | 11.1 | 12.6 | 139.2 |
| Average snowy days (≥ 0.1 in) | 10.1 | 7.8 | 5.7 | 1.3 | 0.0 | 0.0 | 0.0 | 0.0 | 0.0 | 0.2 | 2.4 | 7.0 | 34.5 |
| Average relative humidity (%) | 71.1 | 68.5 | 64.8 | 61.2 | 65.5 | 69.5 | 70.5 | 74.1 | 75.7 | 72.4 | 73.1 | 73.9 | 70.0 |
| Average dew point °F (°C) | 12.9 (−10.6) |
14.5 (−9.7) |
22.6 (−5.2) |
32.2 (0.1) |
45.0 (7.2) |
55.0 (12.8) |
60.3 (15.7) |
59.4 (15.2) |
52.3 (11.3) |
40.3 (4.6) |
31.1 (−0.5) |
19.4 (−7.0) |
37.1 (2.8) |
| Mean monthly sunshine hours | 141.1 | 158.5 | 200.3 | 218.9 | 248.9 | 262.2 | 289.2 | 253.2 | 210.5 | 168.8 | 100.7 | 108.3 | 2,360.6 |
| Percent possible sunshine | 48 | 54 | 54 | 54 | 55 | 57 | 62 | 59 | 56 | 49 | 34 | 38 | 53 |
| Average ultraviolet index | 1 | 2 | 4 | 5 | 7 | 8 | 8 | 7 | 6 | 3 | 2 | 1 | 5 |
| Source 1: NOAA (relative humidity, dew point, and sun 1961–1990) | |||||||||||||
| Source 2: Weather Atlas | |||||||||||||
| Climate data for Buffalo Niagara International Airport, New York (1981–2010 normals, extremes 1871–present ) | |||||||||||||
|---|---|---|---|---|---|---|---|---|---|---|---|---|---|
| Month | Jan | Feb | Mar | Apr | May | Jun | Jul | Aug | Sep | Oct | Nov | Dec | Year |
| Record high °F (°C) | 72 (22) |
71 (22) |
82 (28) |
94 (34) |
94 (34) |
97 (36) |
97 (36) |
99 (37) |
98 (37) |
92 (33) |
80 (27) |
74 (23) |
99 (37) |
| Mean maximum °F (°C) | 54.4 (12.4) |
54.9 (12.7) |
68.8 (20.4) |
79.0 (26.1) |
82.9 (28.3) |
88.4 (31.3) |
89.2 (31.8) |
88.2 (31.2) |
85.2 (29.6) |
76.6 (24.8) |
67.5 (19.7) |
55.6 (13.1) |
90.9 (32.7) |
| Mean daily maximum °F (°C) | 31.2 (−0.4) |
33.3 (0.7) |
42.0 (5.6) |
55.0 (12.8) |
66.5 (19.2) |
75.3 (24.1) |
79.9 (26.6) |
78.4 (25.8) |
71.1 (21.7) |
59.0 (15.0) |
47.6 (8.7) |
36.1 (2.3) |
56.4 (13.6) |
| Mean daily minimum °F (°C) | 18.5 (−7.5) |
19.2 (−7.1) |
26.0 (−3.3) |
36.8 (2.7) |
47.4 (8.6) |
57.3 (14.1) |
62.3 (16.8) |
60.8 (16.0) |
53.4 (11.9) |
42.7 (5.9) |
33.9 (1.1) |
24.1 (−4.4) |
40.3 (4.6) |
| Mean minimum °F (°C) | −0.5 (−18.1) |
1.8 (−16.8) |
7.8 (−13.4) |
24.2 (−4.3) |
34.8 (1.6) |
44.7 (7.1) |
51.4 (10.8) |
49.2 (9.6) |
39.8 (4.3) |
29.8 (−1.2) |
20.3 (−6.5) |
5.3 (−14.8) |
−3.7 (−19.8) |
| Record low °F (°C) | −16 (−27) |
−20 (−29) |
−7 (−22) |
5 (−15) |
25 (−4) |
35 (2) |
43 (6) |
38 (3) |
32 (0) |
20 (−7) |
2 (−17) |
−10 (−23) |
−20 (−29) |
| Average precipitation inches (mm) | 3.18 (81) |
2.49 (63) |
2.87 (73) |
3.01 (76) |
3.46 (88) |
3.66 (93) |
3.23 (82) |
3.26 (83) |
3.90 (99) |
3.52 (89) |
4.01 (102) |
3.89 (99) |
40.48 (1,028) |
| Average snowfall inches (cm) | 25.3 (64) |
17.3 (44) |
12.9 (33) |
2.7 (6.9) |
0.3 (0.76) |
0 (0) |
0 (0) |
0 (0) |
0 (0) |
0.9 (2.3) |
7.9 (20) |
27.4 (70) |
94.7 (241) |
| Average precipitation days (≥ 0.01 in) | 19.2 | 16.0 | 15.1 | 13.1 | 12.7 | 12.1 | 10.6 | 10.1 | 11.4 | 12.9 | 15.0 | 18.3 | 166.5 |
| Average snowy days (≥ 0.1 in) | 16.3 | 13.1 | 9.2 | 3.1 | 0 | 0 | 0 | 0 | 0 | 0.4 | 4.9 | 14.0 | 61.0 |
| Average relative humidity (%) | 76.0 | 75.9 | 73.3 | 67.8 | 67.2 | 68.6 | 68.1 | 72.1 | 74.0 | 72.9 | 75.8 | 77.6 | 72.4 |
| Mean monthly sunshine hours | 91.3 | 108.0 | 163.7 | 204.7 | 258.3 | 287.1 | 306.7 | 266.4 | 207.6 | 159.4 | 84.4 | 69.0 | 2,206.6 |
| Percent possible sunshine | 31 | 37 | 44 | 51 | 57 | 63 | 66 | 62 | 55 | 47 | 29 | 25 | 49 |
| Source: NOAA (relative humidity and sun 1961–1990) | |||||||||||||
| Climate data for Islip, New York (Long Island MacArthur Airport), 1981–2010 normals, extremes 1984–present | |||||||||||||
|---|---|---|---|---|---|---|---|---|---|---|---|---|---|
| Month | Jan | Feb | Mar | Apr | May | Jun | Jul | Aug | Sep | Oct | Nov | Dec | Year |
| Record high °F (°C) | 69 (21) |
67 (19) |
82 (28) |
94 (34) |
98 (37) |
96 (36) |
102 (39) |
100 (38) |
93 (34) |
88 (31) |
78 (26) |
77 (25) |
102 (39) |
| Mean daily maximum °F (°C) | 38.0 (3.3) |
40.3 (4.6) |
47.3 (8.5) |
57.6 (14.2) |
67.5 (19.7) |
76.6 (24.8) |
81.7 (27.6) |
80.4 (26.9) |
73.8 (23.2) |
63.0 (17.2) |
53.2 (11.8) |
43.0 (6.1) |
60.3 (15.7) |
| Mean daily minimum °F (°C) | 23.3 (−4.8) |
25.2 (−3.8) |
31.3 (−0.4) |
40.6 (4.8) |
49.8 (9.9) |
60.2 (15.7) |
66.0 (18.9) |
65.3 (18.5) |
57.5 (14.2) |
45.5 (7.5) |
37.1 (2.8) |
28.2 (−2.1) |
44.3 (6.8) |
| Record low °F (°C) | −7 (−22) |
0 (−18) |
5 (−15) |
23 (−5) |
32 (0) |
42 (6) |
50 (10) |
45 (7) |
38 (3) |
28 (−2) |
11 (−12) |
5 (−15) |
−7 (−22) |
| Average precipitation inches (mm) | 3.64 (92) |
3.26 (83) |
4.44 (113) |
4.34 (110) |
3.78 (96) |
4.27 (108) |
3.43 (87) |
3.98 (101) |
3.58 (91) |
3.79 (96) |
3.67 (93) |
4.06 (103) |
46.24 (1,173) |
| Average snowfall inches (cm) | 6.7 (17) |
7.1 (18) |
4.5 (11) |
0.6 (1.5) |
0 (0) |
0 (0) |
0 (0) |
0 (0) |
0 (0) |
0 (0) |
0.5 (1.3) |
5.4 (14) |
24.8 (62.8) |
| Average precipitation days (≥ 0.01 in) | 11.0 | 9.1 | 10.5 | 11.3 | 11.1 | 10.1 | 9.1 | 8.5 | 8.6 | 8.5 | 10.3 | 10.8 | 118.9 |
| Average snowy days (≥ 0.1 in) | 3.7 | 3.4 | 2.3 | 0.3 | 0 | 0 | 0 | 0 | 0 | 0 | 0.2 | 2.4 | 12.3 |
| Source: NOAA | |||||||||||||
| Climate data for New York (Belvedere Castle, Central Park), 1981–2010 normals, extremes 1869–present | |||||||||||||
|---|---|---|---|---|---|---|---|---|---|---|---|---|---|
| Month | Jan | Feb | Mar | Apr | May | Jun | Jul | Aug | Sep | Oct | Nov | Dec | Year |
| Record high °F (°C) | 72 (22) |
75 (24) |
86 (30) |
96 (36) |
99 (37) |
101 (38) |
106 (41) |
104 (40) |
102 (39) |
94 (34) |
84 (29) |
75 (24) |
106 (41) |
| Mean maximum °F (°C) | 59.6 (15.3) |
60.7 (15.9) |
71.5 (21.9) |
83.0 (28.3) |
88.0 (31.1) |
92.3 (33.5) |
95.4 (35.2) |
93.7 (34.3) |
88.5 (31.4) |
78.8 (26.0) |
71.3 (21.8) |
62.2 (16.8) |
97.0 (36.1) |
| Mean daily maximum °F (°C) | 38.3 (3.5) |
41.6 (5.3) |
49.7 (9.8) |
61.2 (16.2) |
70.8 (21.6) |
79.3 (26.3) |
84.1 (28.9) |
82.6 (28.1) |
75.2 (24.0) |
63.8 (17.7) |
53.8 (12.1) |
43.0 (6.1) |
62.0 (16.7) |
| Daily mean °F (°C) | 32.6 (0.3) |
35.3 (1.8) |
42.5 (5.8) |
53.0 (11.7) |
62.4 (16.9) |
71.4 (21.9) |
76.5 (24.7) |
75.2 (24.0) |
68.0 (20.0) |
56.9 (13.8) |
47.7 (8.7) |
37.5 (3.1) |
55.0 (12.8) |
| Mean daily minimum °F (°C) | 26.9 (−2.8) |
28.9 (−1.7) |
35.2 (1.8) |
44.8 (7.1) |
54.0 (12.2) |
63.6 (17.6) |
68.8 (20.4) |
67.8 (19.9) |
60.8 (16.0) |
50.0 (10.0) |
41.6 (5.3) |
32.0 (0.0) |
47.9 (8.8) |
| Mean minimum °F (°C) | 9.2 (−12.7) |
12.8 (−10.7) |
18.5 (−7.5) |
32.3 (0.2) |
43.5 (6.4) |
52.9 (11.6) |
60.3 (15.7) |
58.8 (14.9) |
48.6 (9.2) |
38.0 (3.3) |
27.7 (−2.4) |
15.6 (−9.1) |
7.0 (−13.9) |
| Record low °F (°C) | −6 (−21) |
−15 (−26) |
3 (−16) |
12 (−11) |
32 (0) |
44 (7) |
52 (11) |
50 (10) |
39 (4) |
28 (−2) |
7 (−14) |
−13 (−25) |
−15 (−26) |
| Average precipitation inches (mm) | 3.65 (93) |
3.09 (78) |
4.36 (111) |
4.50 (114) |
4.19 (106) |
4.41 (112) |
4.60 (117) |
4.44 (113) |
4.28 (109) |
4.40 (112) |
4.02 (102) |
4.00 (102) |
49.94 (1,268) |
| Average snowfall inches (cm) | 7.0 (18) |
9.2 (23) |
3.9 (9.9) |
0.6 (1.5) |
0 (0) |
0 (0) |
0 (0) |
0 (0) |
0 (0) |
0 (0) |
0.3 (0.76) |
4.8 (12) |
25.8 (66) |
| Average precipitation days (≥ 0.01 in) | 10.4 | 9.2 | 10.9 | 11.5 | 11.1 | 11.2 | 10.4 | 9.5 | 8.7 | 8.9 | 9.6 | 10.6 | 122.0 |
| Average snowy days (≥ 0.1 in) | 4.0 | 2.8 | 1.8 | 0.3 | 0 | 0 | 0 | 0 | 0 | 0 | 0.2 | 2.3 | 11.4 |
| Average relative humidity (%) | 61.5 | 60.2 | 58.5 | 55.3 | 62.7 | 65.2 | 64.2 | 66.0 | 67.8 | 65.6 | 64.6 | 64.1 | 63.0 |
| Mean monthly sunshine hours | 162.7 | 163.1 | 212.5 | 225.6 | 256.6 | 257.3 | 268.2 | 268.2 | 219.3 | 211.2 | 151.0 | 139.0 | 2,534.7 |
| Percent possible sunshine | 54 | 55 | 57 | 57 | 57 | 57 | 59 | 63 | 59 | 61 | 51 | 48 | 57 |
| Source: NOAA (relative humidity and sun 1961–1990)
See Geography of New York City for additional climate information from the outer boroughs. |
|||||||||||||
| Climate data for LaGuardia Airport, New York (1981–2010 normals, extremes 1940–present) | |||||||||||||
|---|---|---|---|---|---|---|---|---|---|---|---|---|---|
| Month | Jan | Feb | Mar | Apr | May | Jun | Jul | Aug | Sep | Oct | Nov | Dec | Year |
| Record high °F (°C) | 72 (22) |
74 (23) |
86 (30) |
94 (34) |
97 (36) |
101 (38) |
107 (42) |
104 (40) |
102 (39) |
93 (34) |
83 (28) |
75 (24) |
107 (42) |
| Mean maximum °F (°C) | 58.6 (14.8) |
60.1 (15.6) |
70.5 (21.4) |
81.2 (27.3) |
88.5 (31.4) |
93.4 (34.1) |
96.6 (35.9) |
94.4 (34.7) |
88.8 (31.6) |
79.7 (26.5) |
71.1 (21.7) |
62.1 (16.7) |
98.1 (36.7) |
| Mean daily maximum °F (°C) | 39.3 (4.1) |
42.2 (5.7) |
49.8 (9.9) |
60.9 (16.1) |
71.2 (21.8) |
80.5 (26.9) |
85.3 (29.6) |
83.7 (28.7) |
76.3 (24.6) |
65.2 (18.4) |
54.7 (12.6) |
44.3 (6.8) |
62.9 (17.2) |
| Mean daily minimum °F (°C) | 26.6 (−3.0) |
28.5 (−1.9) |
34.6 (1.4) |
44.4 (6.9) |
53.9 (12.2) |
63.8 (17.7) |
69.5 (20.8) |
68.9 (20.5) |
61.9 (16.6) |
51.0 (10.6) |
41.8 (5.4) |
32.1 (0.1) |
48.2 (9.0) |
| Mean minimum °F (°C) | 10.0 (−12.2) |
13.5 (−10.3) |
19.7 (−6.8) |
33.8 (1.0) |
45.2 (7.3) |
54.1 (12.3) |
62.0 (16.7) |
60.4 (15.8) |
50.9 (10.5) |
39.9 (4.4) |
29.3 (−1.5) |
16.6 (−8.6) |
7.5 (−13.6) |
| Record low °F (°C) | −3 (−19) |
−7 (−22) |
7 (−14) |
22 (−6) |
37 (3) |
46 (8) |
56 (13) |
51 (11) |
41 (5) |
30 (−1) |
17 (−8) |
−2 (−19) |
−7 (−22) |
| Average precipitation inches (mm) | 3.17 (81) |
2.76 (70) |
3.97 (101) |
4.00 (102) |
3.79 (96) |
3.94 (100) |
4.50 (114) |
4.12 (105) |
3.73 (95) |
3.78 (96) |
3.41 (87) |
3.56 (90) |
44.73 (1,136) |
| Average snowfall inches (cm) | 7.4 (19) |
9.1 (23) |
4.4 (11) |
0.5 (1.3) |
0 (0) |
0 (0) |
0 (0) |
0 (0) |
0 (0) |
0 (0) |
0.3 (0.76) |
5.2 (13) |
26.9 (68.06) |
| Average precipitation days (≥ 0.01 inch) | 10.3 | 9.6 | 10.7 | 10.9 | 11.1 | 10.5 | 9.9 | 8.7 | 8.1 | 8.5 | 9.2 | 10.5 | 118.0 |
| Average snowy days (≥ 0.1 inch) | 4.6 | 3.4 | 2.1 | 0.2 | 0 | 0 | 0 | 0 | 0 | 0 | 0.2 | 2.6 | 13.1 |
| Average relative humidity (%) | 61.0 | 60.2 | 59.5 | 59.3 | 63.8 | 64.6 | 64.7 | 67.0 | 67.2 | 65.2 | 64.2 | 63.5 | 63.4 |
| Source: NOAA (relative humidity 1961–1990) | |||||||||||||
| Climate data for JFK Airport, New York (1981–2010 normals, extremes 1948–present) | |||||||||||||
|---|---|---|---|---|---|---|---|---|---|---|---|---|---|
| Month | Jan | Feb | Mar | Apr | May | Jun | Jul | Aug | Sep | Oct | Nov | Dec | Year |
| Record high °F (°C) | 71 (22) |
71 (22) |
85 (29) |
90 (32) |
99 (37) |
99 (37) |
104 (40) |
101 (38) |
98 (37) |
90 (32) |
77 (25) |
75 (24) |
104 (40) |
| Mean maximum °F (°C) | 56.8 (13.8) |
57.9 (14.4) |
68.5 (20.3) |
78.1 (25.6) |
84.9 (29.4) |
92.1 (33.4) |
94.5 (34.7) |
92.7 (33.7) |
87.4 (30.8) |
78.0 (25.6) |
69.1 (20.6) |
60.1 (15.6) |
96.6 (35.9) |
| Mean daily maximum °F (°C) | 39.1 (3.9) |
41.8 (5.4) |
49.0 (9.4) |
59.0 (15.0) |
68.5 (20.3) |
78.0 (25.6) |
83.2 (28.4) |
81.9 (27.7) |
75.3 (24.1) |
64.5 (18.1) |
54.3 (12.4) |
44.0 (6.7) |
61.6 (16.4) |
| Mean daily minimum °F (°C) | 26.3 (−3.2) |
28.1 (−2.2) |
34.2 (1.2) |
43.5 (6.4) |
52.8 (11.6) |
62.8 (17.1) |
68.5 (20.3) |
67.8 (19.9) |
60.8 (16.0) |
49.6 (9.8) |
40.7 (4.8) |
31.5 (−0.3) |
47.3 (8.5) |
| Mean minimum °F (°C) | 9.8 (−12.3) |
13.4 (−10.3) |
19.1 (−7.2) |
32.6 (0.3) |
42.6 (5.9) |
52.7 (11.5) |
60.7 (15.9) |
58.6 (14.8) |
49.2 (9.6) |
37.6 (3.1) |
27.4 (−2.6) |
16.3 (−8.7) |
7.5 (−13.6) |
| Record low °F (°C) | −2 (−19) |
−2 (−19) |
4 (−16) |
20 (−7) |
34 (1) |
45 (7) |
55 (13) |
46 (8) |
40 (4) |
30 (−1) |
19 (−7) |
2 (−17) |
−2 (−19) |
| Average precipitation inches (mm) | 3.16 (80) |
2.59 (66) |
3.78 (96) |
3.87 (98) |
3.94 (100) |
3.86 (98) |
4.08 (104) |
3.68 (93) |
3.50 (89) |
3.62 (92) |
3.30 (84) |
3.39 (86) |
42.77 (1,086) |
| Average snowfall inches (cm) | 6.3 (16) |
8.3 (21) |
3.5 (8.9) |
0.8 (2.0) |
0 (0) |
0 (0) |
0 (0) |
0 (0) |
0 (0) |
0 (0) |
0.2 (0.51) |
4.7 (12) |
23.8 (60) |
| Average precipitation days (≥ 0.01 inch) | 10.5 | 9.6 | 11.0 | 11.4 | 11.5 | 10.7 | 9.4 | 8.7 | 8.1 | 8.5 | 9.4 | 10.6 | 119.4 |
| Average snowy days (≥ 0.1 inch) | 4.6 | 3.4 | 2.3 | 0.3 | 0 | 0 | 0 | 0 | 0 | 0 | 0.2 | 2.8 | 13.6 |
| Average relative humidity (%) | 64.9 | 64.4 | 63.4 | 64.1 | 69.5 | 71.5 | 71.4 | 71.7 | 71.9 | 69.1 | 67.9 | 66.3 | 68.0 |
| Source: NOAA (relative humidity 1961–1990) | |||||||||||||
| Climate data for Rochester, New York (Greater Rochester Int'l), 1981–2010 normals, extremes 1871−present | |||||||||||||
|---|---|---|---|---|---|---|---|---|---|---|---|---|---|
| Month | Jan | Feb | Mar | Apr | May | Jun | Jul | Aug | Sep | Oct | Nov | Dec | Year |
| Record high °F (°C) | 74 (23) |
73 (23) |
86 (30) |
93 (34) |
94 (34) |
100 (38) |
102 (39) |
99 (37) |
99 (37) |
91 (33) |
81 (27) |
72 (22) |
102 (39) |
| Mean daily maximum °F (°C) | 31.7 (−0.2) |
34.1 (1.2) |
42.8 (6.0) |
56.0 (13.3) |
67.6 (19.8) |
76.6 (24.8) |
81.0 (27.2) |
79.1 (26.2) |
71.6 (22.0) |
59.6 (15.3) |
48.0 (8.9) |
36.5 (2.5) |
57.1 (13.9) |
| Mean daily minimum °F (°C) | 17.6 (−8.0) |
18.6 (−7.4) |
25.8 (−3.4) |
36.6 (2.6) |
46.3 (7.9) |
55.9 (13.3) |
60.7 (15.9) |
59.5 (15.3) |
52.0 (11.1) |
41.5 (5.3) |
33.0 (0.6) |
23.5 (−4.7) |
39.3 (4.1) |
| Record low °F (°C) | −17 (−27) |
−22 (−30) |
−7 (−22) |
7 (−14) |
26 (−3) |
35 (2) |
42 (6) |
36 (2) |
28 (−2) |
19 (−7) |
1 (−17) |
−16 (−27) |
−22 (−30) |
| Average precipitation inches (mm) | 2.41 (61) |
1.95 (50) |
2.50 (64) |
2.73 (69) |
2.87 (73) |
3.34 (85) |
3.33 (85) |
3.47 (88) |
3.38 (86) |
2.72 (69) |
2.94 (75) |
2.63 (67) |
34.27 (870) |
| Average snowfall inches (cm) | 28.2 (72) |
21.5 (55) |
16.3 (41) |
3.9 (9.9) |
0.4 (1.0) |
0 (0) |
0 (0) |
0 (0) |
0 (0) |
0.1 (0.25) |
7.3 (19) |
21.8 (55) |
99.5 (253) |
| Average precipitation days (≥ 0.01 in) | 19.4 | 15.9 | 15.1 | 13.1 | 12.2 | 11.9 | 10.8 | 10.8 | 11.5 | 13.2 | 15.3 | 17.6 | 166.8 |
| Average snowy days (≥ 0.1 in) | 18.0 | 14.4 | 9.8 | 3.2 | 0.2 | 0 | 0 | 0 | 0 | 0.2 | 5.6 | 14.5 | 65.9 |
| Average relative humidity (%) | 74.0 | 74.1 | 71.0 | 67.0 | 67.2 | 69.4 | 69.7 | 74.3 | 76.8 | 74.5 | 76.3 | 77.5 | 72.6 |
| Mean monthly sunshine hours | 108.3 | 118.1 | 177.7 | 216.5 | 266.5 | 297.6 | 314.4 | 273.4 | 212.3 | 154.4 | 81.5 | 77.5 | 2,298.2 |
| Percent possible sunshine | 37 | 40 | 48 | 54 | 59 | 65 | 68 | 63 | 57 | 45 | 28 | 28 | 52 |
| Source: NOAA (relative humidity and sun 1961–1990), The Weather Channel | |||||||||||||
 | Kyle Baker |
 | Joseph Yoakum |
 | Laura Wheeler Waring |
 | Henry Ossawa Tanner |


