Grant County, Indiana facts for kids
Quick facts for kids
Grant County
|
|
|---|---|
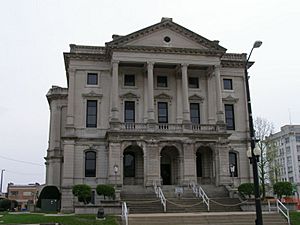
Grant County Courthouse in Marion
|
|
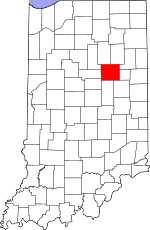
Location within the U.S. state of Indiana
|
|
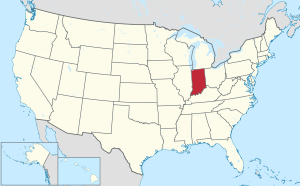 Indiana's location within the U.S. |
|
| Country | |
| State | |
| Founded | 1831 |
| Named for | Samuel and Moses Grant |
| Seat | Marion |
| Largest city | Marion |
| Area | |
| • Total | 414.90 sq mi (1,074.6 km2) |
| • Land | 414.07 sq mi (1,072.4 km2) |
| • Water | 0.82 sq mi (2.1 km2) 0.20%% |
| Population
(2020)
|
|
| • Total | 66,674 |
| • Estimate
(2023)
|
66,200 |
| • Density | 160.6990/sq mi (62.0462/km2) |
| Time zone | UTC−5 (Eastern) |
| • Summer (DST) | UTC−4 (EDT) |
| Congressional district | 5th |
| Indiana county number 27 | |
Grant County is a county located in the central part of Indiana, a state in the Midwest of the United States. In 2020, about 66,674 people lived here. The main city and county seat is Marion. Interesting discoveries of ancient animal fossils, from a time called the Pliocene epoch, have been found at a place called the Pipe Creek Sinkhole in Grant County.
Contents
History of Grant County
Grant County was officially created in 1831. It was named after two brave captains from Kentucky, Samuel and Moses Grant. They were known for being killed in a battle with Native Americans.
In 1831, two men named Martin Boots and David Branson gave 30 acres of their land each. This land was used to start a new settlement called Marion. This new town was built on the north side of a beautiful river. The Miami Indians called this river "Mississinewa," which means "laughing waters." This is how Grant County was formed, with Marion as its main city.
Geography of Grant County
Grant County covers a total area of about 414.90 square miles. Most of this area, about 414.07 square miles, is land. Only a small part, about 0.82 square miles, is water.
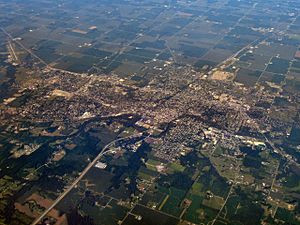
Counties Next to Grant County
Grant County shares its borders with several other counties:
- Huntington County (to the northeast)
- Wells County (to the east-northeast)
- Blackford County (to the east-southeast)
- Delaware County (to the southeast)
- Madison County (to the south)
- Tipton County (to the southwest)
- Howard County (to the west-southwest)
- Miami County (to the west-northwest)
- Wabash County (to the northwest)
Main Roads in Grant County
Many important roads run through Grant County, making it easy to travel.
Interstate Highways
 I-69
I-69
U.S. Highways
 US 35
US 35
Indiana State Roads
 SR 5
SR 5 SR 9
SR 9 SR 13
SR 13 SR 15
SR 15 SR 18
SR 18 SR 19
SR 19 SR 22
SR 22 SR 26
SR 26 SR 37
SR 37
Climate and Weather in Grant County
| Weather chart for Marion, Indiana | |||||||||||||||||||||||||||||||||||||||||||||||
|---|---|---|---|---|---|---|---|---|---|---|---|---|---|---|---|---|---|---|---|---|---|---|---|---|---|---|---|---|---|---|---|---|---|---|---|---|---|---|---|---|---|---|---|---|---|---|---|
| J | F | M | A | M | J | J | A | S | O | N | D | ||||||||||||||||||||||||||||||||||||
|
2.2
32
16
|
2
37
19
|
3
48
28
|
3.6
60
38
|
4.3
72
49
|
3.9
81
59
|
4.7
85
63
|
3.7
82
61
|
2.8
76
53
|
2.6
64
42
|
3.4
50
33
|
2.9
37
22
|
||||||||||||||||||||||||||||||||||||
| temperatures in °F precipitation totals in inches source: The Weather Channel |
|||||||||||||||||||||||||||||||||||||||||||||||
|
Metric conversion
|
|||||||||||||||||||||||||||||||||||||||||||||||
In Marion, the average temperatures change throughout the year. In January, it's usually around 16°F (about -9°C). In July, it gets warmer, with temperatures around 85°F (about 29°C). The coldest temperature ever recorded was -23°F (about -30°C) in January 1985. The hottest was 108°F (about 42°C) in July 1936.
The amount of rain and snow also changes. February usually has the least amount of precipitation, about 2.03 inches. July often has the most, with about 4.73 inches.
People of Grant County (Demographics)
| Historical population | |||
|---|---|---|---|
| Census | Pop. | %± | |
| 1840 | 4,875 | — | |
| 1850 | 11,092 | 127.5% | |
| 1860 | 15,797 | 42.4% | |
| 1870 | 18,487 | 17.0% | |
| 1880 | 23,618 | 27.8% | |
| 1890 | 31,493 | 33.3% | |
| 1900 | 54,693 | 73.7% | |
| 1910 | 51,426 | −6.0% | |
| 1920 | 51,353 | −0.1% | |
| 1930 | 51,066 | −0.6% | |
| 1940 | 55,813 | 9.3% | |
| 1950 | 62,156 | 11.4% | |
| 1960 | 75,741 | 21.9% | |
| 1970 | 83,955 | 10.8% | |
| 1980 | 80,934 | −3.6% | |
| 1990 | 74,169 | −8.4% | |
| 2000 | 73,403 | −1.0% | |
| 2010 | 70,061 | −4.6% | |
| 2020 | 66,674 | −4.8% | |
| 2023 (est.) | 66,200 | −5.5% | |
| US Decennial Census 1790-1960 1900-1990 1990-2000 2010-2013 |
|||
The population of Grant County has changed over the years. In 2020, there were 66,674 people living here.
Who Lives in Grant County? (2020 Census)
| Race | Number of People | Percentage |
|---|---|---|
| White (not Hispanic) | 54,500 | 81.7% |
| Black or African American (not Hispanic) | 4,566 | 6.8% |
| Native American (not Hispanic) | 157 | 0.23% |
| Asian (not Hispanic) | 524 | 0.8% |
| Pacific Islander (not Hispanic) | 22 | 0.03% |
| Other/Mixed (not Hispanic) | 3,493 | 5.2% |
| Hispanic or Latino | 3,412 | 5% |
More About the People (2010 Census)
In 2010, there were 70,061 people living in Grant County. There were 27,245 households (groups of people living together) and 18,000 families. The population density was about 169 people per square mile.
Most people in the county were white (88.2%). Other groups included black or African American (7.0%), Asian (0.6%), and American Indian (0.3%). About 3.6% of the population was of Hispanic or Latino background. Many people had German (19.5%), American (12.4%), Irish (10.0%), or English (9.0%) ancestry.
The average age of people in Grant County was 39.5 years old.
Towns and Cities in Grant County
Grant County has several cities and towns where people live.
Cities
Towns
Census-Designated Places
These are areas that are like towns but are not officially incorporated as cities or towns.
Other Unincorporated Places
Townships
Grant County is divided into smaller areas called townships:
- Center
- Fairmount
- Franklin
- Green
- Jefferson
- Liberty
- Mill
- Monroe
- Pleasant
- Richland
- Sims
- Van Buren
- Washington
Education in Grant County
Children in Grant County attend schools that are part of different school districts:
- Eastbrook Community School Corporation
- Madison-Grant United School Corporation
- Marion Community Schools
- Mississinewa Community School Corporation
- Oak Hill United School Corporation
See also
 In Spanish: Condado de Grant (Indiana) para niños
 | James Van Der Zee |
 | Alma Thomas |
 | Ellis Wilson |
 | Margaret Taylor-Burroughs |

