
Hubbert peak theory facts for kids

The Hubbert peak theory is an idea about how we use natural resources like oil. It says that for any area, from a single oil field to the whole planet, the amount of oil we can produce over time usually follows a bell-shaped curve. This theory is one of the main ideas when people talk about peak oil.
Imagine a hill:
- At first, production goes up as we find more oil and build more ways to get it out.
- Then, it reaches a top point, which is the "peak." This is when we're producing the most oil.
- After the peak, production starts to go down because there's less oil left to find easily.
This idea is named after M. King Hubbert, an American scientist who studied the Earth. He noticed that the amount of oil underground is limited. So, the rate at which we discover oil, which starts fast, must eventually slow down and then drop. In the United States, oil production followed the discovery pattern after about 30-35 years.
Contents
What is Hubbert's Peak?
"Hubbert's peak" can mean when oil production reaches its highest point in a specific area. This has happened in many oil fields and regions around the world.
For example, in the main 48 states of the United States (not including Alaska and Hawaii), oil production was thought to have peaked in the early 1970s. It reached about 10.2 million barrels per day in 1970 and then went down for the next 35 years. This decline closely matched what Hubbert had predicted in the mid-1950s.
However, starting in the mid-2000s, new ways to get oil, like tight oil and unconventional oil, caused U.S. oil production to go up a lot. This meant the actual production didn't follow Hubbert's original prediction for the whole country anymore. In November 2017, the United States produced over 10 million barrels of oil per day again, for the first time since 1970.
When people say "Peak oil" (with capital letters) or "Hubbert's peak" more generally, they are often talking about the idea that the entire planet's oil production will reach a peak. According to the Hubbert Peak Theory, after this global peak, the amount of oil we produce on Earth would start to decline for good.
In 1956, Hubbert correctly predicted that oil production from regular sources in the continental U.S. would peak around 1965–1970. He also thought that worldwide oil production would peak about "half a century" later. In 1976, he added that actions by OPEC (countries that export oil) might delay the global peak by about 10 years. But, new technologies have given us access to huge amounts of unconventional oil, which has changed Hubbert's global prediction a lot.
Understanding Hubbert's Theory
The Hubbert Curve


In 1956, Hubbert suggested that the production of fossil fuels (like oil, coal, and natural gas) in a certain area would generally follow a bell-shaped curve over time. He later used a specific curve, called the Hubbert curve, to guess future production based on past discoveries.
Hubbert thought that after fossil fuels are found, production would first grow quickly. This happens as more ways to get the fuel out are set up and better equipment is used. At some point, the highest amount of fuel is produced. After that, production starts to drop until it declines steadily.
The Hubbert curve shows these changes. It's also symmetrical, meaning the peak of production happens when about half of the total fossil fuel that will ever be produced has already been taken out. It also has only one peak.
By looking at past oil discovery and production information, a Hubbert curve can be drawn to guess future production. This can help estimate when oil production might peak or how much oil will eventually be produced in total.
The Hubbert equation assumes that oil production is the same on both sides of the peak (it's symmetrical). However, some other scientists have used slightly different equations that are not symmetrical, which might fit real-world production data better.
Using Many Curves
Sometimes, new technologies, like hydraulic fracturing (fracking), allow us to get oil from places that weren't productive before. When this happens, it can create a need to use the sum of multiple Hubbert curves. This is a technique Hubbert himself didn't develop. These new technologies are limited, but they can greatly boost production. This means a new curve might need to be added to the old one, and the overall prediction needs to be updated.
How Accurate is the Theory?
Crude Oil

In his 1956 paper, Hubbert gave two possible ideas for U.S. crude oil production:
- His most likely guess was that production would peak in 1965.
- His highest guess, which he thought was very hopeful, was that production would peak in 1970.
Hubbert's highest guess was quite accurate in predicting that U.S. oil production would peak in 1970. However, the actual peak was higher than his curve predicted. Production did decline as he thought, and it stayed close to his predicted value from 1974 to 1994. But since then, actual production has been much higher than the Hubbert curve. This is because new technologies have opened up access to large amounts of unconventional oil, which changed Hubbert's prediction significantly.
Hubbert's early predictions relied on guesses about how much oil could ultimately be recovered. But he wasn't happy with how uncertain this made his work. So, starting in 1962, he began making his calculations based only on mathematical analysis of how much oil was being produced, how much was known to be in reserves, and new discoveries. He didn't use geological guesses anymore. He concluded that the main 48 states of the U.S. had about 170 billion barrels of oil that could be recovered, and that production would peak in 1966 or 1967. He believed that his model already included past technological improvements, so future ones would happen at the same rate.
A study that looked at oil wells, fields, regions, and countries after they had peaked found that Hubbert's model was the "most widely useful" for matching the data. However, many areas had a sharper peak than the model predicted.
A 2007 study from the UK Energy Research Centre said there's no strong reason to assume oil production will always follow a logistic (bell-shaped) curve. They also said there's no reason to think the peak will happen when half of the oil has been produced. In fact, real-world evidence seems to show this isn't true. A study of 55 countries that had passed their oil peak found that the average peak happened when only about 25 percent of the total recoverable oil had been produced.
Natural Gas

Hubbert also thought that natural gas production would follow a similar curve to oil. The graph shows what he predicted for natural gas production in the United States in 1962 (in red) compared to what actually happened (in blue).
Money and Energy
Energy Return on Energy Investment
The idea of Energy Return on Energy Investment (EROEI) looks at how much energy you get out compared to how much energy you put in to get it. If the EROEI drops to one, it means you're using as much energy to get the oil as the oil itself provides. At that point, oil production isn't a net source of energy anymore.
It's important to remember that a barrel of oil is a measure of oil, while a barrel of oil equivalent (BOE) is a measure of energy. Many energy sources, like nuclear, solar, wind, and coal, don't have the same short-term supply limits as oil. So, even if it takes a lot of energy to get oil, it can still be useful if the energy needed to produce it comes from a cheap and plentiful source. For example, cheap natural gas is sometimes used to power methods that help extract more oil. Also, large amounts of natural gas are used to power most Athabasca tar sands plants.
In the United States, the amount of oil and gas produced per unit of effort has actually increased in recent years. As of 2017, there has been a decade-long rise in how much oil and gas can be drilled in major areas. For example, in North Dakota's Bakken Shale, the amount of oil produced per day of drilling in January 2017 was 4 times higher than five years before, and almost 10 times higher than ten years before.
Economic Models and Growth
If economic growth depends on using more and more oil, then societies after "peak oil" might need to change. Hubbert believed that for the last two centuries, we've only known constant growth, and our culture has become very dependent on it. He thought we might struggle with problems when growth stops.
Some economists say this is "uneconomic growth" or a "false economy." Brief oil shortages in 1973 and 1979 slowed down, but didn't stop, the growth of the world's economy.
Between 1950 and 1984, the "Green Revolution" changed farming worldwide, and grain production increased by 250%. The energy for this revolution came from fossil fuels used for fertilizers (from natural gas), pesticides (from oil), and hydrocarbon-fueled irrigation.
Some studies suggest that if the world population continues to grow without changes, we could face farming problems. For example, a 2003 study suggested that the U.S. population for a sustainable economy should be around 200 million (it was about 290 million then, and 329 million in 2019). This study predicted an agricultural crisis starting around 2020, becoming serious by 2050. The peaking of global oil and the decline in natural gas might make this crisis happen sooner. Some experts claim that the coming decades could see very high food prices and widespread hunger.
Other Hubbert Peaks
While the Hubbert peak theory is mostly talked about for oil, it has also been used for other natural resources.
Natural Gas
Some experts predicted that natural gas production in North America would peak around 2007. Others thought that worldwide conventional gas production would start to decline around 2020.
Coal
Even though many believe that coal will last much longer than oil, Hubbert studied a specific type of coal called anthracite in the U.S. Its production peaked in the 1920s and closely matched a Hubbert curve. Hubbert estimated that worldwide coal reserves were huge and would peak around 2150, depending on how much was used.
More recent estimates suggest an earlier peak for coal. A 2007 report by the Energy Watch Group suggested that global coal production could peak in as little as 15 years. It's also noted that the peak in the energy we get from coal might happen sooner than the peak in the amount of coal (tons per year) we dig up, because the most energy-rich types of coal are mined first.
Fissionable Materials
In 1956, Hubbert looked at U.S. nuclear fuel reserves and said that if humanity could solve its international problems and control population growth, nuclear power could provide enough energy for at least the next few centuries.
As of 2015, there's enough identified uranium to last more than 135 years at the current rate of use. Technologies like the thorium fuel cycle, reprocessing, and fast breeders could, in theory, make uranium reserves last for thousands of years.
However, some scientists point out that if we tried to replace all fossil fuels with nuclear power, we would need to build a huge number of power plants. At that rate, known uranium reserves would only last 10 to 20 years. While breeding plutonium could extend this, it also involves handling very dangerous materials.
Helium

Almost all helium on Earth comes from the natural breakdown of uranium and thorium. Helium is taken out of natural gas, which can contain up to 7% helium. The biggest helium-rich natural gas fields are in the United States, especially in Kansas, Oklahoma, and Texas. The helium is stored underground in the National Helium Reserve near Amarillo, Texas. Helium production is expected to go down as natural gas production in these areas declines.
Helium is the second-lightest chemical element. It rises to the top layers of Earth's atmosphere and can escape into space forever. About 1,600 tons of helium are lost each year this way.
Transition Metals
Hubbert also applied his theory to rocks with high amounts of certain metals. He thought that the peak production for metals like copper, tin, lead, and zinc would happen within a few decades, and iron within two centuries, similar to coal. The price of copper went up 500% between 2003 and 2007, and some people thought this was due to peak copper. However, copper prices later fell as demand dropped because of fears of a global economic slowdown.
Precious Metals
In 2009, the head of a major gold company said that global gold output had been falling since 2000. He believed that we might already be at "peak gold" because it's getting harder to find gold ore. The quality of gold ore has also dropped a lot. For example, in the U.S., Canada, and Australia, ore grades fell from about 12 grams per tonne in 1950 to closer to 3 grams. South Africa's gold output has halved since its peak in 1970.
However, world gold production from mines has peaked four times since 1900: in 1912, 1940, 1971, and 2001. Each peak was higher than the last. After 2001, production declined for several years but started to increase again in 2009 due to high gold prices. It reached new record highs in 2012, 2013, and 2014.
Phosphorus
Phosphorus is very important for farming. Estimates suggest that phosphorus reserves could run out in 60 to 130 years. A 2008 study estimated total phosphorus reserves at about 3,200 million tons, with peak production around 2034. Supplies vary greatly by country. Without recycling, America's supply is estimated to last about 30 years. The increasing price and scarcity of phosphorus could change farming practices worldwide.
Wood
Unlike fossil fuels, forests can grow back. So, the Hubbert peak theory doesn't apply to wood in the same way. There have been wood shortages in the past in some regions, but no global "peak wood" yet. However, deforestation can cause other problems like soil erosion and drought.
Water
Hubbert's original idea didn't apply to resources that can be renewed. But if we use a resource faster than it can be replaced, it can still lead to a Hubbert peak. This modified Hubbert curve applies to any resource that can be harvested quicker than it can be refilled.
For example, underground water sources like the Ogallala Aquifer can be used up much faster than they are refilled by rain. This makes much of the world's underground water and lakes into limited resources, leading to debates about "peak water" similar to "peak oil." These discussions often focus on water use for farming and homes, but generating electricity and mining for oil (like tar sands) also use a lot of water.
Fishing
Peak fish: Some researchers have tried to apply Hubbert's ideas to the whaling industry and to how the price of caviar depends on how many sturgeon fish are left. The Atlantic northwest cod fishery was a renewable resource, but too many fish were caught, more than the fish could reproduce. The end of this cod fishery does match the sharp drop of the Hubbert bell curve. Another example is the cod in the North Sea.
Air/Oxygen
Half of the world's oxygen is made by tiny ocean plants called phytoplankton. It was once thought that plankton had dropped by 40% since the 1950s. However, later studies with better measurements found that plankton abundance globally dropped by only a small percentage over that time.
Arguments Against Peak Oil
Some economists, like Michael Lynch, argue that the Hubbert curve theory is too simple. Lynch claims that predictions for world oil production are often too low, and that some experts have repeatedly pushed back the date for peak oil.
Leonardo Maugeri, from an Italian energy company, says that most peak oil estimates don't include unconventional oil. He points out that these resources are significant, and the costs to get them out are falling because of better technology. He also notes that we can now get more oil from existing fields than before, thanks to new technology. The ratio of known oil reserves to current production has actually improved over time. These improvements happened even when there wasn't much money invested in finding new oil or upgrading technology, because oil prices were low for a long time. However, Maugeri believes that encouraging more exploration will need higher oil prices.
Edward Luttwak, an economist, claims that problems in countries like Russia, Iran, and Iraq have led to a huge underestimate of oil reserves. However, the Association for the Study of Peak Oil and Gas (ASPO) says that Russia and Iran are not currently troubled by unrest, but Iraq is.
Cambridge Energy Research Associates (CERA) also criticized predictions based on Hubbert's ideas. They said that Hubbert's method doesn't consider new technology, business factors, or how world politics affect production. They believe that the idea of an immediate peak is wrong. CERA doesn't think there will be an endless supply of oil, but they expect global production to stay at a high level for a decade or more before slowly declining.
Arguments Against Peak Element Scenarios
M. King Hubbert himself made a clear difference between the decline in oil production and the supply of elements like uranium and thorium. However, some others have predicted peaks for things like peak uranium and peak phosphorus soon, based on published reserve numbers compared to current and future production.
But some economists argue that the amount of "proved reserves" listed at any one time is not a good way to guess the total future supply of a mineral. For example, the production of tin, copper, iron, lead, and zinc from 1950 to 2000, and their reserves in 2000, were much larger than the world reserves in 1950. This shows that "proved reserves" are more like a store's inventory at a certain time, and don't really show the total amount that can be affordably extracted in the future.
Images for kids
-

Oil imports by country before 2006
-
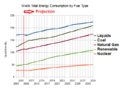
World energy consumption & predictions, 2005–2035. Source: International Energy Outlook 2011.


See also
 In Spanish: Teoría del pico de Hubbert para niños
- Abiogenic petroleum origin
- Decline curve analysis
- Food security
- Hirsch report on peak oil
- Kuznets curve
- Limits to Growth
- Low-carbon economy
- Olduvai theory
- Peak wheat
- Reserves-to-production ratio
- Sustainable agriculture
- Transport energy futures: long-term oil supply trends and projections
