Japanese yen facts for kids
Quick facts for kids Japanese yen |
|||||
|---|---|---|---|---|---|
|
|||||
| ISO 4217 Code | JPY | ||||
| User(s) | Japan | ||||
| Inflation | 3.5% (May 2025) | ||||
| Source | Statistics Bureau of Japan | ||||
| Subunit | |||||
| – | None (since 1953) | ||||
| 1⁄100 | Sen (銭) (before 1953) | ||||
| Symbol | ¥ | ||||
| Plural | The language(s) of this currency does not have a morphological plural distinction. | ||||
| Coins | |||||
| Freq. used | ¥1, ¥5, ¥10, ¥50, ¥100, ¥500 | ||||
| Banknotes | |||||
| Freq. used | ¥1,000, ¥5,000, ¥10,000 | ||||
| Rarely used | ¥2,000 | ||||
| Printer | National Printing Bureau | ||||
The yen (円 (Hepburn: symbol: ¥; code: JPY)) is the official currency of Japan. It is the third most traded money in the world's money markets. Only the United States dollar and the euro are traded more. Many countries also keep yen as a third important reserve currency, after the US dollar and the euro.
In 1871, Japan created its modern money system. The yen was set to be worth a certain amount of gold or silver. It was also divided into 100 sen or 1,000 rin. The yen replaced older Japanese money and paper currencies from different areas. The Bank of Japan started in 1882. It was the only bank allowed to control how much money was in circulation.
After World War II, the yen lost a lot of its value. Japan faced many debts and very high prices. Under a system called Bretton Woods, the yen's value was linked to the US dollar. This system ended in 1971. After that, the yen's value was temporarily fixed again. However, since February 1973, the yen has been a floating currency. This means its value changes based on what people are willing to pay for it.
The Ministry of Finance and the Bank of Japan sometimes step in to control the yen's value. They did this from 1998 to 2003 and from 2010 to 2011 to stop the yen from getting too strong. They also stepped in during 2022 and 2024 to stop it from getting too weak. The IMF has said that Japan wants its currency to change freely.
Contents
- Understanding the Yen's Name
- History of the Yen
- Early Days of the Yen (1868–1876)
- Challenges and the Bank of Japan (1877–1887)
- Yen's Fixed Value to the US Dollar
- Yen Becomes a Floating Currency
- Yen in Okinawa
- Government Actions in the Money Market
- Yen in the Early 1980s
- The Plaza Accord's Impact
- After the Economic Bubble
- After the 2008 Global Crisis
- Recent Global Inflation (2022 onwards)
- Ideas for New Yen Units
- Coins of Japan
- Japanese Banknotes
- What Makes the Yen's Value Change?
- Yen as a World Reserve Currency
- Historical Exchange Rates
- See also
Understanding the Yen's Name
The name yen comes from the Japanese word 圓 (en, [eɴ]; lit. round). This word sounds like the Chinese word for "round." Long ago, Chinese traders used round silver coins. When Spanish and Mexican silver coins arrived, the Chinese called them "silver rounds." These coins and their name came to Japan. The Japanese kept using the word, which later became 円 after World War II.
The spelling "yen" in English comes from how Japanese sounds were heard long ago. In the 16th century, some Japanese sounds were pronounced like "ye." So, early European visitors spelled them that way. Later, a dictionary published in 1867 by James Curtis Hepburn used "yen." This spelling became common in English.
History of the Yen
Early Days of the Yen (1868–1876)
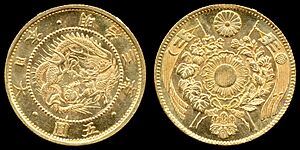
After the old Japanese government ended in 1868, there was confusion about money. Different parts of Japan used different money systems. Emperor Meiji wanted to fix this. He asked Ōkuma Shigenobu to lead a money reform program. They decided to make coins round instead of square. They also combined the old money names into "yen" (円).
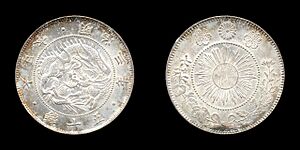
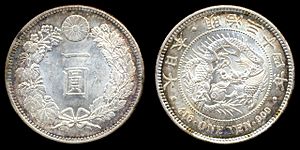
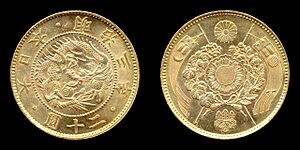
The first gold yen coins were made in 1870. These were 2, 5, and 20 yen coins. The San Francisco Mint in the US made some of the first 5 yen coins for Japan. A new mint was built in Osaka, Japan, and started making silver coins in 1870. These included 5, 10, 20, and 50 sen coins. On June 27, 1871, the Japanese government officially made the "yen" its modern money. The new system used yen, sen (1/100 of a yen), and rin (1/1,000 of a yen).
Paper money, called Meiji Tsuho notes, also started in 1872. These were 1, 2, 5, 10, 50, and 100 yen notes. The government also set up national banks that printed their own notes.
Challenges and the Bank of Japan (1877–1887)
A rebellion in 1877 caused a lot of inflation, meaning money lost its value quickly. The government stopped printing national banknotes in 1880. New rules were put in place, and a central bank was created. The Bank of Japan started on October 10, 1882. It was given the power to print banknotes that could be exchanged for older notes. By 1899, national bank notes were no longer used. In that year, Japan linked the yen to gold. One yen was worth 0.75 grams of pure gold.
This link to gold lasted until December 1931. After that, the yen's value dropped. The sen and rin coins were no longer used after 1953.
Yen's Fixed Value to the US Dollar
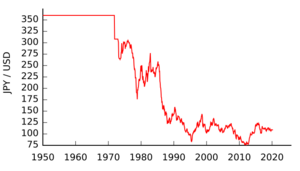
From 1941 to 1949, there was no real exchange rate for the yen. Prices went up a lot during and after the war. On April 25, 1949, the US government set the yen's value at ¥360 for every US dollar. This was part of a plan to make Japan's economy stable.
This fixed rate stayed until 1971. Then, the US stopped linking its dollar to gold. This led to changes that eventually allowed currencies to float freely in 1973.
Yen Becomes a Floating Currency
By 1971, the yen was considered undervalued. Japanese products were too cheap for other countries to buy. This meant Japan was selling much more than it was buying. The US took action to change the dollar's value. Japan agreed to a new fixed rate of ¥308 per US dollar. But this new rate was hard to keep. In early 1973, the fixed rates were stopped, and major countries let their currencies float.
Yen in Okinawa
After World War II, the US controlled Okinawa. They used a different currency there called the B yen. Later, the US dollar replaced it. When Okinawa became part of Japan again in 1972, the Japanese yen replaced the dollar.
Government Actions in the Money Market
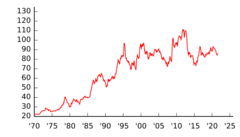
In the 1970s, Japan's government worried that a stronger yen would hurt exports. So, they often bought or sold US dollars to influence the yen's value. Even with these actions, the yen's value kept rising. It reached ¥211 per US dollar in 1978. But then, the second oil crisis caused the yen to drop again.
Yen in the Early 1980s
In the early 1980s, the yen did not get stronger, even though Japan was selling more goods than it bought. This was because interest rates in the US were much higher than in Japan. Japanese investors sent their money overseas to earn more. This kept the yen weak.
The Plaza Accord's Impact
In 1985, a big change happened. Leaders from major countries signed the Plaza Accord. They agreed that the dollar was too strong and the yen was too weak. This agreement caused the yen's value to rise quickly. From ¥239 per US dollar in 1985, it almost doubled to ¥128 in 1988. In April 1995, the yen reached its strongest point, under 80 yen per US dollar.
After the Economic Bubble
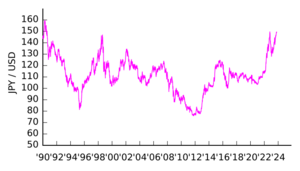
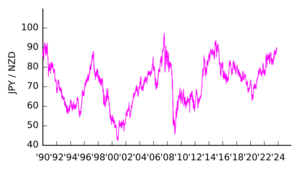
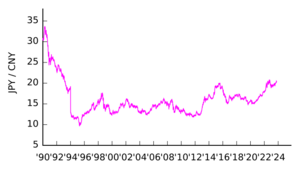
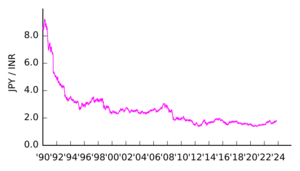
The yen's value went down after Japan's economic bubble burst in the 1990s. It reached a low of ¥134 per US dollar in 2002. The Bank of Japan kept interest rates very low to help the economy. This made it less attractive to keep yen. Investors would borrow yen and invest in other currencies that offered higher returns. This practice is called a "carry trade." It helped keep the yen's value low.
After the 2008 Global Crisis
After the global economic crisis of 2008, the yen started to get stronger compared to most other major currencies.
In April 2013, the Bank of Japan announced a plan to increase the money supply. They wanted to bring Japan out of deflation (when prices fall) and aim for 2% inflation (when prices rise). This action made some people worry that Japan was trying to make the yen weaker to boost exports. However, businesses in Japan worried that a weaker yen would make imported goods, like energy, more expensive.
Recent Global Inflation (2022 onwards)
Since 2022, the yen has become much weaker compared to other currencies. This is because Japan has kept its interest rates very low to fight deflation. Other countries, like the US, raised their interest rates to fight inflation. This difference in interest rates made investors want to put their money in countries with higher returns. This is a big reason why the yen's value has dropped. The Bank of Japan has tried to help by buying yen and selling dollars in 2022 and 2024.
Ideas for New Yen Units
Since the 1990s, there have been ideas to change the yen's value. One idea was to create a "new yen" worth 100 old yen, which would be close to one US dollar. This has not happened because the yen is still trusted worldwide. Also, it would cost a lot to print new money and update all the machines that read money.
Coins of Japan
The Japan Mint has been making coins since 1871.
Coins You Can Use Today
| Coins presently minted | |||||||||
|---|---|---|---|---|---|---|---|---|---|
| Value | Image | Technical parameters | Description | Date of first minting | |||||
| Diameter | Thickness | Mass | Composition | Edge | Obverse | Reverse | |||
| ¥1 |  |
20 mm | 1.5 mm | 1 g | 100% aluminium | Smooth | Young tree, state title, value | Value, year of minting | 1955 |
| ¥5 |  |
22 mm | 1.5 mm | 3.75 g | 60–70% copper 30–40% zinc |
Smooth | Ear of Rice, gear, water, value | State title, year of minting | 1949 (rarely) |
| 1959 | |||||||||
| ¥10 |  |
23.5 mm | 1.5 mm | 4.5 g | 95% copper 3–4% zinc 1–2% tin |
Reeded | Phoenix Hall, Byōdō-in, state title, value | Evergreen tree, value, year of minting | 1951 (rarely) |
| Smooth | 1959 | ||||||||
| ¥50 |  |
21 mm | 1.7 mm | 4 g | Cupronickel 75% copper 25% nickel |
Reeded | Chrysanthemum, state title, value | Value, year of minting | 1967 |
| ¥100 |  |
22.6 mm | 1.7 mm | 4.8 g | Cupronickel 75% copper 25% nickel |
Reeded | Cherry blossoms, state title, value | Value, year of minting | 1967 |
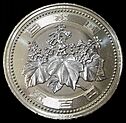
| ¥500 |  |
26.5 mm | 1.81 mm | 7.1 g | Bi-metallic (75% copper 12.5% zinc 12.5% nickel) |
Reeded helically | Paulownia, state title, value | Bamboo, Mandarin orange, Value, year of minting | 2021 |
| These images are to scale at 2.5 pixels per millimetre. For table standards, see the coin specification table. | |||||||||
The front side of all coins shows the coin's value in Japanese characters. It also shows the country name. The back side shows the year the coin was made. This year is based on the current emperor's reign, not the regular calendar year. For example, coins made in 2020 show the year Reiwa 2. This is the 2nd year of Emperor Naruhito's reign. Japanese coins never show pictures of the emperor.
After World War II, new coins were made. These included brass 50 sen, 1, and 5 yen coins. The current 5 yen coin with a hole was made in 1949. The bronze 10 yen coin came in 1951, and the aluminum 1 yen coin in 1955.
In 1955, the first 50 yen coin without a hole was made from nickel. In 1957, silver 100 yen coins were introduced. These were replaced in 1967 by the current 100 yen coin and a smaller 50 yen coin.
In 1982, the first 500 yen coin was made. The 500 yen coin is one of the highest-valued coins used regularly in the world. Because it is worth so much, it has been a target for fake coins. So, in 2000, a new 500 yen coin was made with better security features. Even with that, more fake coins appeared. So, in 2021, a third 500 yen coin was made with even more security.
Japanese coins are easy to tell apart. They have different styles, sizes, weights, and patterns on their edges.
| No Hole | With Hole | |
|---|---|---|
| Smooth edge | ¥1 (light) ¥10 (medium) |
¥5 |
| Reeded edge | ¥100 (medium) ¥500 (heavy) |
¥50 |
Special commemorative coins have also been made for different events. These are made from regular metals, silver, and gold. The first were silver ¥100 and ¥1,000 coins for the 1964 Olympic Games. The largest was a ¥100,000 gold coin for the 60th anniversary of the Shōwa Emperor in 1986. Even though these coins can be used like regular money, they usually do not circulate.
The 1 yen coin is made of 100% aluminum. If you place it carefully, it can float on water!
Older Coins No Longer Used
Sen Coins
Smaller coins called "sen" (one hundredth of a yen) were first made in 1870. These included 5, 10, 20, and 50 sen coins made of silver. Copper sen coins (half, 1, and 2 sen) came later. Over time, silver was removed from sen coins. During World War II, different metals were used for 1, 5, and 10 sen coins. Some clay 5 and 10 sen coins were made in 1945, but they were never used. Like the Rin, coins worth less than 1 yen were no longer valid after 1953 because of inflation.
Rin Coins
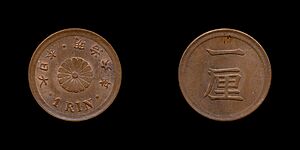
Bronze coins called "rin" (one thousandth of a yen) were first made in 1873. One rin coins were very small. They were not popular and were stopped in 1884. Five rin coins were also made of bronze. These were made for a short time because of rising prices during World War I. Coins worth 1 and 5 rin were officially stopped at the end of 1953.
Japanese Banknotes
| Value | Image | Dimensions | Main
Color |
Description | Date of issue | Issue suspended | ||
|---|---|---|---|---|---|---|---|---|
| Obverse | Reverse | Obverse | Reverse | |||||
| Series F | ||||||||
| ¥1000 | 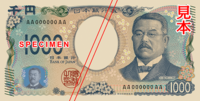 |
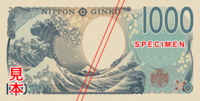 |
150 × 76 mm | Blue | Kitasato Shibasaburō | The Great Wave off Kanagawa (from Thirty-six Views of Mount Fuji series by Hokusai) | 3 July 2024 | |
| ¥5000 |  |
 |
156 × 76 mm | Purple | Umeko Tsuda | Wisteria flowers | ||
| ¥10,000 |  |
 |
160 × 76 mm | Brown | Shibusawa Eiichi | Tokyo Station (Marunouchi side) | ||
| Series E | ||||||||
| ¥1000 | 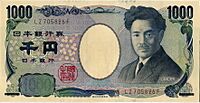 |
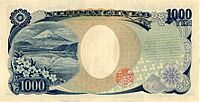 |
150 × 76 mm | Blue | Hideyo Noguchi | Mount Fuji, Lake Motosu and cherry blossoms | 1 November 2004 | 2025 - 2027 |
| ¥5000 |  |
 |
156 × 76 mm | Purple | Ichiyō Higuchi | Kakitsubata-zu (Painting of irises, a work by Ogata Kōrin) | ||
| ¥10,000 |  |
 |
160 × 76 mm | Brown | Fukuzawa Yukichi | Statue of hōō (phoenix) from Byōdō-in Temple | ||
| Series D | ||||||||
| ¥2000 |  |
 |
154 × 76 mm | Green | Shureimon | The Tale of Genji and portrait of Murasaki Shikibu | 19 July 2000 | |
Yen banknotes started in 1872. Their values have ranged from 1 yen to 10,000 yen. Since 1984, the smallest banknote is the 1,000 yen note. Before and during World War II, different groups printed yen banknotes. Since then, the Bank of Japan has been the only one to print them.
Japan is a society that uses a lot of cash. In 2014, 38% of payments were made with cash. People might prefer cash because it protects their privacy. Also, merchants get paid right away.
Today, Japanese banknotes feature portraits of people from the Meiji period (1868-1912) or later. This is because it is easier to prevent fake money when using clear photographs for the portraits.
Series E banknotes were introduced in 2004. These included ¥1000, ¥5000, and ¥10,000 notes.
New Series F banknotes were introduced on July 3, 2024. The ¥1000 bill features Kitasato Shibasaburō and The Great Wave off Kanagawa. The ¥5000 bill features Tsuda Umeko and Wisteria flowers. The ¥10,000 bill features Shibusawa Eiichi and Tokyo Station. The ¥2000 note was not redesigned because it is not used very often.
What Makes the Yen's Value Change?
Since December 1931, Japan has managed its currency system. The yen's value changes in money markets based on supply and demand. When people want to exchange yen for other currencies to buy goods or services, it increases the supply of yen. When foreigners want to buy things in Japan or invest there, it increases the demand for yen.
Since the 1990s, the Bank of Japan has kept interest rates low to help the economy grow. Low interest rates and low inflation made investors borrow yen in Japan. Then, they would invest that money in other countries with higher interest rates. This is called a "carry trade." This practice helped keep the yen's value low compared to other currencies, especially the US dollar.
Yen as a World Reserve Currency
The special drawing rights (SDR) is a special currency used by the IMF. It includes the world's main reserve currencies, like the Japanese yen. The yen's share in this group has gone down over the years.
Historical Exchange Rates
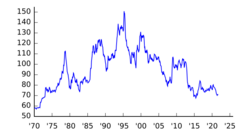
Before World War II, one US dollar was worth about 3.6 yen. After the war, the yen's value dropped a lot. It went as low as 600 yen per US dollar in 1947. This was because too much money was printed to pay for the war and then for rebuilding.
When US forces entered Japan in 1945, they set an official rate of 15 yen to the US dollar. But because of inflation, the rate quickly dropped to 50 yen to the dollar. By 1947, it was 600 yen to the dollar. The rate was officially changed to 270 yen to the dollar in 1948. Then, from 1949 to 1971, it was fixed at 360 yen to the dollar.
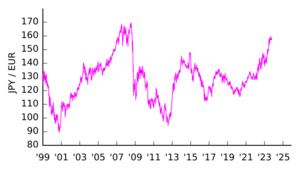
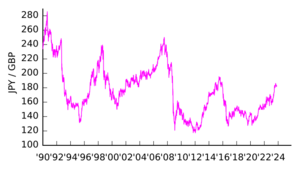
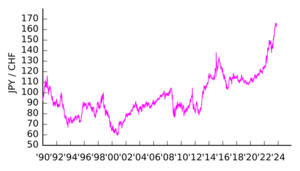
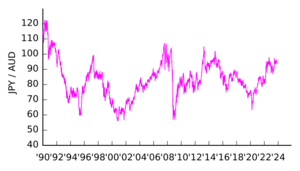
Since 2022, the yen has become weaker against the dollar. By July 2024, the price fell to over ¥161 per US dollar. This was the lowest exchange rate for the yen in over 37 years. One main reason is that the US raised its interest rates, while Japan kept its rates very low. Other reasons include the strong US economy and its job market. Japan's economy has been slower to recover to its pre-pandemic size. Also, Japan's trade balance has been negative, meaning it imports more than it exports. Experts expect the yen to remain weak.
Average Monthly Exchange Rates (Yen per US Dollar)
The table below shows the average monthly exchange rate of the US dollar to the yen. A higher number means the yen is weaker.
| Year | Month | |||||||||||
|---|---|---|---|---|---|---|---|---|---|---|---|---|
| Jan | Feb | Mar | Apr | May | Jun | Jul | Aug | Sep | Oct | Nov | Dec | |
| 1949–1971 | 360 | |||||||||||
| 1972 | 308 | |||||||||||
| 1973 | 301.15 | 270.00 | 265.83 | 265.50 | 264.95 | 265.30 | 263.45 | 265.30 | 265.70 | 266.68 | 279.00 | 280.00 |
| 1974 | 299.00 | 287.60 | 276.00 | 279.75 | 281.90 | 284.10 | 297.80 | 302.70 | 298.50 | 299.85 | 300.10 | 300.95 |
| 1975 | 297.85 | 286.60 | 293.80 | 293.30 | 291.35 | 296.35 | 297.35 | 297.90 | 302.70 | 301.80 | 303.00 | 305.15 |
| 1976 | 303.70 | 302.25 | 299.70 | 299.40 | 299.95 | 297.40 | 293.40 | 288.76 | 287.30 | 293.70 | 296.45 | 293.00 |
| 1977 | 288.25 | 283.25 | 277.30 | 277.50 | 277.30 | 266.50 | 266.30 | 267.43 | 264.50 | 250.65 | 244.20 | 240.00 |
| 1978 | 241.74 | 238.83 | 223.40 | 223.90 | 223.15 | 204.50 | 190.80 | 190.00 | 189.15 | 176.05 | 197.80 | 195.10 |
| 1979 | 201.40 | 202.35 | 209.30 | 219.15 | 219.70 | 217.00 | 216.90 | 220.05 | 223.45 | 237.80 | 249.50 | 239.90 |
| 1980 | 237.73 | 244.07 | 248.61 | 251.45 | 228.06 | 218.11 | 220.91 | 224.34 | 214.95 | 209.21 | 212.99 | 209.79 |
| 1981 | 202.19 | 205.76 | 208.84 | 215.07 | 220.78 | 224.21 | 232.11 | 233.62 | 229.83 | 231.40 | 223.76 | 219.02 |
| 1982 | 224.55 | 235.25 | 240.64 | 244.90 | 236.97 | 251.11 | 255.10 | 258.67 | 262.74 | 271.33 | 265.02 | 242.49 |
| 1983 | 232.90 | 236.27 | 237.92 | 237.70 | 234.78 | 240.06 | 240.49 | 244.36 | 242.71 | 233.00 | 235.25 | 234.34 |
| 1984 | 233.95 | 233.67 | 225.52 | 224.95 | 230.67 | 233.29 | 242.72 | 242.24 | 245.19 | 246.89 | 243.29 | 247.96 |
| 1985 | 254.11 | 260.34 | 258.43 | 251.67 | 251.57 | 248.95 | 241.70 | 237.20 | 236.91 | 214.84 | 203.85 | 202.75 |
| 1986 | 200.05 | 184.62 | 178.83 | 175.56 | 166.89 | 167.82 | 158.65 | 154.11 | 154.78 | 156.04 | 162.72 | 162.13 |
| 1987 | 154.48 | 153.49 | 151.56 | 142.96 | 140.47 | 144.52 | 150.20 | 147.57 | 143.03 | 143.48 | 135.25 | 128.25 |
| 1988 | 127.44 | 129.26 | 127.23 | 124.88 | 124.74 | 127.20 | 133.10 | 133.63 | 134.45 | 128.85 | 123.16 | 123.63 |
| 1989 | 127.24 | 127.77 | 130.35 | 132.01 | 138.40 | 143.92 | 140.63 | 141.20 | 145.06 | 141.99 | 143.55 | 143.62 |
| 1990 | 145.09 | 145.54 | 153.19 | 158.50 | 153.52 | 153.78 | 149.23 | 147.46 | 138.96 | 129.73 | 129.01 | 133.72 |
| 1991 | 133.65 | 130.44 | 137.09 | 137.15 | 138.02 | 139.83 | 137.98 | 136.85 | 134.59 | 130.81 | 129.64 | 128.07 |
| 1992 | 125.05 | 127.53 | 132.75 | 133.59 | 130.55 | 126.90 | 125.66 | 126.34 | 122.72 | 121.14 | 123.84 | 123.98 |
| 1993 | 125.02 | 120.97 | 117.02 | 112.37 | 110.23 | 107.29 | 107.77 | 103.72 | 105.27 | 106.94 | 107.81 | 109.72 |
| 1994 | 111.49 | 106.14 | 105.12 | 103.48 | 104.00 | 102.69 | 98.54 | 99.86 | 98.79 | 98.40 | 98.00 | 100.17 |
| 1995 | 99.79 | 98.23 | 90.77 | 83.53 | 85.21 | 84.54 | 87.24 | 94.56 | 100.31 | 100.68 | 101.89 | 101.86 |
| 1996 | 105.81 | 105.70 | 105.85 | 107.40 | 106.49 | 108.82 | 109.25 | 107.84 | 109.76 | 112.30 | 112.27 | 113.74 |
| 1997 | 118.18 | 123.01 | 122.66 | 125.47 | 118.91 | 114.31 | 115.10 | 117.89 | 120.74 | 121.13 | 125.35 | 129.52 |
| 1998 | 129.45 | 125.85 | 128.83 | 131.81 | 135.08 | 140.35 | 140.66 | 144.76 | 134.50 | 121.33 | 120.61 | 117.40 |
| 1999 | 113.14 | 116.73 | 119.71 | 119.66 | 122.14 | 120.81 | 119.76 | 113.30 | 107.45 | 106.00 | 104.83 | 102.61 |
| 2000 | 105.21 | 109.34 | 106.62 | 105.35 | 108.13 | 106.13 | 107.90 | 108.02 | 106.75 | 108.34 | 108.87 | 112.21 |
| 2001 | 117.10 | 116.10 | 121.21 | 123.77 | 121.83 | 122.19 | 124.63 | 121.53 | 118.91 | 121.32 | 122.33 | 127.32 |
| 2002 | 132.66 | 133.53 | 131.15 | 131.01 | 126.39 | 123.44 | 118.08 | 119.03 | 120.49 | 123.88 | 121.54 | 122.17 |
| 2003 | 118.67 | 119.29 | 118.49 | 119.82 | 117.26 | 118.27 | 118.65 | 118.81 | 115.09 | 109.58 | 109.18 | 107.87 |
| 2004 | 106.39 | 106.54 | 108.57 | 107.31 | 112.27 | 109.45 | 109.34 | 110.41 | 110.05 | 108.90 | 104.86 | 103.82 |
| 2005 | 103.27 | 104.84 | 105.30 | 107.35 | 106.94 | 108.62 | 111.94 | 110.65 | 111.03 | 114.84 | 118.45 | 118.60 |
| 2006 | 115.33 | 117.81 | 117.31 | 117.13 | 111.53 | 114.57 | 115.59 | 115.86 | 117.02 | 118.59 | 117.33 | 117.26 |
| 2007 | 120.59 | 120.49 | 117.29 | 118.81 | 120.77 | 122.64 | 121.56 | 116.74 | 115.01 | 115.77 | 111.24 | 112.28 |
| 2008 | 107.60 | 107.18 | 100.83 | 102.41 | 104.11 | 106.86 | 106.76 | 109.24 | 106.71 | 100.20 | 96.89 | 91.21 |
| 2009 | 90.35 | 92.53 | 97.83 | 98.92 | 96.43 | 96.58 | 94.49 | 94.90 | 91.40 | 90.28 | 89.11 | 89.52 |
| 2010 | 91.26 | 90.28 | 90.56 | 93.43 | 91.79 | 90.89 | 87.67 | 85.44 | 84.31 | 81.80 | 82.43 | 83.38 |
| 2011 | 82.63 | 82.52 | 81.82 | 83.34 | 81.23 | 80.49 | 79.44 | 77.09 | 76.78 | 76.72 | 77.50 | 77.81 |
| 2012 | 76.94 | 78.47 | 82.37 | 81.42 | 79.70 | 79.27 | 78.96 | 78.68 | 78.17 | 78.97 | 80.92 | 83.60 |
| 2013 | 89.15 | 93.07 | 94.73 | 97.74 | 101.01 | 97.52 | 99.66 | 97.83 | 99.30 | 97.73 | 100.04 | 103.42 |
| 2014 | 103.94 | 102.02 | 102.30 | 102.54 | 101.78 | 102.05 | 101.73 | 102.95 | 107.16 | 108.03 | 116.24 | 119.29 |
| 2015 | 118.25 | 118.59 | 120.37 | 119.57 | 120.82 | 123.7 | 123.31 | 123.17 | 120.13 | 119.99 | 122.58 | 121.78 |
| 2016 | 118.18 | 115.01 | 113.05 | 109.72 | 109.24 | 105.44 | 103.97 | 101.28 | 101.99 | 103.81 | 108.33 | 116.01 |
| 2017 | 114.69 | 113.13 | 113.02 | 110.08 | 112.24 | 110.89 | 112.50 | 109.90 | 110.67 | 112.94 | 112.89 | 112.96 |
| 2018 | 110.74 | 107.90 | 106.01 | 107.49 | 109.74 | 110.02 | 111.41 | 111.06 | 111.91 | 112.81 | 113.36 | 112.38 |
| 2019 | 108.97 | 110.36 | 111.22 | 111.63 | 109.76 | 108.07 | 108.23 | 106.34 | 107.40 | 108.12 | 108.88 | 109.18 |
| 2020 | 109.38 | 109.96 | 107.67 | 107.83 | 107.23 | 107.64 | 106.76 | 106.00 | 105.61 | 105.21 | 104.30 | 103.75 |
| 2021 | 103.79 | 105.44 | 108.81 | 109.10 | 109.17 | 110.12 | 110.26 | 109.85 | 110.15 | 113.14 | 113.99 | 113.84 |
| 2022 | 114.84 | 115.24 | 118.67 | 126.31 | 128.82 | 134.10 | 136.39 | 135.28 | 143.09 | 147.16 | 142.17 | 134.85 |
| 2023 | 130.28 | 132.69 | 133.86 | 133.40 | 137.39 | 141.33 | 141.20 | 144.73 | 147.65 | 149.59 | 149.88 | 144.09 |
| 2024 | 146.59 | 149.41 | 149.70 | 153.57 | 156.21 | 157.90 | 157.86 | 146.29 | 143.31 | 149.60 | 153.82 | 153.72 |
| 2025 | 156.42 | 152.03 | ||||||||||
| Year | Jan | Feb | Mar | Apr | May | Jun | Jul | Aug | Sep | Oct | Nov | Dec |
| Month | ||||||||||||
Average Monthly Real Exchange Rate
This table shows how strong or weak the yen was compared to other currencies. A higher number means the yen was stronger. The value of 100 is the average for 2020.
| Year | Month | |||||||||||
|---|---|---|---|---|---|---|---|---|---|---|---|---|
| Jan | Feb | Mar | Apr | May | Jun | Jul | Aug | Sep | Oct | Nov | Dec | |
| 1964 | 56.84 | 56.41 | 56.40 | 56.94 | 60.09 | 59.97 | 59.93 | 60.40 | 60.92 | 61.63 | 61.27 | 61.52 |
| 1965 | 62.61 | 62.12 | 62.28 | 63.00 | 62.54 | 62.28 | 61.91 | 62.02 | 62.89 | 63.51 | 63.10 | 63.18 |
| 1966 | 63.69 | 63.76 | 63.49 | 64.06 | 63.35 | 63.05 | 63.11 | 62.41 | 63.16 | 63.30 | 62.62 | 63.26 |
| 1967 | 63.71 | 63.74 | 63.88 | 63.89 | 62.98 | 62.56 | 62.36 | 62.51 | 63.41 | 64.36 | 64.17 | 65.34 |
| 1968 | 65.59 | 65.66 | 65.49 | 65.35 | 65.24 | 64.61 | 64.60 | 64.92 | 66.52 | 66.30 | 66.44 | 66.00 |
| 1969 | 66.01 | 65.74 | 66.05 | 66.16 | 66.24 | 65.95 | 66.34 | 66.85 | 67.54 | 66.65 | 66.60 | 66.80 |
| 1970 | 75.02 | 74.58 | 74.86 | 74.93 | 74.41 | 74.28 | 73.79 | 73.45 | 74.15 | 75.03 | 74.89 | 74.97 |
| 1971 | 74.89 | 74.71 | 74.65 | 75.43 | 75.29 | 75.25 | 75.52 | 75.14 | 80.37 | 81.83 | 81.50 | 82.60 |
| 1972 | 83.65 | 85.23 | 86.25 | 86.88 | 86.52 | 86.83 | 87.18 | 87.21 | 87.44 | 88.13 | 87.95 | 88.22 |
| 1973 | 88.43 | 93.68 | 99.43 | 99.33 | 99.69 | 97.63 | 96.06 | 96.44 | 98.40 | 96.87 | 94.10 | 96.67 |
| 1974 | 94.83 | 96.83 | 98.09 | 100.51 | 98.97 | 98.17 | 96.24 | 93.02 | 94.59 | 95.45 | 94.32 | 94.31 |
| 1975 | 94.07 | 95.36 | 96.45 | 96.57 | 96.16 | 94.88 | 95.39 | 95.41 | 96.77 | 96.54 | 95.61 | 94.70 |
| 1976 | 96.02 | 97.17 | 98.03 | 100.70 | 100.62 | 100.61 | 102.21 | 102.09 | 105.77 | 104.53 | 102.72 | 103.28 |
| 1977 | 104.31 | 106.33 | 107.79 | 110.47 | 109.90 | 110.34 | 112.03 | 110.70 | 112.16 | 117.24 | 119.79 | 119.61 |
| 1978 | 117.86 | 117.68 | 121.74 | 128.01 | 126.35 | 130.89 | 138.18 | 144.39 | 143.49 | 145.01 | 138.74 | 134.75 |
| 1979 | 132.12 | 128.56 | 124.63 | 119.48 | 118.54 | 116.75 | 116.01 | 113.13 | 110.68 | 107.59 | 100.07 | 100.74 |
| 1980 | 101.44 | 98.70 | 98.22 | 98.82 | 106.14 | 109.72 | 107.31 | 105.42 | 110.53 | 113.48 | 112.34 | 113.93 |
| 1981 | 118.07 | 117.44 | 115.05 | 112.89 | 112.33 | 111.26 | 107.35 | 106.89 | 107.79 | 105.70 | 108.10 | 110.60 |
| 1982 | 107.74 | 103.82 | 102.40 | 102.07 | 103.56 | 98.88 | 97.17 | 96.67 | 96.62 | 94.31 | 96.37 | 103.85 |
| 1983 | 107.56 | 105.95 | 106.12 | 106.47 | 108.31 | 106.33 | 105.83 | 104.67 | 106.28 | 110.38 | 109.37 | 110.31 |
| 1984 | 111.25 | 110.07 | 112.50 | 113.19 | 112.37 | 110.11 | 107.66 | 106.84 | 108.62 | 109.03 | 109.05 | 108.73 |
| 1985 | 107.09 | 105.28 | 106.41 | 106.88 | 106.86 | 107.15 | 108.57 | 109.10 | 109.93 | 119.08 | 123.62 | 123.33 |
| 1986 | 123.96 | 132.45 | 135.48 | 138.53 | 144.34 | 143.03 | 149.58 | 151.97 | 150.87 | 149.01 | 142.55 | 141.60 |
| 1987 | 143.91 | 143.51 | 144.86 | 152.72 | 153.64 | 149.13 | 142.96 | 144.92 | 148.60 | 147.75 | 152.16 | 157.69 |
| 1988 | 157.86 | 156.01 | 157.01 | 158.89 | 159.12 | 156.73 | 151.78 | 151.83 | 151.42 | 156.40 | 159.58 | 157.76 |
| 1989 | 154.20 | 152.76 | 150.37 | 149.97 | 145.10 | 140.27 | 140.84 | 140.20 | 137.70 | 139.34 | 135.86 | 133.87 |
| 1990 | 130.73 | 129.33 | 123.74 | 119.75 | 122.90 | 122.12 | 123.67 | 122.54 | 130.03 | 138.48 | 138.24 | 133.76 |
| 1991 | 133.87 | 135.15 | 132.79 | 135.39 | 135.04 | 134.32 | 135.67 | 135.35 | 136.21 | 141.27 | 140.12 | 139.57 |
| 1992 | 142.41 | 140.21 | 136.24 | 136.13 | 137.56 | 139.94 | 137.51 | 136.29 | 141.26 | 145.52 | 146.06 | 146.09 |
| 1993 | 145.07 | 151.19 | 155.81 | 160.89 | 163.44 | 169.43 | 171.59 | 178.56 | 173.69 | 170.94 | 169.99 | 166.32 |
| 1994 | 164.09 | 170.65 | 172.27 | 174.85 | 172.72 | 172.35 | 176.40 | 173.22 | 173.68 | 173.81 | 173.97 | 170.57 |
| 1995 | 169.61 | 170.38 | 182.00 | 193.97 | 191.35 | 191.26 | 184.04 | 170.97 | 161.88 | 159.48 | 157.46 | 158.02 |
| 1996 | 151.68 | 150.54 | 150.03 | 148.45 | 150.17 | 146.29 | 145.44 | 146.15 | 143.81 | 141.04 | 139.92 | 138.72 |
| 1997 | 134.34 | 129.37 | 130.53 | 129.86 | 137.50 | 142.70 | 143.14 | 141.96 | 139.71 | 140.99 | 136.38 | 137.71 |
| 1998 | 142.75 | 143.57 | 138.72 | 134.02 | 132.12 | 128.71 | 127.33 | 123.75 | 132.15 | 145.16 | 145.03 | 147.76 |
| 1999 | 152.38 | 148.27 | 146.33 | 146.37 | 143.32 | 144.92 | 145.88 | 153.60 | 163.05 | 163.66 | 165.44 | 168.50 |
| 2000 | 162.97 | 156.40 | 161.77 | 164.01 | 162.57 | 163.77 | 161.06 | 162.07 | 164.68 | 163.58 | 162.86 | 157.10 |
| 2001 | 149.26 | 149.77 | 144.39 | 142.62 | 145.00 | 145.25 | 142.37 | 144.10 | 146.64 | 144.34 | 142.90 | 137.43 |
| 2002 | 131.53 | 129.68 | 132.08 | 131.66 | 134.85 | 136.45 | 140.47 | 140.64 | 138.40 | 134.89 | 136.24 | 134.86 |
| 2003 | 135.69 | 133.74 | 134.92 | 133.37 | 134.10 | 132.29 | 132.45 | 132.98 | 136.27 | 140.96 | 140.39 | 140.47 |
| 2004 | 140.04 | 139.10 | 137.38 | 138.32 | 133.74 | 136.69 | 135.74 | 134.57 | 134.77 | 135.60 | 138.13 | 136.97 |
| 2005 | 137.34 | 133.68 | 132.80 | 130.79 | 132.12 | 130.72 | 127.03 | 126.91 | 126.30 | 122.57 | 119.18 | 118.46 |
| 2006 | 119.50 | 116.36 | 117.04 | 115.83 | 119.90 | 117.88 | 116.12 | 115.99 | 114.83 | 113.28 | 112.68 | 111.18 |
| 2007 | 108.22 | 106.54 | 109.24 | 106.57 | 104.47 | 102.38 | 101.65 | 106.90 | 107.27 | 104.61 | 107.50 | 106.21 |
| 2008 | 109.12 | 107.79 | 113.15 | 109.93 | 109.18 | 106.31 | 105.42 | 105.52 | 110.51 | 122.97 | 129.91 | 137.00 |
| 2009 | 137.51 | 136.05 | 128.82 | 125.28 | 124.95 | 123.55 | 125.77 | 124.36 | 127.70 | 127.10 | 127.82 | 126.84 |
| 2010 | 124.50 | 126.81 | 125.81 | 121.10 | 125.49 | 128.28 | 130.53 | 132.58 | 132.64 | 133.64 | 131.82 | 130.63 |
| 2011 | 129.83 | 128.13 | 128.53 | 123.86 | 126.80 | 127.55 | 128.54 | 132.20 | 134.77 | 135.86 | 133.74 | 133.98 |
| 2012 | 134.95 | 130.59 | 124.53 | 126.39 | 130.18 | 131.89 | 131.84 | 131.32 | 130.30 | 128.09 | 124.56 | 119.56 |
| 2013 | 111.68 | 106.05 | 105.13 | 101.81 | 98.91 | 103.09 | 101.16 | 103.03 | 101.21 | 101.77 | 99.96 | 96.51 |
| 2014 | 96.11 | 97.68 | 97.53 | 99.23 | 100.09 | 99.82 | 99.99 | 99.17 | 95.94 | 95.80 | 89.64 | 88.47 |
| 2015 | 90.59 | 90.25 | 90.07 | 90.44 | 89.14 | 87.04 | 87.96 | 89.50 | 92.39 | 91.85 | 90.64 | 91.80 |
| 2016 | 95.47 | 97.04 | 97.57 | 99.57 | 101.09 | 104.48 | 106.10 | 108.28 | 107.59 | 106.96 | 104.06 | 97.80 |
| 2017 | 97.79 | 98.46 | 98.36 | 100.78 | 98.38 | 98.62 | 96.40 | 97.59 | 95.93 | 94.74 | 94.94 | 94.36 |
| 2018 | 94.12 | 95.30 | 97.00 | 95.54 | 95.37 | 95.93 | 96.18 | 97.85 | 96.78 | 96.78 | 96.62 | 97.10 |
| 2019 | 99.20 | 96.92 | 96.21 | 96.00 | 98.51 | 99.79 | 99.33 | 102.87 | 101.64 | 100.47 | 99.19 | 98.56 |
| 2020 | 97.49 | 97.35 | 101.60 | 102.99 | 103.42 | 100.94 | 100.76 | 100.24 | 99.75 | 99.35 | 98.68 | 97.44 |
| 2021 | 97.05 | 95.02 | 93.12 | 91.83 | 91.04 | 90.25 | 91.11 | 91.44 | 91.15 | 88.25 | 87.59 | 87.75 |
| 2022 | 86.66 | 85.89 | 83.97 | 79.30 | 79.44 | 75.97 | 75.70 | 77.01 | 74.55 | 73.71 | 75.20 | 77.67 |
| 2023 | 78.95 | 77.16 | 77.49 | 77.54 | 76.04 | 74.34 | 74.37 | 73.08 | 72.33 | 72.50 | 71.44 | 73.40 |
| 2024 | 72.58 | 70.72 | 70.81 | 69.87 | 68.90 | 68.37 | 68.27 | 72.87 | 73.49 | 71.23 | 71.11 | 71.84 |
| 2025 | 71.34 | 72.83 | ||||||||||
| Year | Jan | Feb | Mar | Apr | May | Jun | Jul | Aug | Sep | Oct | Nov | Dec |
| Month | ||||||||||||
| Current JPY exchange rates | |
|---|---|
| From Google Finance: | AUD CAD CHF EUR GBP HKD USD KRW EUR USD |
| From Yahoo! Finance: | AUD CAD CHF EUR GBP HKD USD KRW EUR USD |
| From XE.com: | AUD CAD CHF EUR GBP HKD USD KRW EUR USD |
| From OANDA: | AUD CAD CHF EUR GBP HKD USD KRW EUR USD |
| From fxtop.com: | AUD CAD CHF EUR GBP HKD USD KRW EUR USD |
See also
 In Spanish: Yen para niños
- Japan Mint
- Economy of Japan
- Monetary and fiscal policy of Japan
Older Japanese Money
- Japanese mon (currency)
- Koban (coin)
- Ryō (Japanese coin)
 | Shirley Ann Jackson |
 | Garett Morgan |
 | J. Ernest Wilkins Jr. |
 | Elijah McCoy |


