
List of states and territories of the United States by population density facts for kids

Have you ever wondered how crowded a place is? That's what population density tells us! It's a way to measure how many people live in a certain amount of land. You figure it out by dividing the total number of people by the total land area.
This article looks at the population density of the 50 states, the 5 territories, and the District of Columbia. We'll see which places are super crowded and which have lots of open space.
The United States has a lower population density than many other countries. This is because the U.S. is a very large country! There are huge areas with very few people. Think about the big open spaces from Seattle to Minneapolis, or from northern Montana down to southern New Mexico.
For example, the U.S. is much less crowded than countries like South Korea, India, or the Netherlands. But it's much more crowded than its neighbors, Canada and Australia, which have even larger land areas with fewer people.
U.S. States and Territories by Population Density
Population density helps us understand how spread out people are. We calculate it by taking the total number of people and dividing it by the land area. The numbers below come from the US Census. The population figures are from 2023, and the land area figures are from 2010.
| Location | Density | Population | Land area | |||
|---|---|---|---|---|---|---|
| mi2 | km2 | mi2 | km2 | |||
| 11,131 | 4,297 | 678,972 | 61 | 158 | ||
| 1,263 | 488 | 9,290,841 | 7,354 | 19,047 | ||
| 1,060 | 409 | 1,095,962 | 1,034 | 2,678 | ||
| 936 | 361 | 3,205,691 | 3,424 | 8,868 | ||
| 898 | 347 | 7,001,399 | 7,800 | 20,202 | ||
| 824 | 319 | 172,952 | 210 | 543 | ||
| 747 | 288 | 3,617,176 | 4,842 | 12,542 | ||
| 737 | 284 | 98,750 | 134 | 348 | ||
| 637 | 246 | 6,180,253 | 9,707 | 25,142 | ||
| 578 | 222 | 43,915 | 76 | 198 | ||
| 529 | 204 | 1,031,890 | 1,949 | 5,047 | ||
| 422 | 163 | 22,610,726 | 53,625 | 138,887 | ||
| 415 | 160 | 19,571,216 | 47,126 | 122,057 | ||
| 290 | 112 | 12,961,683 | 44,743 | 115,883 | ||
| 288 | 111 | 11,785,935 | 40,861 | 105,829 | ||
| 274 | 106 | 49,796 | 182 | 472 | ||
| 250 | 97 | 38,965,193 | 155,779 | 403,466 | ||
| 226 | 87 | 12,549,689 | 55,519 | 143,793 | ||
| 223 | 86 | 1,435,138 | 6,423 | 16,635 | ||
| 223 | 86 | 10,835,491 | 48,618 | 125,920 | ||
| 221 | 85 | 8,715,698 | 39,490 | 102,279 | ||
| 192 | 74 | 11,029,227 | 57,513 | 148,959 | ||
| 192 | 74 | 6,862,199 | 35,826 | 92,789 | ||
| 179 | 69 | 5,373,555 | 30,061 | 77,857 | ||
| 178 | 69 | 10,037,261 | 56,539 | 146,435 | ||
| 173 | 67 | 7,126,489 | 41,235 | 106,798 | ||
| 157 | 60 | 1,402,054 | 8,953 | 23,187 | ||
| 118 | 45 | 7,812,880 | 66,456 | 172,119 | ||
| 117 | 45 | 30,503,301 | 261,232 | 676,587 | ||
| 115 | 44 | 4,526,154 | 39,486 | 102,269 | ||
| 109 | 42 | 5,910,955 | 54,158 | 140,268 | ||
| 106 | 41 | 4,573,749 | 43,204 | 111,898 | ||
| 101 | 39 | 5,108,468 | 50,645 | 131,171 | ||
| 90 | 35 | 6,196,156 | 68,742 | 178,040 | ||
| 74 | 28 | 1,770,071 | 24,038 | 62,259 | ||
| 72 | 28 | 5,737,915 | 79,627 | 206,232 | ||
| 70 | 27 | 647,464 | 9,217 | 23,871 | ||
| 65 | 25 | 7,431,344 | 113,594 | 294,207 | ||
| 63 | 24 | 2,939,690 | 46,923 | 121,531 | ||
| 59 | 23 | 4,053,824 | 68,595 | 177,660 | ||
| 59 | 23 | 3,067,732 | 52,035 | 134,771 | ||
| 57 | 22 | 3,207,004 | 55,857 | 144,669 | ||
| 57 | 22 | 5,877,610 | 103,642 | 268,431 | ||
| 45 | 17 | 1,395,722 | 30,843 | 79,883 | ||
| 44 | 17 | 4,233,358 | 95,988 | 248,608 | ||
| 42 | 16 | 3,417,734 | 82,170 | 212,818 | ||
| 36 | 14 | 2,940,546 | 81,759 | 211,754 | ||
| 29 | 11 | 3,194,176 | 109,781 | 284,332 | ||
| 26 | 10 | 1,978,379 | 76,824 | 198,974 | ||
| 24 | 9.2 | 1,964,726 | 82,643 | 214,045 | ||
| 17 | 6.7 | 2,114,371 | 121,298 | 314,161 | ||
| 12 | 4.7 | 919,318 | 75,811 | 196,350 | ||
| 11 | 4.4 | 783,926 | 69,001 | 178,711 | ||
| 7.8 | 3.0 | 1,132,812 | 145,546 | 376,962 | ||
| 6.0 | 2.3 | 584,057 | 97,093 | 251,470 | ||
| 1.3 | 0.50 | 733,406 | 570,641 | 1,477,953 | ||
| Contiguous US | 113 | 43 | 332,746,351 | 2,954,843 | 7,653,006 | |
| 50 States | 95 | 37 | 334,235,923 | 3,531,846 | 9,147,436 | |
| 50 States and DC | 95 | 37 | 334,914,895 | 3,531,907 | 9,147,594 | |
| United States | 96 | 37 | 338,485,999 | 3,531,905 | 9,147,593 | |
Gallery
- Gallery of U.S. States
-
New Jersey is the most densely populated state.
-

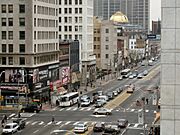
New York is home to the most populous city in the country, and ranks 8th among the states in density.
-
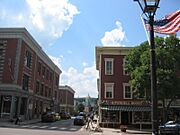
Despite a small population, Vermont has fairly average population density because of its small area.
-
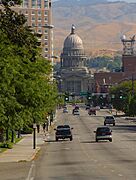
Idaho's population has increased rapidly in recent decades, but its population density is lower than other states.
-
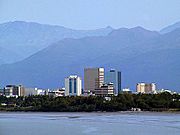
About half of the population of Alaska lives in the Anchorage metropolitan area.
-
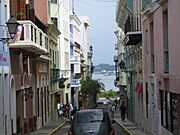
Puerto Rico is the fourth most densely populated of states and possessions of the U.S.

.jpg)


See also
 In Spanish: Anexo:Estados y territorios de los Estados Unidos por densidad para niños
- List of U.S. states and territories by area
- Demographics of the United States
- List of U.S. states by population
- List of United States cities by population density
