Lists of UK locations with large ethnic minority populations facts for kids
The United Kingdom is a country where people from many different backgrounds live. This article explores some of the places in the UK where large groups of people from other countries or cultures have made their homes. You'll find that most of these diverse communities live in big cities, especially London and Birmingham. London is known for being one of the most diverse cities globally, with many communities of over 10,000 people.
Contents
People from Asia
Bangladeshi Communities
Many people of Bangladeshi heritage live in the UK. They often form vibrant communities in different cities and towns.
- London - Over 222,000 people
- Birmingham - Over 32,000 people
- London Borough of Tower Hamlets - Over 81,000 people (a very high percentage of the local population)
- London Borough of Newham - Over 37,000 people
- Metropolitan Borough of Oldham - Over 16,000 people
- Luton - Over 13,000 people
- London Borough of Redbridge - Over 16,000 people
- London Borough of Camden - Over 12,000 people
- London Borough of Barking and Dagenham - Over 7,000 people
- London Borough of Westminster - Over 6,000 people
- Sandwell - Over 6,000 people
- Bradford - Over 9,000 people
Indian Communities
The UK is home to a large number of people from India. They have created strong communities across many cities.
- London - Over 542,000 people
- Birmingham - Over 64,000 people
- Leicester - Over 93,000 people (a very high percentage of the local population)
- London Borough of Harrow - Over 63,000 people
- London Borough of Hounslow - Over 48,000 people
- London Borough of Brent - Over 58,000 people
- London Borough of Redbridge - Over 45,000 people
- Slough - Over 21,000 people
- London Borough of Ealing - Over 48,000 people
- London Borough of Newham - Over 42,000 people
- London Borough of Hillingdon - Over 36,000 people
- Wolverhampton - Over 32,000 people
- Preston - Over 32,000 people
- Sandwell - Over 31,000 people
Pakistani Communities
There are many Pakistani communities throughout the UK, especially in some of the larger cities.
- Birmingham - Over 144,000 people
- Bradford - Over 106,000 people (a very high percentage of the local population)
- London - Over 223,000 people (see Pakistani community of London)
- Manchester - Over 42,000 people
- Glasgow - Over 22,000 people
- Pendle - Over 15,000 people
- Slough - Over 24,000 people
- Luton - Over 29,000 people
- London Borough of Redbridge - Over 31,000 people
- Rochdale - Over 22,000 people
- London Borough of Waltham Forest - Over 26,000 people
- Oldham - Over 22,000 people
- Kirklees - Over 41,000 people
- London Borough of Newham - Over 30,000 people
Chinese Communities
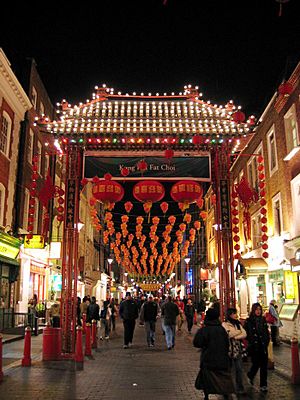
Chinese communities are found in many major cities, often with their own special areas like Chinatown.
- London - Over 124,000 people
- Manchester - Over 13,000 people
- Birmingham - Over 12,000 people
- Liverpool - Over 7,000 people
- Edinburgh - Over 8,000 people
- Glasgow - Over 10,000 people
- Sheffield - Over 7,000 people
- Nottingham - Over 8,000 people
- Newcastle upon Tyne - Over 6,000 people
- London Borough of Southwark - Over 8,000 people
- London Borough of Barnet - Over 8,000 people
- London Borough of Camden - Over 6,000 people
- London Borough of Lewisham - Over 6,000 people
People from Africa
Black British Communities
Many people of Black African and Caribbean heritage live in the UK, forming significant communities, especially in London and other large cities.
- Greater London - Over 1,088,000 people
- Birmingham - Over 96,000 people
- Manchester - Over 43,000 people
- London Borough of Lewisham - Over 75,000 people
- London Borough of Southwark - Over 77,000 people
- London Borough of Lambeth - Over 78,000 people
- London Borough of Hackney - Over 56,000 people
- London Borough of Croydon - Over 73,000 people
- London Borough of Newham - Over 60,000 people
- London Borough of Brent - Over 58,000 people
- London Borough of Enfield - Over 53,000 people
- Nottingham - Over 37,000 people
- Leicester - Over 20,000 people
- Bristol - Over 25,000 people
- Leeds - Over 25,000 people
People from Europe and Beyond
Irish Communities
People from Ireland have a long history of living in the UK, and many large Irish communities can be found across the country.
- London - Over 176,000 people, with large groups in Cricklewood, Willesden Green and West Hampstead
- Birmingham - Over 22,000 people
- Manchester - Over 11,000 people
- Portsmouth - Over 22,000 people
- Newcastle upon Tyne - Over 22,000 people
- London Borough of Brent - Over 12,000 people
- London Borough of Islington - Over 8,000 people
- London Borough of Camden - Over 7,000 people
- London Borough of Ealing - Over 10,000 people
- London Borough of Harrow - Over 7,000 people
- London Borough of Wandsworth - Over 7,000 people
- London Borough of Lambeth - Over 7,000 people
- London Borough of Barnet - Over 8,000 people
- Coventry - Over 7,000 people
Italian Communities
Italian communities have also settled in various parts of the UK, bringing their culture and traditions.
- London - Over 39,000 people born in Italy
- Manchester - Around 25,000 people of Italian heritage
- Bedford - Around 20,000 people
- Nottingham - Over 8,000 people
- Liverpool - Over 6,000 people born in Italy
- Bristol - Over 6,000 people born in Italy
- Glasgow - Around 4,000 people of Italian heritage (with an estimated 100,000 across Scotland)
- Hoddesdon - Has a notable Italian community, mostly from Sicily and Emilia Romagna. There is even an Italian Consulate in the Borough of Broxbourne.
Lithuanian Communities
Many Lithuanians have moved to the UK, forming communities in several towns and cities.
- London - Between 40,000 and 80,000 people
- Wisbech - Around 5,000 people (a very high percentage of the local population)
- Peterborough - Over 3,700 people
- Boston - Over 1,800 people
Polish Communities
Polish people form one of the largest non-British communities in the UK, with many living in London and other areas.
- London - Over 159,000 people
- Edinburgh - Over 13,000 people
- Birmingham - Over 9,000 people
- Manchester - Over 7,000 people
- Glasgow - Over 8,000 people
- Slough - Over 9,000 people
- Luton - Over 8,000 people
- Peterborough - Over 7,000 people
- Southampton - Over 8,000 people
- Nottingham - Over 24,000 people
- London Borough of Ealing - Over 21,000 people
- London Borough of Haringey - Over 11,000 people
- London Borough of Hounslow - Over 10,000 people
- London Borough of Brent - Over 10,000 people
 | John T. Biggers |
 | Thomas Blackshear |
 | Mark Bradford |
 | Beverly Buchanan |


