Food pyramid (nutrition) facts for kids
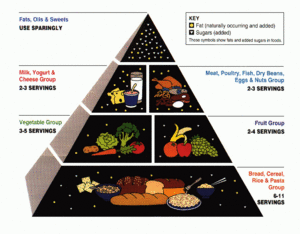
A food pyramid is a helpful picture that shows you how much of different types of food you should eat each day to stay healthy. It's shaped like a pyramid, with foods you should eat a lot of at the bottom (the wide part) and foods you should eat less of at the top (the narrow part). The very first food pyramid was created in Sweden in 1974. Later, the United States Department of Agriculture (USDA) made their own famous food pyramid in 1992. It was updated in 2005 to "MyPyramid" and then replaced by "MyPlate" in 2011.
Contents
The First Food Pyramid: From Sweden!
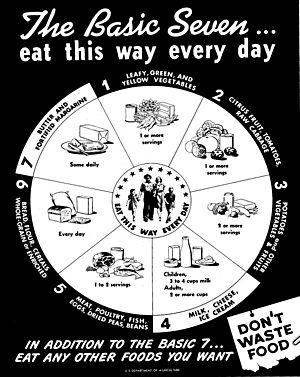
Imagine food prices were really high in 1972! In Sweden, a group called the National Board of Health and Welfare came up with an idea. They wanted to show people which foods were both cheap and good for you ("basic foods") and which foods added extra important nutrients ("supplemental foods").
A woman named Anna-Britt Agnsäter, who worked for a Swedish grocery chain, thought about how to show these food groups clearly. Someone suggested a triangle, with the basic foods at the bottom. Anna-Britt turned this idea into the very first food pyramid! It was shown to the public in 1974.
This first pyramid had basic foods like milk, cheese, bread, cereals, and potato at the bottom. Above that was a big section for extra vegetables and fruits. At the very top, in the smallest section, were foods like meat, fish, and egg. This pyramid helped people understand how much of each food group they should eat. Other countries like West Germany, Japan, and Sri Lanka also started using food pyramids. The United States created its own food pyramid much later, in 1992.
Global Food Guidelines
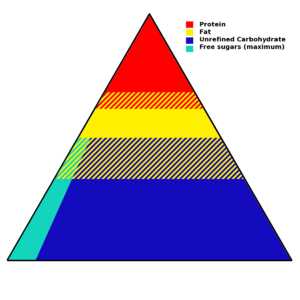
Big organizations like the World Health Organization (WHO) and the Food and Agriculture Organization (FAO) also create guidelines for healthy eating. These guidelines help countries around the world prevent problems like obesity (being very overweight), poor nutrition, and long-term diseases.
While they don't always show their advice as a pyramid, the ideas are similar to what you'd see in one. For example, they suggest how much fat, carbohydrates (like sugars and starches), and protein you should get from your food. They also highlight the importance of eating plenty of fruits and vegetables every day. These guidelines help people understand how to eat in a way that keeps them healthy and strong.
The USDA Food Pyramid
History of the USDA Pyramid
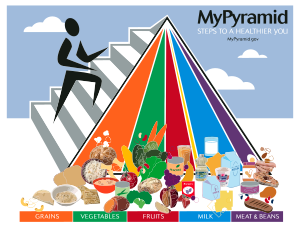
The United States Department of Agriculture (USDA) launched its own food pyramid in 1992. It had six horizontal sections, each showing pictures of foods from a different group. In 2005, the pyramid was updated and renamed MyPyramid. This new version had vertical wedges instead of horizontal sections. Often, the food pictures were removed, making it look more like an abstract design.
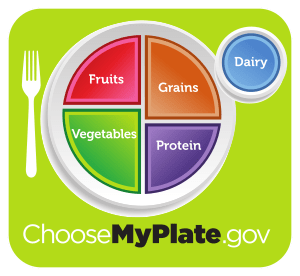
Then, in June 2011, the USDA changed its guide again. They introduced the new MyPlate program. MyPlate looks like a dinner plate divided into four sections, plus a smaller circle for dairy. Fruits and vegetables take up half the plate, and grains and protein make up the other half. The vegetable and grain sections are the largest.
Food Groups in the USDA Pyramid
Vegetables
A vegetable is a part of a plant that we eat, and it's usually savory, not sweet. This can be the stem, root, or flower of a plant. Vegetables are packed with important vitamins and minerals. It's good to eat many different kinds because they each offer different nutrients. For example, orange and dark green vegetables often have vitamin A, and dark green ones also have vitamin C. Vegetables like broccoli give you iron and calcium. They are naturally low in fat and calories, but watch out for extra fats and calories added when they are cooked!
Grains
Grains are foods like corn, wheat, pasta, and rice. These foods give us complex carbohydrates, which are a great source of energy. When grains are "unrefined" (like whole wheat bread instead of white bread), they provide even more nutrition.
Fruits
In cooking, fruits are the sweet, seed-bearing parts of plants. Think of apples, oranges, grapes, and bananas. Fruits are low in calories and fat. They are a natural source of sugars, fiber, and vitamins. Be careful, though, because processing fruit into juices or canning it can sometimes add sugars and remove some nutrients. Sometimes, the fruit and vegetable groups are combined because they both offer so many good things for your body.
Dairy
Dairy products are made from the milk of mammals, usually cattle. This group includes milk, yogurt, and cheese. Dairy products are a good source of calcium, which helps build strong bones. They also provide protein, phosphorus, vitamin A, and vitamin D. However, some dairy products can be high in saturated fat. That's why you can often find skimmed (low-fat) versions.
For a long time, adults were told to have three cups of dairy each day. More recently, scientists are studying dairy's effects on health even more. Some research suggests that dairy might not be as important for strong bones as once thought, while other studies still show benefits for bone health. Overall, most research agrees that dairy can be good for your bones because of all the nutrients in milk.
Meat and Beans
Meat is the tissue (usually muscle) of an animal that humans eat. There are many types of meat, like beef, chicken, pork, and salmon. Meat is a main source of protein, which helps your body grow and repair itself. It also gives you iron, zinc, and vitamin B12.
This group also includes other protein-rich foods that are like "meat alternatives." These are foods that give you similar nutrients to meat. Examples are eggs, dry beans, nuts, and tofu. For people who don't eat meat (like vegetarians or vegans), foods like lentils, chickpeas, and other high-protein vegetables are important parts of this group. The food guide pyramid usually suggests that adults eat 2–3 servings from this group each day. A serving of meat is about the size of a deck of cards.
Oils and Sweets
The very top of the food pyramid is the smallest part. This is where fats and sweets go, meaning you should eat them in the smallest amounts. These foods give you calories but not a lot of important nutrients. Examples include salad dressings, oils, butter, sugars, soft drinks, and candies.
On the 1992–2005 pyramid, you might have seen small circles for fat and triangles for sugar scattered throughout the pyramid. This was to show that fats and sugars are naturally found in many foods, even healthy ones. The idea is to remind us that we already get some fats and sugars from other foods, so we don't need too much extra from junk food.
Other Food Guides
Besides the USDA pyramid, other groups have created their own healthy eating guides. For example, the Harvard School of Public Health has a "healthy eating pyramid" that focuses more on vegetables, healthy proteins, and good fats. The University of Michigan also has a "Healing Foods Pyramid" that highlights plant-based foods and encourages variety. In Japan, they have a food guide that looks like a spinning top!
MyPlate
MyPlate is the most recent nutrition guide from the United States Department of Agriculture. It shows a plate and a glass divided into five food groups. MyPlate replaced the USDA's food pyramid guides on June 2, 2011, after 19 years of using the pyramid shape. It's designed to be a simple visual reminder to eat a balanced meal.
See also
 In Spanish: Pirámide alimentaria para niños
- Food and Nutrition Service
- Fruits & Veggies – More Matters
- Healthy diet
- Healthy eating pyramid
- History of USDA nutrition guides
- Human nutrition
- List of nutrition guides
- Nutrition education
- Overall nutritional quality index
 | Roy Wilkins |
 | John Lewis |
 | Linda Carol Brown |


