
Parliamentary constituencies in London facts for kids
Greater London, which includes the historic City of London, is split into 73 special areas called parliamentary constituencies. Each of these areas chooses one person to represent them in the UK Parliament. These representatives are called Members of Parliament, or MPs for short.
Contents
How London's MPs are Chosen
In London, there are 73 areas, or constituencies, that each elect an MP. These are known as borough constituencies. When people vote in a general election, they choose which person they want to be their MP for their local area. The person who gets the most votes wins!
Here's a quick look at how many MPs each main political party has in London right now, based on the 2019 election: † Conservative ‡ Labour ¤ Liberal Democrat ♣ Green Party
| Constituency | Electorate | Majority | Member of Parliament | Nearest opposition | ||
|---|---|---|---|---|---|---|
| Barking | 77,953 | 15,427 | Dame Margaret Hodge‡ | Tamkeen Shaikh† | ||
| Battersea | 79,350 | 5,668 | Marsha de Cordova‡ | Kim Caddy† | ||
| Beckenham | 68,662 | 14,258 | Bob Stewart† | Marina Ahmad‡ | ||
| Bermondsey and Old Southwark | 93,248 | 16,126 | Neil Coyle‡ | Humaira Ali¤ | ||
| Bethnal Green and Bow | 88,262 | 37,524 | Rushanara Ali‡ | Nicholas Stovold† | ||
| Bexleyheath and Crayford | 65,466 | 13,103 | Sir David Evennett† | Anna Day‡ | ||
| Brent Central | 84,032 | 20,870 | Dawn Butler‡ | David Brescia† | ||
| Brent North | 83,788 | 8,079 | Barry Gardiner‡ | Anjana Patel† | ||
| Brentford and Isleworth | 85,775 | 10,514 | Ruth Cadbury‡ | Seena Shah† | ||
| Bromley and Chislehurst | 66,697 | 10,891 | Sir Bob Neill† | Angela Wilkins‡ | ||
| Camberwell and Peckham | 88,971 | 33,780 | Harriet Harman‡ | Peter Quentin† | ||
| Carshalton and Wallington | 72,941 | 629 | Elliot Colburn† | Tom Brake¤ | ||
| Chelsea and Fulham | 67,110 | 11,241 | Greg Hands† | Nicola Horlick¤ | ||
| Chingford and Woodford Green | 65,393 | 1,062 | Sir Iain Duncan Smith† | Faiza Shaheen‡ | ||
| Chipping Barnet | 79,960 | 1,212 | Theresa Villiers† | Emma Whysall‡ | ||
| Cities of London and Westminster | 63,700 | 3,953 | Nickie Aiken† | Chuka Umunna¤ | ||
| Croydon Central | 81,407 | 5,949 | Sarah Jones‡ | Mario Creatura† | ||
| Croydon North | 88,468 | 24,673 | Steve Reed‡ | Donald Ekekhomen† | ||
| Croydon South | 83,982 | 12,339 | Chris Philp† | Olga Fitzroy‡ | ||
| Dagenham and Rainham | 71,045 | 293 | Jon Cruddas‡ | Damian White† | ||
| Dulwich and West Norwood | 80,331 | 27,310 | Helen Hayes‡ | Jonathan Bartley♣ | ||
| Ealing Central and Acton | 75,510 | 13,300 | Rupa Huq‡ | Julian Gallant† | ||
| Ealing North | 74,473 | 12,269 | James Murray‡ | Anthony Pickles† | ||
| Ealing Southall | 64,581 | 16,084 | Virendra Sharma‡ | Tom Bennett† | ||
| East Ham | 88,319 | 33,176 | Stephen Timms‡ | Scott Pattenden† | ||
| Edmonton | 65,747 | 16,015 | Kate Osamor‡ | James Hockney† | ||
| Eltham | 64,086 | 3,193 | Clive Efford‡ | Louie French† | ||
| Enfield North | 68,301 | 6,492 | Feryal Clark‡ | Joanne Laban† | ||
| Enfield Southgate | 65,525 | 4,450 | Bambos Charalambous‡ | David Burrowes† | ||
| Erith and Thamesmead | 65,399 | 3,758 | Abena Oppong-Asare‡ | Joe Robertson† | ||
| Feltham and Heston | 80,934 | 7,859 | Seema Malhotra‡ | Jane Keep† | ||
| Finchley and Golders Green | 73,573 | 6,562 | Mike Freer† | Luciana Berger¤ | ||
| Greenwich and Woolwich | 79,997 | 18,464 | Matthew Pennycook‡ | Thomas Turrell† | ||
| Hackney North and Stoke Newington | 92,462 | 33,188 | Diane Abbott‡ | Benjamin Obese-Jecty† | ||
| Hackney South and Shoreditch | 89,387 | 33,985 | Meg Hillier‡ | Mark Beckett† | ||
| Hammersmith | 74,759 | 17,847 | Andy Slaughter‡ | Xingang Wang† | ||
| Hampstead and Kilburn | 86,571 | 14,188 | Tulip Siddiq‡ | Johnny Luk† | ||
| Harrow East | 72,106 | 8,170 | Bob Blackman† | Pamela Fitzpatrick‡ | ||
| Harrow West | 72,464 | 8,692 | Gareth Thomas‡ | Anwara Ali† | ||
| Hayes and Harlington | 72,357 | 9,261 | John McDonnell‡ | Wayne Bridges† | ||
| Hendon | 82,661 | 4,230 | Dr Matthew Offord† | David Pinto-Duschinsky‡ | ||
| Holborn and St Pancras | 86,061 | 27,673 | Sir Keir Starmer‡ | Alexandra Hayward† | ||
| Hornchurch and Upminster | 80,765 | 23,308 | Julia Lopez† | Tele Lawal‡ | ||
| Hornsey and Wood Green | 81,814 | 19,242 | Catherine West‡ | Dawn Barnes¤ | ||
| Ilford North | 72,973 | 5,218 | Wes Streeting‡ | Howard Berlin† | ||
| Ilford South | 84,972 | 24,101 | Sam Tarry‡ | Ali Azeem† | ||
| Islington North | 75,162 | 26,188 | Jeremy Corbyn‡ | Nick Richard-Wakeling¤ | ||
| Islington South and Finsbury | 70,489 | 17,328 | Emily Thornberry‡ | Kate Pothalingam¤ | ||
| Kensington | 64,609 | 150 | Felicity Buchan† | Emma Dent Coad‡ | ||
| Kingston and Surbiton | 81,975 | 10,489 | Sir Ed Davey¤ | Aphra Brandreth† | ||
| Lewisham Deptford | 80,631 | 32,913 | Vicky Foxcroft‡ | Gavin Haran† | ||
| Lewisham East | 67,857 | 17,008 | Janet Daby‡ | Sam Thurgood† | ||
| Lewisham West and Penge | 74,617 | 21,543 | Ellie Reeves‡ | Aisha Cuthbert† | ||
| Leyton and Wanstead | 64,852 | 20,808 | John Cryer‡ | Noshaba Khiljee† | ||
| Mitcham and Morden | 70,021 | 16,482 | Siobhain McDonagh‡ | Toby Williams† | ||
| Old Bexley and Sidcup | 66,104 | 4,478 | Louie French† | Daniel Francis‡ | ||
| Orpington | 68,877 | 22,378 | Gareth Bacon† | Simon Jeal‡ | ||
| Poplar and Limehouse | 91,836 | 28,904 | Apsana Begum‡ | Sheun Oke† | ||
| Putney | 65,556 | 4,774 | Fleur Anderson‡ | Will Sweet† | ||
| Richmond Park | 82,699 | 7,766 | Sarah Olney¤ | Zac Goldsmith† | ||
| Romford | 72,350 | 17,893 | Andrew Rosindell† | Angelina Leatherbarrow‡ | ||
| Ruislip, Northwood and Pinner | 72,816 | 16,394 | David Simmonds† | Peymana Assad‡ | ||
| Streatham | 84,783 | 17,690 | Bell Ribeiro-Addy‡ | Helen Thompson¤ | ||
| Sutton and Cheam | 71,779 | 8,351 | Paul Scully† | Hina Bokhari¤ | ||
| Tooting | 76,954 | 14,307 | Dr Rosena Allin-Khan‡ | Kerry Briscoe† | ||
| Tottenham | 75,740 | 30,175 | David Lammy‡ | James Newhall† | ||
| Twickenham | 84,906 | 14,125 | Munira Wilson¤ | Isobel Grant† | ||
| Uxbridge and South Ruislip | 30,925 | 495 | Steve Tuckwell† | Danny Beales‡ | ||
| Vauxhall | 88,659 | 19,612 | Florence Eshalomi‡ | Sarah Lewis¤ | ||
| Walthamstow | 70,267 | 30,862 | Stella Creasy‡ | Shade Adoh† | ||
| West Ham | 97,947 | 32,388 | Lyn Brown‡ | Sara Kumar† | ||
| Westminster North | 65,519 | 10,759 | Karen Buck‡ | Jamie Macfarlane† | ||
| Wimbledon | 68,240 | 628 | Stephen Hammond† | Paul Kohler¤ | ||
Future Changes to London's Constituencies
The way London is divided into constituencies changes sometimes. This is done by a group called the Boundary Commission for England. They look at how many people live in each area to make sure that each MP represents a similar number of voters.
Recently, the Boundary Commission decided that London will get 2 more MPs, increasing the total from 73 to 75. This means some constituency borders will change, and some new ones will be created. For example, a new area called Stratford and Bow will be formed. Also, Streatham and Croydon North will be a new constituency in the south of London.
Only a few constituencies, like Walthamstow, Islington North, and Tooting, will stay almost exactly the same. Most others will have some changes to their borders or even their names. These new boundaries will be used in the next general election.
Here are some of the proposed new constituencies for London:
| Name | Electorate | Boroughs covered |
|---|---|---|
| Barking BC | 71,822 | Barking and Dagenham |
| Battersea BC | 71,949 | Wandsworth |
| Beckenham and Penge BC | 76,625 | Bromley |
| Bermondsey and Old Southwark BC | 70,602 | Southwark |
| Bethnal Green and Stepney BC | 77,000 | Tower Hamlets |
| Bexleyheath and Crayford BC | 69,948 | Bexley |
| Brent East BC | 75,880 | Brent |
| Brent West BC | 76,443 | Brent |
| Brentford and Isleworth BC | 76,354 | |
| Bromley and Biggin Hill BC | 71,515 | Bromley |
| Carshalton and Wallington BC | 72,755 | Sutton |
| Chelsea and Fulham BC | 76,481 | |
| Chingford and Woodford Green BC | 75,677 | |
| Chipping Barnet BC | 76,187 | Barnet |
| Cities of London and Westminster BC | 73,140 | |
| Clapham and Brixton Hill BC | 75,460 | Lambeth |
| Croydon East BC | 75,436 | Croydon |
| Croydon South BC | 71,541 | Croydon |
| Croydon West BC | 70,812 | Croydon |
| Dagenham and Rainham BC | 73,627 |
|
| Dulwich and West Norwood BC | 74,314 |
|
| Ealing Central and Acton BC | 75,399 | |
| Ealing North BC | 72,985 | Ealing |
| Ealing Southall BC | 75,085 | Ealing |
| East Ham BC | 70,902 | Newham |
| Edmonton and Winchmore Hill BC | 75,204 | Enfield |
| Eltham and Chislehurst BC | 74,179 |
|
| Enfield North BC | 76,824 | Enfield |
| Erith and Thamesmead BC | 76,728 |
|
| Feltham and Heston BC | 75,226 | Hounslow |
| Finchley and Golders Green BC | 75,761 | Barnet |
| Greenwich and Woolwich BC | 69,824 | Greenwich |
| Hackney North and Stoke Newington BC | 75,401 | Hackney |
| Hackney South and Shoreditch BC | 75,197 | Hackney |
| Hammersmith and Chiswick BC | 74,746 |
|
| Hampstead and Highgate BC | 74,222 |
|
| Harrow East BC | 76,299 | Harrow |
| Harrow West BC | 74,060 | Harrow |
| Hayes and Harlington BC | 72,897 | Hillingdon |
| Hendon BC | 71,496 | Barnet |
| Holborn and St Pancras BC | 75,475 | Camden |
| Hornchurch and Upminster BC | 76,938 | Havering |
| Hornsey and Friern Barnet BC | 70,565 |
|
| Ilford North BC | 74,684 | Redbridge |
| Ilford South BC | 74,065 |
|
| Islington North BC | 73,970 | Islington |
| Islington South and Finsbury BC | 75,905 |
|
| Kensington and Bayswater BC | 75,980 |
|
| Kingston and Surbiton BC | 75,410 | Kingston upon Thames |
| Lewisham East BC | 71,706 | Lewisham |
| Lewisham North BC | 73,504 | Lewisham |
| Lewisham West and East Dulwich BC | 69,904 |
|
| Leyton and Wanstead BC | 71,330 |
|
| Mitcham and Morden BC | 76,877 | Merton |
| Old Bexley and Sidcup BC | 74,317 | Bexley |
| Orpington BC | 71,571 | Bromley |
| Peckham BC | 71,176 | Southwark |
| Poplar and Limehouse BC | 75,814 | Tower Hamlets |
| Putney BC | 73,041 | Wandsworth |
| Queen's Park and Maida Vale BC | 75,256 |
|
| Richmond Park BC | 75,037 |
|
| Romford BC | 72,730 | Havering |
| Ruislip, Northwood and Pinner BC | 72,168 |
|
| Southgate and Wood Green BC | 76,034 |
|
| Stratford and Bow BC | 73,849 |
|
| Streatham and Croydon North BC | 76,050 |
|
| Sutton and Cheam BC | 71,284 | Sutton |
| Tooting BC | 76,986 | Wandsworth |
| Tottenham BC | 75,968 | Haringey |
| Twickenham BC | 75,889 | Richmond upon Thames |
| Uxbridge and South Ruislip BC | 75,042 | Hillingdon |
| Vauxhall and Camberwell Green BC | 69,995 |
|
| Walthamstow BC | 70,867 | Waltham Forest |
| West Ham and Beckton BC | 70,590 | Newham |
| Wimbledon BC | 74,641 |
|
New and Old Seats
When the boundaries change, some old constituencies disappear, and new ones are created.
Abolished Seats
- Beckenham
- Bethnal Green and Bow
- Brent Central
- Brent North
- Bromley and Chislehurst
- Camberwell and Peckham
- Croydon Central
- Croydon North
- Edmonton
- Eltham
- Enfield Southgate
- Hammersmith
- Hampstead and Kilburn
- Hornsey and Wood Green
- Kensington
- Lewisham Deptford
- Lewisham West and Penge
- Streatham
- Vauxhall
- West Ham
- Westminster North
New Seats
- Beckenham and Penge
- Bethnal Green and Stepney
- Brent East
- Brent West
- Bromley and Biggin Hill
- Clapham and Brixton Hill
- Croydon East
- Croydon West
- Edmonton and Winchmore Hill
- Hammersmith and Chiswick
- Hampstead and Highgate
- Hornsey and Friern Barnet
- Kensington and Bayswater
- Peckham
- Queen's Park and Maida Vale
- Stratford and Bow
- Streatham and Croydon North
- Vauxhall and Camberwell Green
- West Ham and Beckton
History of London's Constituencies
London's political map has changed a lot over time. Here's a simplified look at how it developed:
Early Days (Before 1832)
Long ago, before 1832, London didn't have many MPs. Only a few areas like the City of London, Westminster, and Southwark had their own representatives. The rest of London was part of larger county areas like Middlesex and Surrey.
Growing Representation (1832 to 1885)
The Reform Act 1832 was a big deal! It gave more parts of London their own MPs. Seven new "metropolitan boroughs" were created, each electing two MPs. This meant more people in London had a direct say in Parliament.
In 1867, even more changes happened. A new area called Chelsea got its own MP, and Tower Hamlets was split into two separate areas: Hackney and Tower Hamlets.
More MPs for London (1885 to 1918)
The Redistribution of Seats Act 1885 was another major change. It greatly increased the number of MPs for London, from 22 to 59! Most areas now had just one MP. Even though London's local government areas changed in 1889 (when the County of London was created), the MP areas stayed the same until 1918.
Modernizing the Map (1918 to 1974)
In 1918, the way London's constituencies were drawn up was updated to match the new local boroughs that had been created in 1900. This increased the number of MPs to 62. Later, in 1950, London was divided into 43 constituencies. There were only small changes in 1955.
When Greater London was formed in 1965, the old constituency boundaries didn't quite fit anymore. So, in 1974, new boundaries were drawn. All 92 constituencies were now completely within Greater London, and most were within a single London borough.
London Today (1983 to Present)
The number of constituencies and their boundaries have been updated several times since then. In 1983, London had 84 constituencies. By 1997, this number changed to 74. Since 2010, London has had 73 constituencies. These areas sometimes cross the borders of the local London boroughs to make sure each MP represents a similar number of people.
Recent Election Results (2019)
Here's how people voted in London during the 2019 general election:
| Party | Votes | % of Votes | Change from 2017 | Seats Won | Change in Seats |
|---|---|---|---|---|---|
| Labour | 1,812,810 | 48.1% | 49 | 0 | |
| Conservative | 1,205,129 | 32.0% | 21 | 0 | |
| Liberal Democrats | 562,564 | 14.9% | 3 | 0 | |
| Greens | 115,527 | 3.1% | 0 | 0 | |
| Brexit | 51,735 | 1.4% | N/A | 0 | 0 |
| Others | 18,355 | 0.5% | 0 | 0 | |
| Total | 3,766,120 | 100.0 | 73 |
How Votes Changed Over Time

This chart shows the percentage of votes each main party got in London over many years.
- CON – Conservative Party
- LAB – Labour Party
- LIB – Liberal Party (and later SDP–Liberal Alliance and Liberal Democrats)
- UKIP/Br – UK Independence Party / Brexit Party
- Green – Green Party of England and Wales
Number of Seats Won Over Time

This chart shows how many MP seats each main party won in London over the years.
- CON – Conservative Party
- LAB – Labour Party
- LIB – Liberal Party (and later SDP–Liberal Alliance and Liberal Democrats)
- OTH – Other parties, like the Communist Party or Respect.
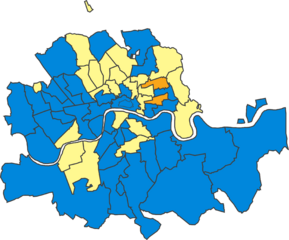
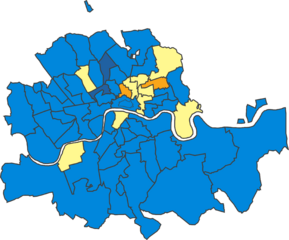
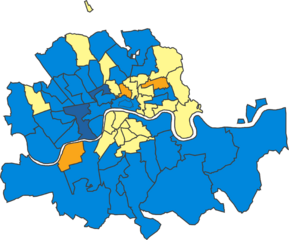
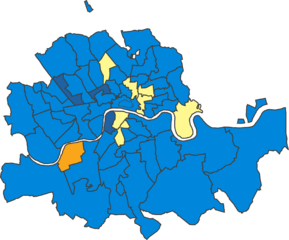
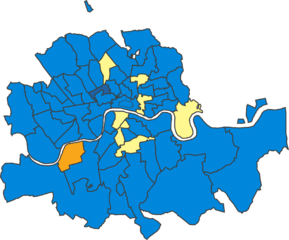
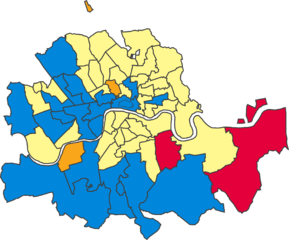
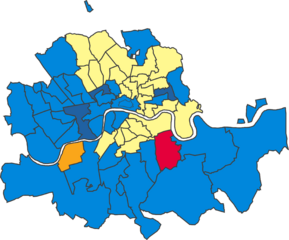
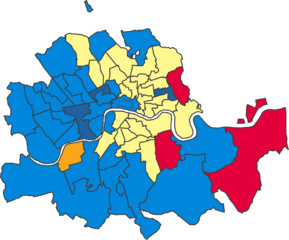
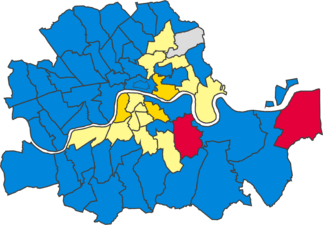
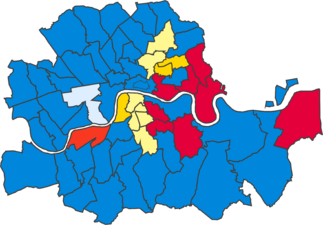
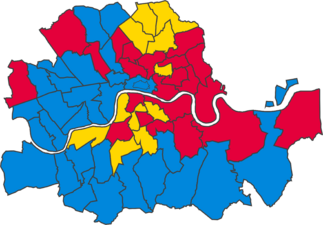
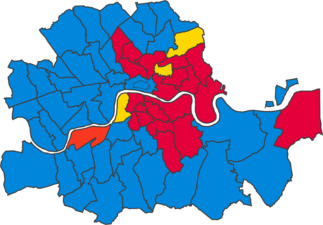
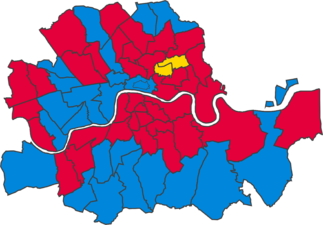
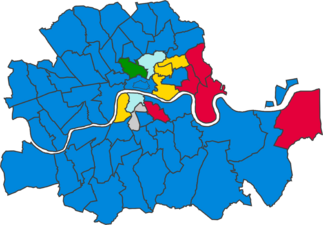
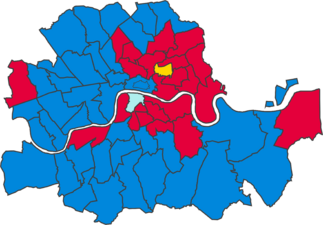
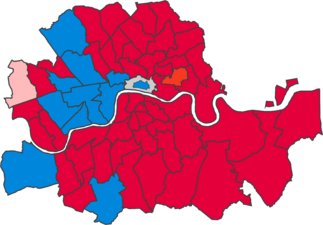
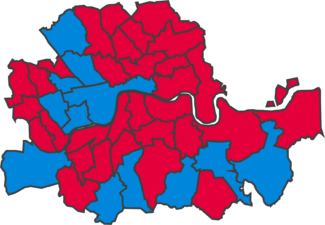
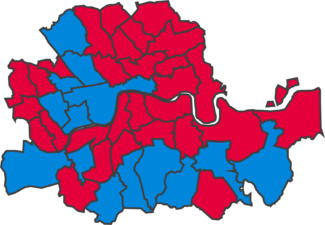
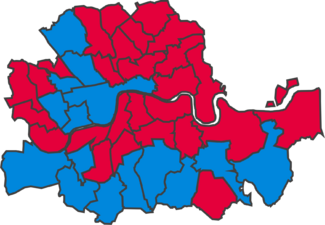
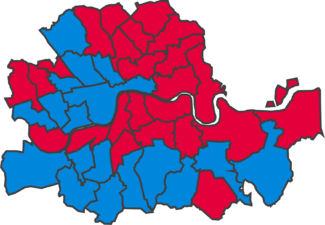
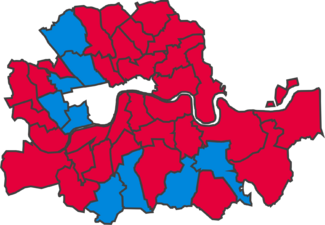
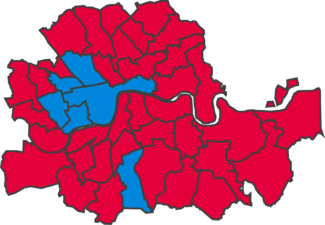
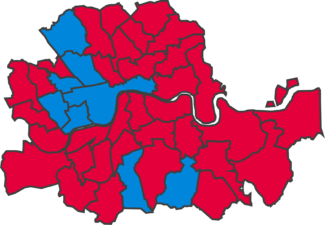
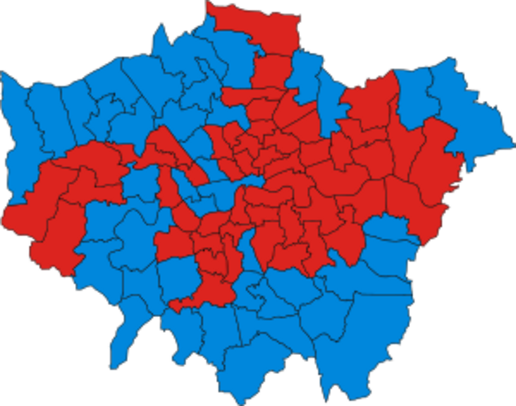
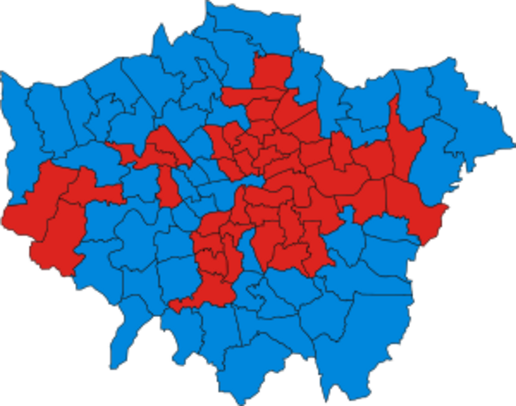
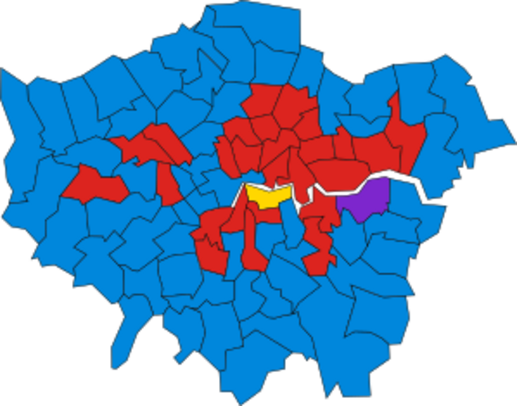
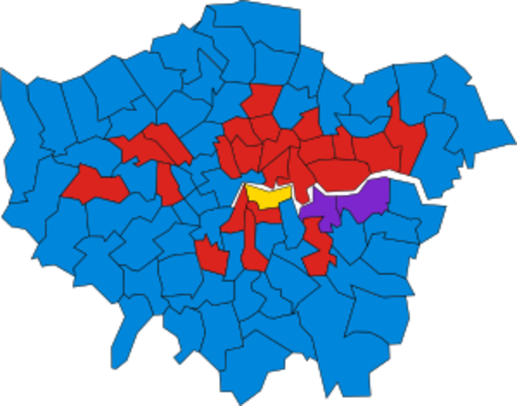
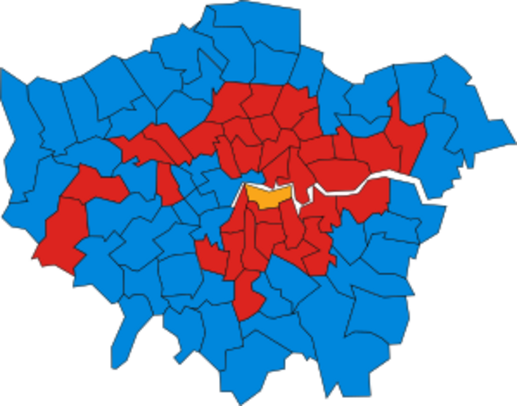
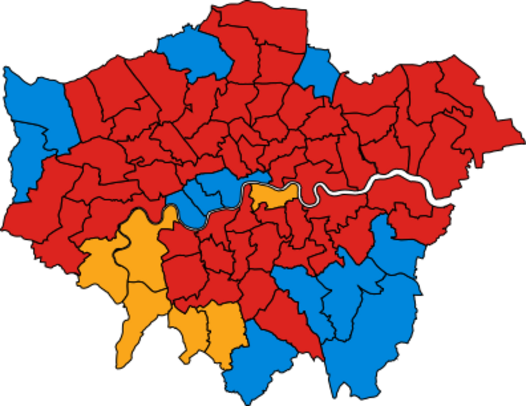
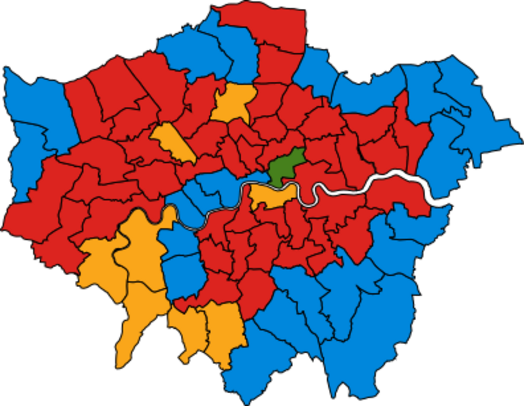
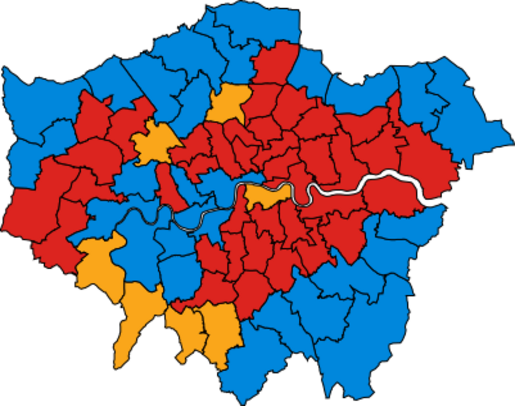
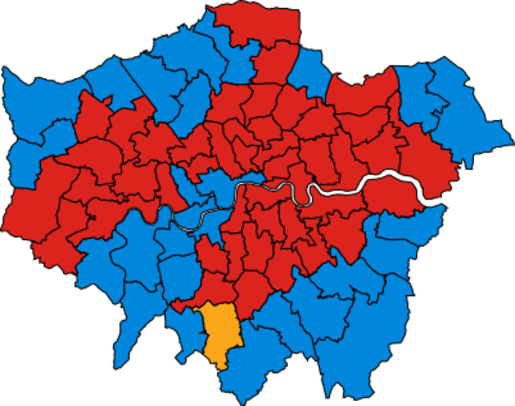
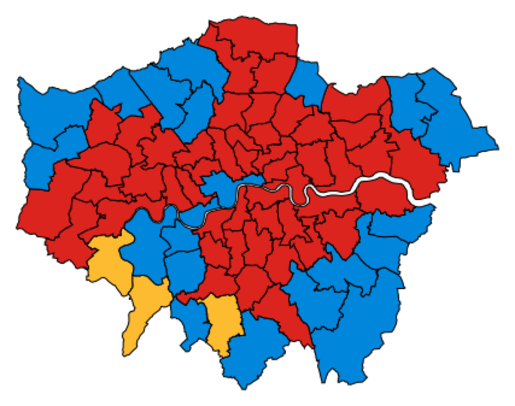
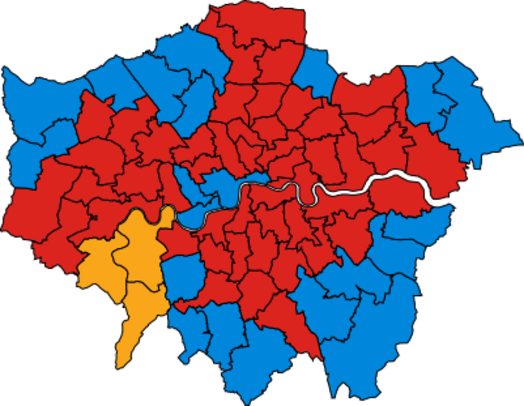
Maps of Election Results
These maps show which party won in different parts of London during past general elections.
-
1885
-
1886
-
1892
-
1895
-
1900
-
1906
-
Jan 1910
-
Dec 1910


-
1918
-
1922
-
1923
-
1924
-
1929
-
1931
-
1935
-
1945


-
1950
-
1951
-
1955
-
1959
-
1964
-
1966
-
1970


-

Feb 1974
-
Oct 1974
-
1979
-
1983
-
1987
-
1992
-
1997
-

2001
-
2005
-
2010
-
2015
-
2017
-
2019


- Red means seats won by MPs from the Labour Party.
- Blue means seats won by MPs from the Conservative Party.
- Amber means seats won by MPs from the Liberal Democrats.
- Green (in 2005) means the seat won by the Respect Party MP, George Galloway.
- Yellow (in 1983 and 1987) means the seat won by the Liberal Party MP, Simon Hughes, who later became a Liberal Democrat MP.
- Purple means the two seats won by MPs from the Social Democratic Party. These MPs were John Cartwright (who used to be Labour), and Rosie Barnes.
Images for kids
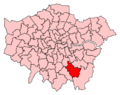
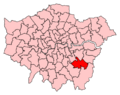
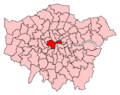
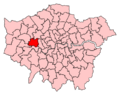
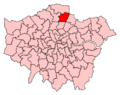
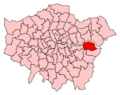
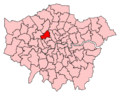
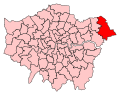
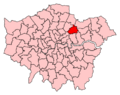
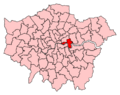
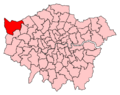
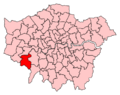
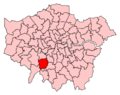
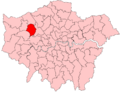
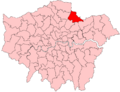
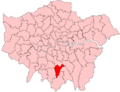
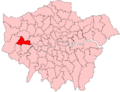
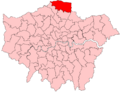
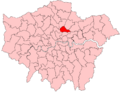
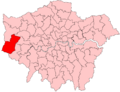
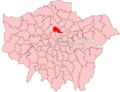
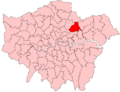
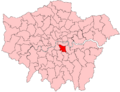
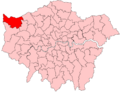
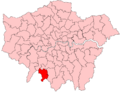
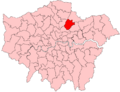
-
Map of Barking constituency
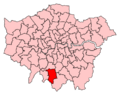
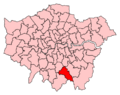
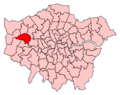
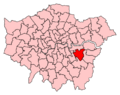
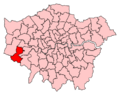
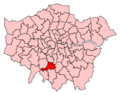
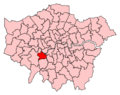
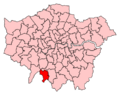
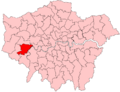
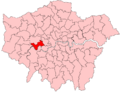
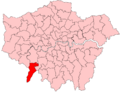
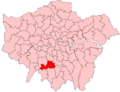
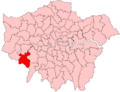
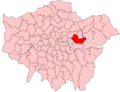
-
Map of Battersea constituency
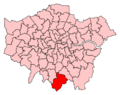
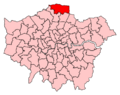
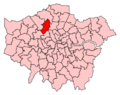
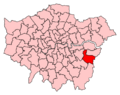
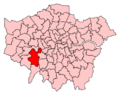
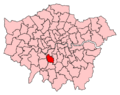
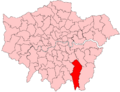
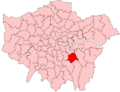
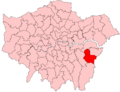
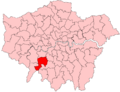
-
Map of Beckenham constituency
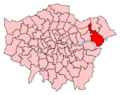
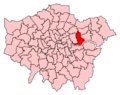
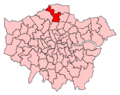
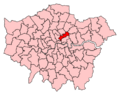
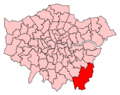
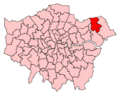
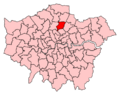
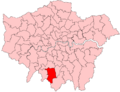
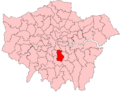
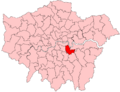
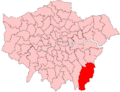
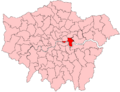
-

Map of Bermondsey and Old Southwark constituency
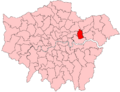
-

Map of Bethnal Green and Bow constituency
-
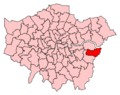
Map of Bexleyheath and Crayford constituency
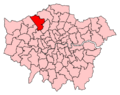
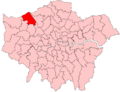
-
Map of Brent Central constituency
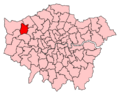
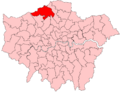
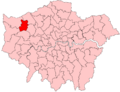
-

Map of Brent North constituency
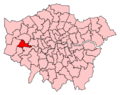
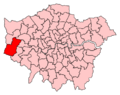
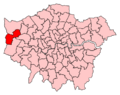
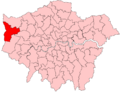
-
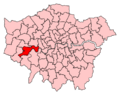
Map of Brentford and Isleworth constituency
-
Map of Bromley and Chislehurst constituency
-

Map of Camberwell and Peckham constituency
-
Map of Carshalton and Wallington constituency
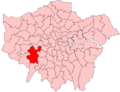
-

Map of Chelsea and Fulham constituency
-
Map of Chingford and Woodford Green constituency
-
Map of Chipping Barnet constituency
-
Map of Cities of London and Westminster constituency
-
Map of Croydon Central constituency
-

Map of Croydon North constituency
-
Map of Croydon South constituency
-
Map of Dagenham and Rainham constituency
-

Map of Dulwich and West Norwood constituency
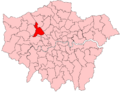
-
Map of Ealing Central and Acton constituency
-
Map of Ealing North constituency
-
Map of Ealing Southall constituency
-
Map of East Ham constituency
-
Map of Edmonton constituency
-
Map of Eltham constituency
-
Map of Enfield North constituency
-
Map of Enfield Southgate constituency
-
Map of Erith and Thamesmead constituency
-
Map of Feltham and Heston constituency
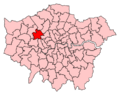
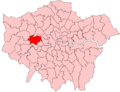
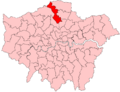
-
Map of Finchley and Golders Green constituency
-

Map of Greenwich and Woolwich constituency
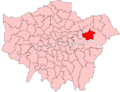
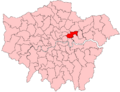
-

Map of Hackney North and Stoke Newington constituency
-
Map of Hackney South and Shoreditch constituency
-

Map of Hammersmith constituency
-
Map of Hampstead and Kilburn constituency
-

Map of Harrow East constituency
-
Map of Harrow West constituency
-
Map of Hayes and Harlington constituency
-
Map of Hendon constituency
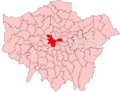
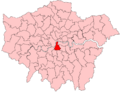
-

Map of Holborn and St Pancras constituency
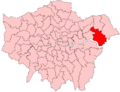
-
Map of Hornchurch and Upminster constituency
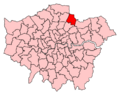
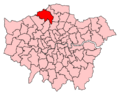
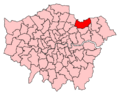
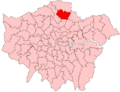
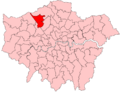
-

Map of Hornsey and Wood Green constituency
-
Map of Ilford North constituency
-

Map of Ilford South constituency
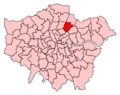
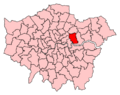
-

Map of Islington North constituency
-

Map of Islington South and Finsbury constituency
-

Map of Kensington constituency
-
Map of Kingston and Surbiton constituency
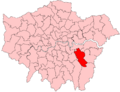
-

Map of Lewisham Deptford constituency
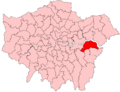
-

Map of Lewisham East constituency
-
Map of Lewisham West and Penge constituency
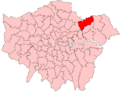
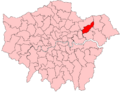
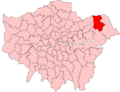
-
Map of Leyton and Wanstead constituency
-
Map of Mitcham and Morden constituency
-
Map of Old Bexley and Sidcup constituency
-
Map of Orpington constituency
-
Map of Poplar and Limehouse constituency
-
Map of Putney constituency
-
Map of Richmond Park constituency
-
Map of Romford constituency
-
Map of Ruislip, Northwood and Pinner constituency
-

Map of Streatham constituency
-
Map of Sutton and Cheam constituency
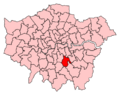
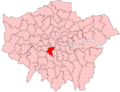
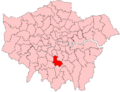
-
Map of Tooting constituency
-
Map of Tottenham constituency
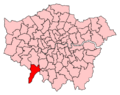
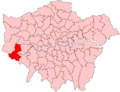
-
Map of Twickenham constituency
-
Map of Uxbridge and South Ruislip constituency
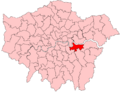
-

Map of Vauxhall constituency
-
Map of Walthamstow constituency
-
Map of West Ham constituency
-

Map of Westminster North constituency
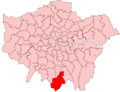
-
Map of Wimbledon constituency
-
Map of Barking 2023 constituency
-
Map of Battersea 2023 constituency
-

Map of Beckenham and Penge 2023 constituency
-

Map of Bermondsey and Old Southwark 2023 constituency
-

Map of Bethnal Green and Stepney 2023 constituency
-

Map of Bexleyheath and Crayford 2023 constituency
-
Map of Brent East 2023 constituency
-
Map of Brent West 2023 constituency
-
Map of Brentford and Isleworth 2023 constituency
-
Map of Bromley and Biggin Hill 2023 constituency
-
Map of Carshalton and Wallington 2023 constituency
-

Map of Chelsea and Fulham 2023 constituency
-
Map of Chingford and Woodford Green 2023 constituency
-
Map of Chipping Barnet 2023 constituency
-
Map of Cities of London and Westminster 2023 constituency
-

Map of Clapham and Brixton Hill 2023 constituency
-

Map of Croydon East 2023 constituency
-
Map of Croydon South 2023 constituency
-
Map of Croydon West 2023 constituency
-
Map of Dagenham and Rainham 2023 constituency
-
Map of Dulwich and West Norwood 2023 constituency
-
Map of Ealing Central and Acton 2023 constituency
-

Map of Ealing North 2023 constituency
-
Map of Ealing Southall 2023 constituency
-
Map of East Ham 2023 constituency
-
Map of Edmonton and Winchmore Hill 2023 constituency
-
Map of Eltham and Chislehurst 2023 constituency
-
Map of Enfield North 2023 constituency
-
Map of Erith and Thamesmead 2023 constituency
-
Map of Feltham and Heston 2023 constituency
-

Map of Finchley and Golders Green 2023 constituency
-
Map of Greenwich and Woolwich 2023 constituency
-
Map of Hackney North and Stoke Newington 2023 constituency
-

Map of Hackney South and Shoreditch 2023 constituency
-
Map of Hammersmith and Chiswick 2023 constituency
-

Map of Hampstead and Highgate 2023 constituency
-
Map of Harrow East 2023 constituency
-
Map of Harrow West 2023 constituency
-
Map of Hayes and Harlington 2023 constituency
-
Map of Hendon 2023 constituency
-

Map of Holborn and St Pancras 2023 constituency
-

Map of Hornchurch and Upminster 2023 constituency
-

Map of Hornsey and Friern Barnet 2023 constituency
-
Map of Ilford North 2023 constituency
-
Map of Ilford South 2023 constituency
-
Map of Islington North 2023 constituency
-

Map of Islington South and Finsbury 2023 constituency
-

Map of Kensington and Bayswater 2023 constituency
-
Map of Kingston and Surbiton 2023 constituency
-
Map of Lewisham East 2023 constituency
-
Map of Lewisham North 2023 constituency
-

Map of Lewisham West and East Dulwich 2023 constituency
-
Map of Leyton and Wanstead 2023 constituency
-
Map of Mitcham and Morden 2023 constituency
-
Map of Old Bexley and Sidcup 2023 constituency
-
Map of Orpington 2023 constituency
-
Map of Peckham 2023 constituency
-
Map of Poplar and Limehouse 2023 constituency
-

Map of Putney 2023 constituency
-

Map of Queen's Park and Maida Vale 2023 constituency
-
Map of Richmond Park 2023 constituency
-
Map of Romford 2023 constituency
-
Map of Ruislip, Northwood and Pinner 2023 constituency
-
Map of Southgate and Wood Green 2023 constituency
-
Map of Stratford and Bow 2023 constituency
-
Map of Streatham and Croydon North 2023 constituency
-
Map of Sutton and Cheam 2023 constituency
-

Map of Tooting 2023 constituency
-

Map of Tottenham 2023 constituency
-
Map of Twickenham 2023 constituency
-
Map of Uxbridge and South Ruislip 2023 constituency
-
Map of Vauxhall and Camberwell Green 2023 constituency
-
Map of Walthamstow 2023 constituency
-
Map of West Ham and Beckton 2023 constituency
-
Map of Wimbledon 2023 constituency


See also
- Constituencies of the Parliament of the United Kingdom
- List of electoral divisions in Greater London
- List of electoral wards in Greater London
- List of London Assembly constituencies
