
Energy in the United States facts for kids

The United States gets its energy from many different places. In 2021, most of this energy came from fossil fuels. About 36% was from petroleum (like oil), 32% from natural gas, and 11% from coal. Nuclear power gave 8% of the energy. Renewable energy sources, like biomass, wind, hydro, solar, and geothermal, made up 12%.
Energy amounts are often measured in BTUs. One BTU is a small amount of heat. A very large amount, 1 quadrillion BTUs (called a quad), is used to talk about the country's total energy.
In 2021, the United States was the second biggest energy producer and user in the world, right after China. Each person in the U.S. used a lot of energy, ranking tenth globally. Most energy was used by factories (33%) and for travel (28%). Homes used 21%, and businesses used 18%.
The U.S. power grid produced almost 4,000 TWh of electricity in 2021. It used 37% of the country's main energy for this. The U.S. is also the second biggest producer and user of electricity. Natural gas became the main source for making electricity in 2016, taking over from coal.
Contents
How Energy Use Changed Over Time


From when the U.S. started until the late 1800s, both the number of people and the energy they used grew steadily. This meant each person used about the same amount of energy. Most of this energy came from wood. The average American burned about eight tons of wood every year!
During the Industrial Revolution, people started using more coal. By the late 1800s, coal became the main energy source because it was cheaper, especially in cities. Coal powered lights, heated homes, and moved trains.
Between 1925 and 1975, coal use didn't grow much, but it was very important for making electricity. Petroleum and natural gas became more popular. This happened as more people owned cars and as many pipelines were built to carry gas.
In the first half of the 1900s, the energy each person used doubled. It kept growing until the late 1960s. After 1979, the amount of energy each person used generally went down.
The U.S. produced less oil starting in 1970. But, the country bought more oil from other places, so people still used a lot. This reliance on imported oil led to problems like the 1973 oil crisis.
Around 2010, many energy trends changed. New ways of getting natural gas, like fracking, helped gas production go up by more than half by 2020. At the same time, coal use dropped by half.
In the 1900s, renewable energy mainly came from hydro power and wood. Since 2000, wind, solar, and biofuels have grown a lot. By 2020, wind power made more electricity than hydro, and biofuels made more energy than wood.
Where U.S. Energy Comes From

The United States is the world's second-largest energy producer. It makes about 16% of the world's energy. Since 2019, the U.S. has been selling more energy to other countries than it buys.
Fossil Fuels
Fossil fuels have been the main source of energy in the U.S. for a long time. They currently make up 79% of all energy produced. They also create most of the carbon pollution. The biggest sources of carbon pollution from energy are petroleum (46%), natural gas (35%), and coal (19%).
Coal
Coal made up 11% of U.S. energy production in 2021. About 90% of this coal was used to make electricity. Coal was very important for electricity from the 1950s to the 1970s. Half of all electricity came from coal until the 2010s.
Coal use peaked in 2006. After that, it started to decline, mostly because natural gas became more popular. The U.S. has the largest coal reserves in the world.
Natural Gas
Dry natural gas was the biggest energy source in the U.S. in 2021, making up 36% of production. It's also the largest source for making electricity, providing 38% of it. Natural gas became the top energy source in 2011 and the top electricity source in 2016.
The United States has been the world's largest producer of natural gas since 2011. This is why gas is often cheaper in the U.S. than in other places like Europe.
Petroleum
Crude oil made up 24% of U.S. energy production in 2021. Oil production has more than doubled since the early 2000s. The U.S. has been the largest producer of crude oil since 2018. Texas produces much more oil than any other state.
Nuclear Power

Nuclear power provided 8.3% of total energy and 18.8% of electricity in 2021. The U.S. made the most nuclear power in the world in 2022.
Nuclear power grew a lot from the 1970s to the 1990s. But new nuclear plants stopped being built after an accident at Three Mile Island. Future growth might come from smaller reactors.
Renewable Energy

Renewable energy sources made up 12.5% of total energy production in the U.S. in 2021. They also provided 20.7% of electricity. This type of energy has grown very fast, doubling between 2000 and 2020. Renewables have made more energy than nuclear power since 2011. They also made more energy than coal in 2020 for the first time in a long time.
Renewable energy is expected to keep growing. Because some of these sources, like wind and solar, don't always produce power, there are plans to use more battery storage to save energy.
Biomass


Biomass made up 5% of total energy production in 2022. About half of this was biofuels, and the other half was wood and waste.
Ethanol was the main biofuel in 2022. The U.S. made more than half of the world's ethanol in 2021. Most gasoline sold in the U.S. has up to 10% ethanol in it.
Factories use most of the wood fuel in the U.S. About a quarter is used in homes. Wood was the main energy source until the late 1800s.
Geothermal

Most geothermal energy in the U.S. in 2021 was used to make electricity. The Geysers in California is the largest geothermal energy area in the world. The U.S. is number one in geothermal power capacity.
Hydro

Hydro power made up 6% of electricity generation in 2021. Three states, Washington, New York, and Oregon, produced over half of all hydro power.
Hydro power has been used in the U.S. since 1880. By 1950, it made 29% of all electricity. While hydro power has stayed strong, its share of total electricity has gone down as other sources have grown. Since 2019, wind power has made more electricity than hydro.
The Grand Coulee Dam in Washington is the largest hydro plant in the U.S. and one of the biggest in the world.
Solar

Solar energy made up 4% of electricity generation in 2021. Since 2006, solar has been the fastest growing energy source in the U.S., growing about 50% each year.
The U.S. grid produced the second most solar power in the world in 2021, after China. Large solar farms are found in states like California, Texas, and Nevada.
Wind

Wind energy made up 9% of electricity generation in 2021. Four states, Texas, Iowa, California, and Kansas, produced over half of all wind power.
Wind power has grown a lot in the U.S. since 1998. The U.S. grid produces much more wind power than Germany or India, but less than China.
How Energy is Used

[[Image frame|width=300|content=
.jpg)

.jpg) |caption=Examples of energy use: a refinery (industry), a house (residential), a car (transportation), and an office (commercial)|align=right]]
|caption=Examples of energy use: a refinery (industry), a house (residential), a car (transportation), and an office (commercial)|align=right]]
Factories and businesses have always been the biggest energy users in the U.S. They used 33% of all energy in 2021. This energy was split between natural gas, electricity, and petroleum. The chemical industry and oil refining used the most energy.
Transportation used 28% of energy. Almost all of this was from petroleum, like gasoline for cars and diesel for trucks. Jet fuel for airplanes also used a lot. Biofuels like ethanol made up 5%, and natural gas was 4%.
Homes, offices, and other businesses use a lot of electricity. In homes, most energy is used for heating (34%) and water heating (19%). Businesses use similar amounts for cooling and refrigeration, but more for lighting and cooking.
Most homes in the U.S. are single-family houses. These use almost three times more energy than apartments in larger buildings. However, single-family homes are usually bigger and have more people living in them.
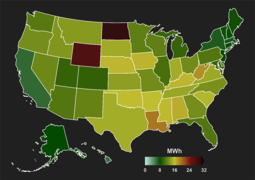
Energy Use Across States
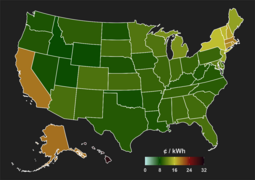
The state that uses the least energy per person is Rhode Island. The state that uses the most is Louisiana. Usually, states that use less energy pay higher prices for it. For example, Hawaii uses little energy but pays the highest prices.
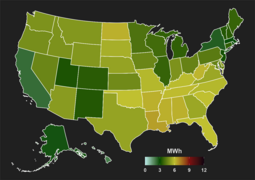
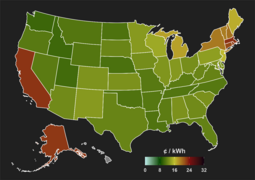
Energy use in homes also changes by region. Homes in the Northeast use more energy than those in the West. This is partly because the Northeast has colder weather.
-
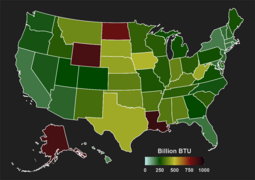
Total energy use per person
-
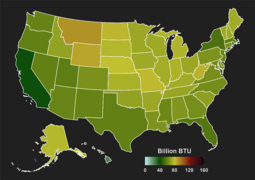
Home energy use per person
-
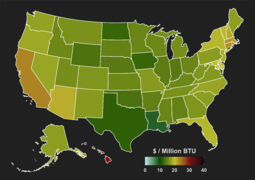
Total energy price per unit
-
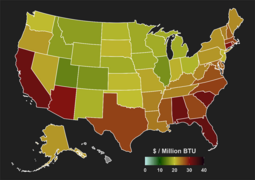
Home energy price per unit


How cities are built also affects energy use. Townhouses use less energy than single-family homes because they share walls. Neighborhoods where people can walk or bike more also use less energy for transportation.
Electricity in the U.S.

The United States is the world's second-largest producer and user of electricity. It makes about 15% of the world's electricity.
The U.S. produced almost 4,000 TWh of electricity in 2021. This amount has stayed about the same since 2010.
Fossil fuels made most of the electricity. Natural gas provided 38%, and coal provided 23%. Natural gas has been growing as a source since the 1990s. It became the top fossil fuel for electricity in 2016.
Nuclear power provided 20% of electricity. This has been steady since about 1990. Nuclear power made more electricity than coal for the first time in 2020.
Among renewables, wind and solar power kept growing. Wind power made more electricity than hydro power since 2019. Renewable energy use doubled from 2010 to 2020, reaching 21% of all electricity made.
-
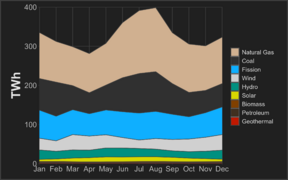
Monthly electricity by source
-
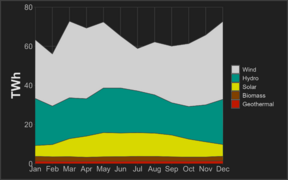
Monthly renewable electricity by source
-
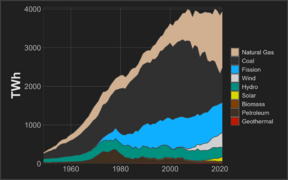
Yearly electricity by source
-
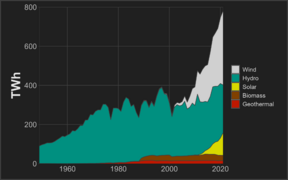
Yearly renewable electricity by source


Power Grid and Plants
The U.S. power grid had a total capacity of 1,213 GW in 2021. This is the maximum amount of electricity it can produce.
The U.S. grid first connected the East and West coasts in 1967. There are over 7,300 power plants and almost 160,000 miles of high-voltage power lines.
|
|


Electricity by State

In most states, natural gas is the biggest source of electricity. Among renewable sources, wind power is the largest in 18 states.
Texas makes more electricity than any other state. It is followed by Florida, Pennsylvania, and California. Pennsylvania sells the most power to other states, while California buys the most.
-
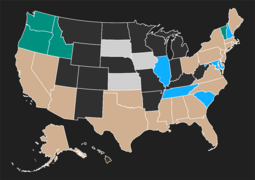
Biggest electricity source in each state
-
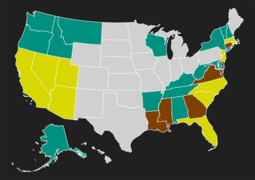
Biggest renewable electricity source in each state
-
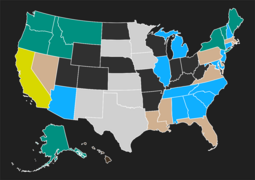
Most over-represented source in each state
-
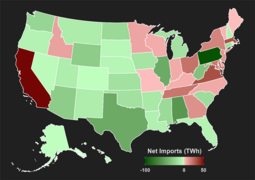
How much electricity states import or export


How Electricity is Used

People in the U.S. used 3,806 TWh of electricity in 2021. This amount has stayed about the same since 2010. Each person used less electricity in 2021 than in 2007.
Homes used 39% of all electricity. Businesses used 35%, and factories used 26%. Transportation used very little.
The northeastern U.S. has usually paid the highest prices for electricity. At the same time, people there use the least electricity per person. California is different from its neighbors in the West. It pays some of the highest electricity rates in the country.
-
Total electricity use per person
-
Home electricity use per person
-
Total electricity price per kWh
-
Home electricity price per kWh


See also
- Energy conservation in the United States
- Energy policy of the United States
- World energy resources
- World energy consumption
- List of countries by energy consumption and production
- List of U.S. states by electricity production from renewable sources
Images for kids
-
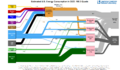
U.S. energy flow, 2022. This shows how energy moves from sources to uses, and how some energy is lost as waste heat.

