Hancock County, Indiana facts for kids
Quick facts for kids
Hancock County
|
|
|---|---|
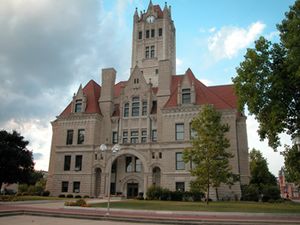
Hancock County courthouse in Greenfield
|
|
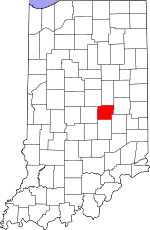
Location within the U.S. state of Indiana
|
|
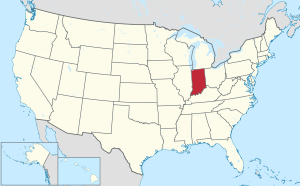 Indiana's location within the U.S. |
|
| Country | |
| State | |
| Founded | March 1, 1828 |
| Named for | John Hancock |
| Seat | Greenfield |
| Largest city | Greenfield |
| Area | |
| • Total | 307.02 sq mi (795.2 km2) |
| • Land | 306.02 sq mi (792.6 km2) |
| • Water | 1.01 sq mi (2.6 km2) 0.33%% |
| Population
(2020)
|
|
| • Total | 79,840 |
| • Density | 260.048/sq mi (100.405/km2) |
| Time zone | UTC−5 (Eastern) |
| • Summer (DST) | UTC−4 (EDT) |
| Congressional district | 6th |
| Indiana county number 30 | |
Hancock County is a cool place in Indiana, a state in the United States. In 2020, about 79,840 people lived here. The main city, where the county government is, is called Greenfield.
Hancock County is part of a bigger area that includes the cities of Indianapolis, Carmel, and Anderson. This whole area is called the Indianapolis Metropolitan Statistical Area.
Contents
Exploring Hancock County's Geography
Hancock County has gentle, rolling hills that slope down towards the south and southwest. These hills have been shaped by natural water flows. Most of the land is used for farming or for cities and towns. The highest spot in the county is near Shirley, about 1,040 feet (317 meters) above sea level.
In 2010, the county covered a total area of about 307 square miles (795 square kilometers). Almost all of this area, about 306 square miles (792 square kilometers), is land. Only a small part, about 1 square mile (2.6 square kilometers), is water.
Neighboring Counties Around Hancock
Hancock County shares its borders with several other counties:
- Madison County to the north
- Henry County to the east
- Rush County to the southeast
- Shelby County to the south
- Marion County to the west
- Hamilton County to the northwest
Main Roads in Hancock County
Many important roads run through Hancock County, helping people travel easily.
 Interstate 70
 U.S. Route 36
 U.S. Route 40
 U.S. Route 52
 State Road 9
 State Road 13
 State Road 67
 State Road 109
 State Road 234
 State Road 238
Local Airport
- KMQJ - Indianapolis Regional Airport is located here.
A Look Back at Hancock County's History
Indiana became a state in the United States on December 11, 1816. At that time, Native American tribes still owned much of the land. Over time, through different agreements, these lands became part of the state.
One important agreement was the 1818 Treaty with the Delaware Indians. This treaty brought most of central Indiana under state control. Soon after, Madison County was created from some of this new land.
As more people moved into the southern part of Madison County, they wanted their own local government. So, on March 1, 1828, a part of Madison County was separated to form Hancock County. The town of Greenfield was chosen as the county seat on April 11.
The county was named after John Hancock. He was a very important person who signed the Declaration of Independence in 1776. He signed his name very largely, so everyone could see it! Hancock County has kept the same borders since it was created in 1828.
Hancock County's Climate and Weather
| Weather chart for Greenfield, Indiana | |||||||||||||||||||||||||||||||||||||||||||||||
|---|---|---|---|---|---|---|---|---|---|---|---|---|---|---|---|---|---|---|---|---|---|---|---|---|---|---|---|---|---|---|---|---|---|---|---|---|---|---|---|---|---|---|---|---|---|---|---|
| J | F | M | A | M | J | J | A | S | O | N | D | ||||||||||||||||||||||||||||||||||||
|
2.5
34
17
|
2.4
39
20
|
3.3
50
30
|
4.1
62
40
|
4.7
73
51
|
4.5
82
61
|
4.9
85
64
|
4
84
62
|
3.2
78
55
|
3.1
65
43
|
3.9
51
33
|
3.1
39
23
|
||||||||||||||||||||||||||||||||||||
| temperatures in °F precipitation totals in inches source: The Weather Channel |
|||||||||||||||||||||||||||||||||||||||||||||||
|
Metric conversion
|
|||||||||||||||||||||||||||||||||||||||||||||||
The weather in Greenfield changes throughout the year. In January, the average temperature is around 17°F (-8°C). In July, it gets warmer, with an average high of 85°F (29°C).
The coldest temperature ever recorded was -29°F (-34°C) in January 1985. The hottest was 103°F (39°C) in June 1988. The amount of rain also changes. February usually has about 2.37 inches (60 mm) of rain. July is often the wettest month, with about 4.85 inches (123 mm) of rain.
Learning and Libraries in Hancock County
Hancock County has two library systems to help people learn and read. These are the Fortville-Vernon Township Public Library and the Hancock County Public Library.
The county also has several school districts for students:
- Eastern Hancock County Community School Corporation
- Greenfield-Central Community Schools
- Mount Vernon Community School Corporation
- Southern Hancock County Community School Corporation
Hancock County's Population Over Time
| Historical population | |||
|---|---|---|---|
| Census | Pop. | %± | |
| 1830 | 1,436 | — | |
| 1840 | 7,535 | 424.7% | |
| 1850 | 9,698 | 28.7% | |
| 1860 | 12,802 | 32.0% | |
| 1870 | 15,123 | 18.1% | |
| 1880 | 17,123 | 13.2% | |
| 1890 | 17,829 | 4.1% | |
| 1900 | 19,189 | 7.6% | |
| 1910 | 19,030 | −0.8% | |
| 1920 | 17,210 | −9.6% | |
| 1930 | 16,605 | −3.5% | |
| 1940 | 17,302 | 4.2% | |
| 1950 | 20,332 | 17.5% | |
| 1960 | 26,665 | 31.1% | |
| 1970 | 35,096 | 31.6% | |
| 1980 | 43,939 | 25.2% | |
| 1990 | 45,527 | 3.6% | |
| 2000 | 55,391 | 21.7% | |
| 2010 | 70,002 | 26.4% | |
| 2020 | 79,840 | 14.1% | |
| 2023 (est.) | 86,166 | 23.1% | |
| US Decennial Census 1790-1960 1900-1990 1990-2000 2010-2013 |
|||
Hancock County in 2020: A Snapshot
In 2020, the 2020 United States Census counted 79,840 people living in Hancock County.
| Race | Num. | Perc. |
|---|---|---|
| White (NH) | 71,106 | 89% |
| Black or African American (NH) | 2,346 | 3% |
| Native American (NH) | 121 | 0.15% |
| Asian (NH) | 734 | 0.9% |
| Pacific Islander (NH) | 42 | 0.05% |
| Other/Mixed (NH) | 3,289 | 4.1% |
| Hispanic or Latino | 2,202 | 2.75% |
Hancock County in 2010: Population Details
The 2010 United States Census showed that 70,002 people lived in Hancock County. There were 26,304 households, with 19,792 of them being families. On average, there were about 229 people per square mile.
Most people in the county were white (95.2%). About 2.1% were black or African American, and 0.8% were Asian. About 1.7% of the population was of Hispanic or Latino origin. Many people had German (26.2%), Irish (13.9%), or English (11.8%) backgrounds.
About 37.2% of households had children under 18 living with them. Most households (61.0%) were married couples. The average age of people in the county was 39.1 years.
The average income for a household was $47,697. For families, it was $69,734. About 7.3% of all people in the county lived below the poverty line. This included 8.0% of those under 18.
Cities and Towns in Hancock County
Hancock County is home to several cities and towns:
- Cumberland (partly in Marion County)
- Fortville
- Greenfield
- McCordsville
- New Palestine
- Shirley (partly in Henry County)
- Spring Lake
- Wilkinson
Townships of Hancock County
The county is divided into smaller areas called townships:
- Blue River
- Brandywine
- Brown
- Buck Creek
- Center
- Green
- Jackson
- Sugar Creek
- Vernon
Smaller Communities in Hancock County
There are also many smaller, unincorporated communities:
- Carrollton
- Charlottesville (partly in Rush County)
- Cleveland
- Eden
- Finly (also known as Carrollton)
- Gem
- Maxwell
- Milners Corner
- Mohawk
- Mount Comfort
- Nashville
- Philadelphia
- Pleasant Acres
- Riley
- Stringtown
- Warrington
- Westland
- Willow Branch
- Woodbury
Images for kids
See also
 In Spanish: Condado de Hancock (Indiana) para niños
 | John T. Biggers |
 | Thomas Blackshear |
 | Mark Bradford |
 | Beverly Buchanan |


