List of U.S. states and territories by African-American population facts for kids
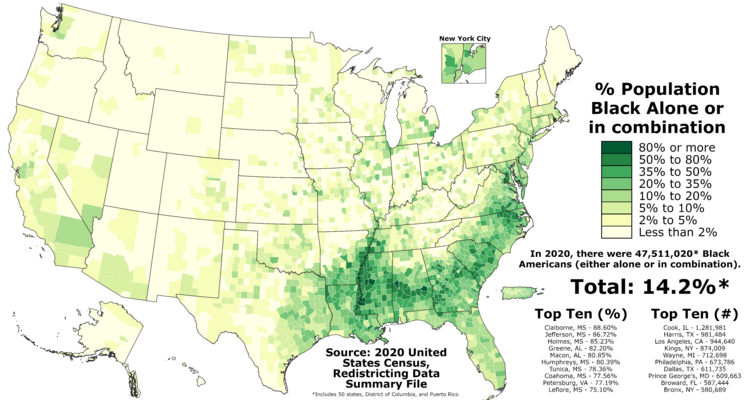
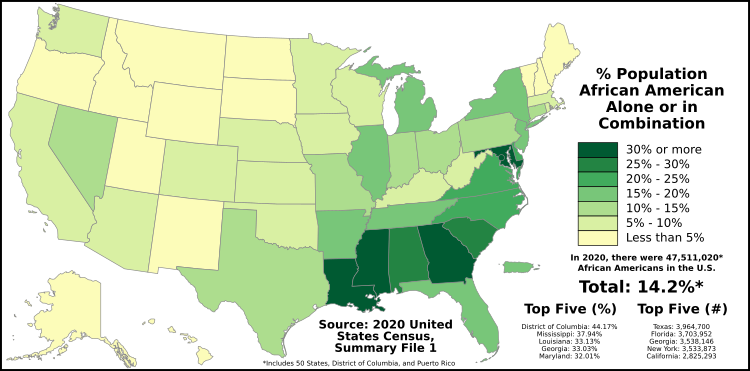
African Americans are a big part of the United States' population. This article looks at how many people identify as African American in different U.S. states, territories, and the District of Columbia. We'll use information from the 2020 U.S. Census.
In 2020, about 12.4% of people in the U.S. said they were "Black" and no other race. If you include people who said they were "Black" and also another race, the percentage goes up to about 14.2%.

Contents
African American Population in 2020
The table below shows the places with the highest percentage of people who identify as Black or African American, either alone or combined with another race, according to the 2020 census.
| % Black or African American alone or in combination |
Rank | State or territory | Black or African American alone Population (2020) |
|---|---|---|---|
| 76.0% | 1 | 80,908 | |
| 44.17% | 2 | 385,810 | |
| 37.94% | 3 | 1,084,481 | |
| 33.13% | 4 | 1,564,023 | |
| 33.03% | 5 | 3,538,146 | |
| 32.01% | 6 | 2,220,472 | |
| 29.80% | 7 | 1,696,162 | |
| 27.09% | 8 | 1,680,531 | |
| 23.50% | 9 | 2,350,217 | |
| 22.11% | 10 | 218,899 | |
| 14.20% | - | 47,511,020 |
African American Population Over Time (1790–2020)
For many years, from 1787 to 1868, the U.S. Census counted enslaved African Americans in a special way. This was part of something called the Three-fifths Compromise. This agreement was made when the U.S. Constitution was being written. It decided that each enslaved person would count as three-fifths of a person for two main reasons:
- To figure out how many representatives each state would have in the U.S. House of Representatives.
- To decide how much each state would pay in taxes (though this tax part was never actually used).
Even though enslaved people couldn't vote, this compromise gave Southern states more power in Congress and more votes for president. Free Black people and indentured servants (people who worked to pay off a debt) were counted as full people.
The Three-fifths Compromise was part of the original U.S. Constitution. But in 1868, the Fourteenth Amendment changed this rule, and the compromise was officially ended.
The chart below shows how the percentage of African Americans in the total population has changed over time in the U.S. and in some specific states. You can see how these numbers have shifted from 1790 all the way to 2020.
Free Black Population (1790–1860)
In 1865, the Thirteenth Amendment made all enslaved Black people in the U.S. free. However, some states had already freed some or all of their Black population before that.
The table below shows the percentage of free Black people compared to the total Black population in different U.S. regions and states between 1790 and 1860. If a spot is blank, it means there's no data for that area or year.
| State/territory | 1790 | 1800 | 1810 | 1820 | 1830 | 1840 | 1850 | 1860 |
|---|---|---|---|---|---|---|---|---|
| 7.9% | 10.8% | 13.5% | 13.2% | 13.7% | 13.4% | 11.9% | 11.0% | |
| Northeast | 40.1% | 56.2% | 73.5% | 83.7% | 97.8% | 99.5% | 99.8% | 100.0% |
| Midwest | 78.7% | 52.4% | 38.0% | 37.7% | 34.4% | 35.5% | 37.6% | |
| South | 4.7% | 6.7% | 8.5% | 8.2% | 8.4% | 8.1% | 7.0% | 6.3% |
| West | 97.9% | 99.4% | ||||||
| 4.4% | 2.2% | 1.3% | 1.3% | 0.8% | 0.7% | 0.6% | ||
| 100.0% | ||||||||
| 1.4% | 3.5% | 3.0% | 2.3% | 1.3% | 0.1% | |||
| 100.0% | 100.0% | |||||||
| 100.0% | ||||||||
| 50.4% | 84.9% | 95.4% | 98.8% | 99.7% | 99.8% | 100.0% | 100.0% | |
| 30.5% | 57.3% | 75.9% | 74.2% | 82.8% | 86.7% | 88.8% | 91.7% | |
| 16.2% | 30.7% | 37.9% | 50.5% | 66.2% | 73.2% | 77.8% | ||
| 5.2% | 3.1% | 2.3% | 1.5% | |||||
| 1.3% | 1.7% | 1.7% | 1.2% | 1.1% | 1.0% | 0.8% | 0.8% | |
| 41.5% | 78.5% | 33.3% | 68.7% | 91.6% | 100.0% | 100.0% | ||
| 75.7% | 62.4% | 86.6% | 99.9% | 100.0% | 100.0% | 100.0% | ||
| 91.5% | 100.0% | 100.0% | ||||||
| 99.7% | ||||||||
| 0.9% | 1.8% | 2.1% | 2.1% | 2.9% | 3.9% | 4.5% | 4.5% | |
| 18.0% | 13.2% | 13.2% | 13.1% | 6.7% | 5.3% | |||
| 100.0% | 100.0% | 100.0% | 100.0% | 99.8% | 100.0% | 100.0% | 100.0% | |
| 7.2% | 15.6% | 23.3% | 27.0% | 33.9% | 40.9% | 45.3% | 49.1% | |
| 100.0% | 100.0% | 100.0% | 100.0% | 100.0% | 100.0% | 100.0% | 100.0% | |
| 100.0% | 83.3% | 100.0% | 99.6% | 100.0% | 100.0% | 100.0% | ||
| 100.0% | 100.0% | |||||||
| 5.0% | 1.2% | 1.4% | 0.8% | 0.7% | 0.3% | 0.2% | ||
| 17.4% | 3.3% | 2.2% | 2.6% | 2.9% | 3.0% | |||
| 81.7% | ||||||||
| 100.0% | ||||||||
| 79.9% | 100.0% | 100.0% | 100.0% | 99.5% | 99.8% | 100.0% | 100.0% | |
| 19.5% | 26.2% | 42.0% | 62.2% | 89.0% | 96.9% | 99.0% | 99.9% | |
| 100.0% | 100.0% | |||||||
| 17.9% | 33.3% | 62.8% | 74.4% | 99.8% | 100.0% | 100.0% | 100.0% | |
| 4.7% | 5.0% | 5.7% | 6.7% | 7.4% | 8.5% | 8.7% | 8.4% | |
| 100.0% | 100.0% | 100.0% | 99.9% | 100.0% | 100.0% | 100.0% | ||
| 100.0% | 100.0% | |||||||
| 63.6% | 89.5% | 96.6% | 99.3% | 98.9% | 99.9% | 100.0% | 100.0% | |
| 78.2% | 89.7% | 97.1% | 98.7% | 99.5% | 99.8% | 100.0% | 100.0% | |
| 1.7% | 2.1% | 2.3% | 2.6% | 2.4% | 2.5% | 2.3% | 2.4% | |
| N/A | ||||||||
| 9.6% | 2.2% | 2.9% | 3.3% | 3.1% | 2.9% | 2.6% | 2.6% | |
| 0.7% | 0.2% | |||||||
| 48.0% | 50.8% | |||||||
| 100.0% | 100.0% | 100.0% | 100.0% | 100.0% | 100.0% | 100.0% | 100.0% | |
| 4.1% | 5.6% | 7.3% | 8.2% | 9.3% | 10.1% | 10.2% | 10.5% | |
| 100.0% | 100.0% | |||||||
| 11.6% | 6.8% | 10.5% | 8.5% | 10.9% | 14.1% | 13.1% | 13.1% | |
| 100.0% | 51.6% | 94.4% | 100.0% | 100.0% | ||||
See also
 | Toni Morrison |
 | Barack Obama |
 | Martin Luther King Jr. |
 | Ralph Bunche |


