List of U.S. states and territories by GDP facts for kids
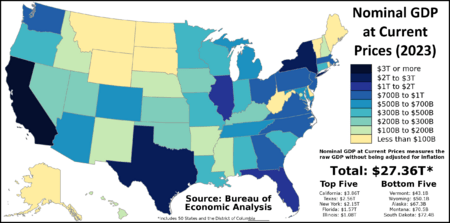
This article is about the gross domestic product (GDP) of each U.S. state and territory. GDP is a way to measure how much money a state or country makes. It shows the total value of all the goods and services produced there. Think of it as the total income for a whole state.
The information here comes from the Bureau of Economic Analysis (BEA) for the year 2023. The BEA says that a state's GDP is the total "value added" from all the different industries in that state. This means adding up the value created by everything from farming to making cars to selling software.
When we talk about "nominal GDP," it means the GDP is measured using current prices. This number doesn't consider how much things cost in different places. For example, living in New York City is much more expensive than living in a small town. Also, nominal GDP can change a lot from year to year because of changes in money exchange rates. These changes might not mean people's lives are getting better or worse.
In 2023, the total nominal GDP for the entire United States was about $27.36 trillion. This was more than the $25.74 trillion in 2022.
The states with the highest GDPs in 2023 were California ($3.8 trillion), Texas ($2.56 trillion), and New York ($2.15 trillion). The states with the lowest GDPs were Vermont ($43.1 billion), Wyoming ($50.1 billion), and Alaska ($67.1 billion).
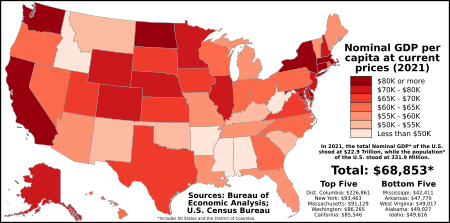
GDP per capita is the GDP divided by the number of people. It shows how much GDP is produced per person. In 2022, New York ($105,226), Massachusetts ($99,274), and North Dakota ($96,461) had the highest GDP per person. The lowest were Mississippi ($47,572), Arkansas ($54,644), and West Virginia ($54,870). The District of Columbia had a much higher GDP per person at $242,853.
GDP of U.S. States and Washington, D.C.
This list shows the yearly nominal gross domestic product for each of the 50 U.S. states and Washington, D.C., which is the capital of the United States. It also shows how much the GDP changed and the GDP per person for 2023.
The total for the United States in this table does not include U.S. territories. The GDP numbers below are in millions of U.S. Dollars. * means there are links to more information about the "GDP of STATE or FEDERAL DISTRICT" or "Economy of STATE or FEDERAL DISTRICT."
| State or federal district |
Nominal GDP at current prices 2023 (millions of U.S. dollars)
|
Annual GDP change at current prices (2022–2023)
|
Real GDP
growth rate (2022–2023) |
Nominal GDP per capita
|
% of national | ||||
|---|---|---|---|---|---|---|---|---|---|
| 2022 | 2023 | 2022 | 2023 | 2022 | 2023 | ||||
| 3,641,643 | 3,862,171 | $92,190 | $100,038 | 14.69% | 14.11% | ||||
| 2,402,137 | 2,563,508 | $78,456 | $85,110 | 8.69% | 9.37% | ||||
| 2,048,403 | 2,152,262 | $104,344 | $110,781 | 8.11% | 7.86% | ||||
| 1,439,065 | 1,579,503 | $62,446 | $70,557 | 5.37% | 5.77% | ||||
| 1,025,667 | 1,082,968 | $82,126 | $87,033 | 4.11% | 3.96% | ||||
| 911,813 | 965,067 | $71,160 | $75,189 | 3.67% | 3.53% | ||||
| 825,990 | 872,748 | $69,978 | $74,739 | 3.22% | 3.19% | ||||
| 767,378 | 805,397 | $69,253 | $73,558 | 2.99% | 2.94% | ||||
| 754,948 | 799,305 | $80,490 | $86,847 | 2.94% | 2.92% | ||||
| 715,968 | 766,919 | $68,243 | $71,373 | 2.87% | 2.80% | ||||
| 738,101 | 801,515 | $93,193 | $103,462 | 2.92% | 2.93% | ||||
| 691,461 | 733,860 | $98,609 | $105,884 | 2.79% | 2.68% | ||||
| 663,106 | 707,085 | $74,789 | $81,794 | 2.59% | 2.59% | ||||
| 622,563 | 658,992 | $61,859 | $66,198 | 2.49% | 2.41% | ||||
| 491,289 | 520,389 | $82,954 | $89,469 | 1.85% | 1.90% | ||||
| 485,657 | 523,240 | $67,473 | $74,081 | 1.83% | 1.91% | ||||
| 480,113 | 512,280 | $76,279 | $83,565 | 1.92% | 1.87% | ||||
| 475,654 | 508,344 | $62,365 | $68,965 | 1.80% | 1.86% | ||||
| 470,324 | 497,036 | $66,698 | $73,047 | 1.84% | 1.82% | ||||
| 448,032 | 471,820 | $78,100 | $82,885 | 1.80% | 1.72% | ||||
| 396,209 | 413,967 | $68,192 | $70,569 | 1.60% | 1.51% | ||||
| 396,890 | 422,306 | $63,126 | $68,623 | 1.58% | 1.54% | ||||
| 319,345 | 340,181 | $88,760 | $94,876 | 1.30% | 1.24% | ||||
| 297,309 | 316,461 | $70,548 | $75,477 | 1.17% | 1.15% | ||||
| 297,546 | 322,259 | $56,066 | $60,550 | 1.18% | 1.18% | ||||
| 291,952 | 309,601 | $61,313 | $68,507 | 1.12% | 1.13% | ||||
| 281,569 | 300,152 | $54,753 | $59,174 | 1.08% | 1.10% | ||||
| 258,981 | 277,747 | $57,653 | $61,961 | 1.03% | 1.01% | ||||
| 256,370 | 272,586 | $73,424 | $80,476 | 0.96% | 0.99% | ||||
| 242,739 | 254,134 | $59,894 | $63,390 | 0.90% | 0.93% | ||||
| 238,342 | 248,923 | $72,221 | $78,209 | 0.96% | 0.91% | ||||
| 222,939 | 239,398 | $67,962 | $75,585 | 0.84% | 0.87% | ||||
| 209,326 | 226,012 | $71,729 | $78,348 | 0.84% | 0.83% | ||||
| 165,989 | 176,240 | $54,259 | $57,657 | 0.63% | 0.64% | ||||
| 164,934 | 178,421 | $82,207 | $91,553 | 0.66% | 0.65% | ||||
| 165,061 | 174,796 | $242,853 | $259,938 | 0.67% | 0.64% | ||||
| 139,976 | 146,401 | $47,190 | $49,911 | 0.55% | 0.54% | ||||
| 125,541 | 130,202 | $57,792 | $62,209 | 0.48% | 0.47% | ||||
| 110,871 | 118,791 | $56,496 | $60,980 | 0.41% | 0.43% | ||||
| 105,025 | 111,102 | $75,565 | $79,929 | 0.43% | 0.41% | ||||
| 101,083 | 108,023 | $68,207 | $75,946 | 0.39% | 0.40% | ||||
| 97,417 | 99,511 | $53,852 | $56,630 | 0.38% | 0.36% | ||||
| 90,208 | 93,595 | $85,977 | $91,207 | 0.35% | 0.34% | ||||
| 85,801 | 91,081 | $61,008 | $65,785 | 0.33% | 0.33% | ||||
| 72,651 | 74,113 | $94,021 | $95,082 | 0.28% | 0.27% | ||||
| 72,771 | 77,322 | $65,362 | $71,122 | 0.29% | 0.28% | ||||
| 68,782 | 72,421 | $74,268 | $79,412 | 0.27% | 0.26% | ||||
| 67,072 | 70,560 | $57,945 | $62,753 | 0.26% | 0.26% | ||||
| 65,699 | 67,337 | $86,722 | $92,272 | 0.24% | 0.25% | ||||
| 49,081 | 50,172 | $81,586 | $86,880 | 0.18% | 0.18% | ||||
| 40,831 | 43,130 | $62,771 | $67,006 | 0.16% | 0.16% | ||||
| 25,744,108 | 27,360,935 | $77,190 | $81,630 | 100% | 100% | ||||
GDP of U.S. Territories
The Bureau of Economic Analysis (BEA) also gathers GDP information for four U.S. territories. These are American Samoa, Guam, the Northern Mariana Islands, and the U.S. Virgin Islands. This data is kept separate from the states and Washington, D.C. The numbers for these territories come from the World Bank.
| Territory | Nominal GDP at Current Prices (millions of U.S. dollars) |
Real GDP growth rate | GDP per capita | Year of reference |
|---|---|---|---|---|
| $115,799 | $37,170 | 2023 | ||
| $6,910 | $40,807 | 2022 | ||
| $4,444 | $41,976 | 2021 | ||
| $858 | $17,302 | 2020 | ||
| $871 | $19,673 | 2022 |
See also
 In Spanish: Anexo:Estados de los Estados Unidos por PIB para niños
- List of countries by GDP (nominal)
- Economy of the United States
- List of states by adjusted per capita personal income
- List of U.S. states and territories by economic growth rate
- List of U.S. states and territories by GDP per capita
- List of U.S. state economies
- List of cities by GDP
- List of U.S. metropolitan areas by GDP
- List of U.S. metropolitan areas by GDP per capita
- Thank God for Mississippi
 | William M. Jackson |
 | Juan E. Gilbert |
 | Neil deGrasse Tyson |


