Lynwood, California facts for kids
Quick facts for kids
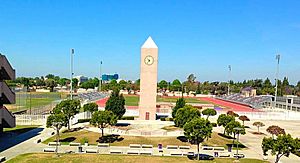
Lynwood, California
|
|||
|---|---|---|---|
 |
|||
|
|||
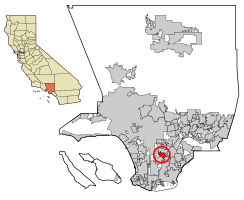
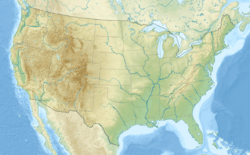
Location of Lynwood in Los Angeles County, California
|
|||
| Country | United States | ||
| State | California | ||
| County | Los Angeles | ||
| Incorporated | July 16, 1921 | ||
| Government | |||
| • Type | Council-Manager | ||
| Area | |||
| • Total | 4.84 sq mi (12.53 km2) | ||
| • Land | 4.84 sq mi (12.53 km2) | ||
| • Water | 0.00 sq mi (0.00 km2) 0% | ||
| Elevation | 92 ft (28 m) | ||
| Population
(2020)
|
|||
| • Total | 67,265 | ||
| • Density | 14,440.1/sq mi (5,575.37/km2) | ||
| Time zone | UTC-8 (Pacific) | ||
| • Summer (DST) | UTC-7 (PDT) | ||
| ZIP code |
90262
|
||
| Area codes | 310/424, 323 | ||
| FIPS code | 06-44574 | ||
| GNIS feature IDs | 1660965, 2410901 | ||
Lynwood is a city located in Los Angeles County, California, United States. In 2020, about 67,265 people lived here. This was a slight decrease from the 69,772 people counted in 2010.
Lynwood is found near the cities of South Gate and Compton. It is in the central part of the Los Angeles Basin. The city was officially formed in 1921. It got its name from the Lynwood Dairy and Creamery, which was also the name of the local train station.
Contents
History of Lynwood
Lynwood's story began with early settlers. These included Spanish aristocrats, called dons, and American pioneers. They bought land, settled down, and created a small community in the area.
The history starts with Don Antonio Maria Lugo. In 1810, the king of Spain gave Lugo a large piece of land in California. This was a reward for his military service. Lugo received about 29,514 acres of land. He named this area Rancho San Antonio. Today, this land makes up several cities, including Lynwood.
Over time, the population of Lynwood changed. At first, most residents were white non-Hispanic. In 1983, Lynwood elected its first Black council member. In 1985, Robert Henning became the city's first Black mayor. Later, in 1997, Armando Rea became Lynwood's first Latino mayor.
Geography of Lynwood
Lynwood covers a total area of about 4.8 square miles (12.5 square kilometers). All of this area is land.
People and Population in Lynwood

| Historical population | |||
|---|---|---|---|
| Census | Pop. | %± | |
| 1930 | 7,323 | — | |
| 1940 | 10,982 | 50.0% | |
| 1950 | 25,823 | 135.1% | |
| 1960 | 31,614 | 22.4% | |
| 1970 | 43,354 | 37.1% | |
| 1980 | 48,289 | 11.4% | |
| 1990 | 61,945 | 28.3% | |
| 2000 | 69,845 | 12.8% | |
| 2010 | 69,772 | −0.1% | |
| 2020 | 67,265 | −3.6% | |
| U.S. Decennial Census | |||
Population Data from 2020
| Race / Ethnicity (NH = Non-Hispanic) | Pop 2000 | Pop 2010 | Pop 2020 | % 2000 | % 2010 | % 2020 |
|---|---|---|---|---|---|---|
| White alone (NH) | 2,044 | 1,539 | 1,212 | 2.93% | 2.21% | 1.80% |
| Black or African American alone (NH) | 9,118 | 6,752 | 5,301 | 13.05% | 9.68% | 7.88% |
| Native American or Alaska Native alone (NH) | 103 | 76 | 64 | 0.15% | 0.11% | 0.10% |
| Asian alone (NH) | 490 | 390 | 397 | 0.70% | 0.56% | 0.59% |
| Pacific Islander alone (NH) | 228 | 170 | 182 | 0.33% | 0.24% | 0.27% |
| Other race alone (NH) | 50 | 167 | 278 | 0.07% | 0.24% | 0.41% |
| Mixed race or Multiracial (NH) | 309 | 226 | 404 | 0.44% | 0.32% | 0.60% |
| Hispanic or Latino (any race) | 57,503 | 60,452 | 59,427 | 82.33% | 86.64% | 88.35% |
| Total | 69,845 | 69,772 | 67,265 | 100.00% | 100.00% | 100.00% |
Population Data from 2010
In 2010, Lynwood had a population of 69,772 people. The city had about 14,680 households. Most households (66.7%) had children under 18 living in them. The average household had 4.57 people.
The population was made up of people of different ages. About 32.9% were under 18 years old. About 12.5% were aged 18 to 24. The median age was 27.8 years. This means half the people were younger than 27.8 and half were older.
Population Data from 2000
In 2000, Lynwood had 69,845 people living in 14,395 households. The average household size was 4.70 people.
The age breakdown showed that 38.0% of the population was under 18. About 13.1% were aged 18 to 24. The median age was 24 years.
Languages Spoken in Lynwood
As of 2000, most residents (77.43%) spoke Spanish as their first language. About 22.13% spoke English. Other languages like Thai, Samoan, and Tagalog were also spoken by smaller groups.
Changes in Lynwood's Population Over Time
Lynwood has seen many changes in its population over the years:
- First, it was a colonial settlement.
- Then, it became a small farming town.
- From 1940 to 1970, it was mostly a working-class white suburb.
- Between 1970 and 1990, it became a city with a majority African-American population.
- Today, Lynwood is mainly a Latino city.

In 2000, the most common backgrounds in Lynwood were Mexican (68.1%) and Salvadoran (2.9%). Most people born outside the U.S. came from Mexico (84.0%) or El Salvador (7.8%).
Education in Lynwood
Most schools in Lynwood are part of the Lynwood Unified School District. The high schools in the city include Lynwood High School, Marco Antonio Firebaugh High School, and Vista High School.
Public Libraries in Lynwood
The County of Los Angeles Public Library runs the Lynwood Library. You can find it at 11320 Bullis Road.
Sister Cities of Lynwood
Lynwood has "sister city" relationships with cities in Mexico. These connections help promote cultural exchange and understanding.
- Aguascalientes, Aguascalientes, Mexico
- Zacatecas, Zacatecas, Mexico
- Talpa de Allende, Jalisco, Mexico
Notable People from Lynwood
- Rick Adelman, NBA coach
- Jim Barr, MLB pitcher
- Glen Bell, founder of Taco Bell
- Kat Blaque, YouTube personality and transgender rights activist
- Gennifer Brandon, WNBA player
- Rick Burleson, MLB Shortstop
- Kevin Costner, actor and director
- Louella Daetweiler, All-American Girls Professional Baseball League player
- Dudley Dickerson, Three Stooges actor
- Ed Fiori, professional golfer
- David Greenwood, UCLA and NBA basketball player
- Greg Harris, professional baseball pitcher
- Robert Henning, first African-American mayor of Lynwood
- Davon Jefferson, professional basketball player in the Israeli Basketball Premier League
- Leslie Jones, comedian
- Jim Ladd, radio broadcaster
- Ulysses Llanez, soccer player
- Pat Martin, radio broadcaster
- Bob May, professional golfer
- Shane Mosley, boxing champion
- Efren Navarro, professional baseball player
- Violet Palmer, NBA referee
- Ricky Peters, MLB outfielder
- Paul Richards, former mayor of Lynwood
- Patty Rodriguez, producer, author, radio personality
- Pete Rozelle, NFL Commissioner, 1960–89
- Loretta Sanchez, politician who served in the United States House of Representatives
- Duke Snider, Hall of Fame outfielder for the Brooklyn and Los Angeles Dodgers
- Dave Stevens, artist, illustrator and creator of the Rocketeer
- Jeff Tedford, college football coach
- Janet Thurlow, jazz singer
- Robert Van't Hof, professional tennis player and 1980 NCAA singles champion for University of Southern California
- Fidel Vargas, mayor of Baldwin Park
- Julio G, radio host and DJ
- Leon White, professional wrestler "Big Van Vader"
- Evelyn Wells, the first female and second African-American mayor of Lynwood
- Venus Williams, tennis player, former World no. 1 and 7-time Grand Slam winner
- "Weird Al" Yankovic, parody musician; named his 2006 album Straight Outta Lynwood in honor of his hometown
See also
 In Spanish: Lynwood (California) para niños
 | Georgia Louise Harris Brown |
 | Julian Abele |
 | Norma Merrick Sklarek |
 | William Sidney Pittman |


