Orange Bowl facts for kids
Quick facts for kids Orange Bowl |
|
|---|---|
| Capital One Orange Bowl | |
 |
|
| Stadium | Hard Rock Stadium |
| Location | Miami Gardens, Florida (December 1996–1998, 2000–present) |
| Previous stadiums | Miami Field (1935–1937) Miami Orange Bowl (1938–January 1996, 1999) |
| Previous locations | Miami, Florida (1935–January 1996, 1999) |
| Operated | 1935–present |
| Conference tie-ins | ACC (1999–present) SEC/Big Ten/Notre Dame (December 2014–present) |
| Previous conference tie-ins | Big Eight (1954–1996) Big East (1999–2006) |
| Payout | US$35 million/conference (As of 2009[update]) |
| Sponsors | |
|
Federal Express/FedEx (1989–2010)
Discover Financial (2011–January 2014) Capital One (December 2014–present) |
|
| Former names | |
|
Orange Bowl (1935–1988)
Federal Express/FedEx Orange Bowl (1989–2010) Discover Orange Bowl (2011–January 2014) |
|
| 2023 matchup | |
| Florida State vs. Georgia (Georgia 63–3) | |
| 2024 season matchup | |
| Notre Dame vs. Penn State (Notre Dame 27–24) | |
The Orange Bowl is a big college football game played every year in the Miami metropolitan area in Florida. It started on January 1, 1935. This makes it one of the oldest bowl games in the United States, right after the Rose Bowl Game. It's tied with the Sugar Bowl and the Sun Bowl for being the second-oldest.
The first Orange Bowl games were held at Miami Field in the city of Miami. In 1938, the game moved to the Miami Orange Bowl stadium. Since 1996, it has been played at Hard Rock Stadium in Miami Gardens. A company called Capital One has sponsored the game since December 2014. That's why it's officially called the Capital One Orange Bowl. Other companies like Discover Financial and FedEx also sponsored it in the past.
In its early years, the Orange Bowl didn't have specific teams that had to play. It often matched a team from the southeastern U.S. against one from the central or northeastern states. From the 1950s to the mid-1990s, the Orange Bowl often invited the champion of the Big Eight Conference. If that team couldn't play, the second-best team from the Big Eight would be invited. Teams from other conferences, like the Southeastern Conference (SEC) or the Atlantic Coast Conference (ACC), also played. From 2007 to 2023, the ACC champion usually played in the Orange Bowl.
In 1992, the Orange Bowl joined other major bowl games to create a system to find the best college football team. This system was called the Bowl Coalition, then the Bowl Alliance, and later the Bowl Championship Series (BCS). The Orange Bowl hosted the national championship game several times as part of these systems. Miami Gardens also hosted the main BCS National Championship Game in 2009 and 2013.
In 2014, the Orange Bowl became part of the College Football Playoff. This playoff system decided the national champion. The Orange Bowl was a semifinal game in 2015, 2018, and 2021. When it wasn't a semifinal, it usually featured the best available team from the ACC. That team would play against a top team from the Big Ten, SEC, or Notre Dame.
The College Football Playoff expanded to twelve teams in the 2024–25 season. Now, the Orange Bowl is either a quarterfinal or a semifinal game each year. For example, it was a semifinal in 2025 and will be a quarterfinal in 2026. If the ACC champion is one of the top four teams, they might play in the Orange Bowl quarterfinal. If the ACC champion is one of the top two teams in a semifinal year, they will play their semifinal game in the Orange Bowl.
Contents
The Orange Bowl's Beginnings
How it Started
The idea for the Orange Bowl came from the Tournament of Roses Parade in Pasadena, California. That parade started in 1890 to show off California's nice weather. In 1902, they added a football game to their festival.
In 1926, leaders in Miami, Florida, wanted to do something similar. They planned a "Fiesta of the American Tropics" with a New Year's Day football game. This first "Fiesta" didn't continue, but Miami leaders, like Earnest E. Seiler, tried again. They created the "Palm Festival" with the slogan "Have a Green Christmas in Miami."
The Palm Festival Game
In 1932, George E. Hussey organized the first Festival of Palms Bowl. This was a game that led to the Orange Bowl. Miami was going through tough economic times, so Hussey wanted to help the city by having a football game like the Rose Bowl.
Two games were played at Moore Park in Miami. In these games, the local University of Miami team played against an invited opponent.
- On January 2, 1933, Miami beat Manhattan College 7–0.
- On New Year's Day 1934, Duquesne beat Miami 33–7. Duquesne's coach was Elmer Layden, one of the famous Four Horsemen of Notre Dame.
The NCAA (National Collegiate Athletic Association) doesn't officially count these two games as "bowl games." This is because the University of Miami was always guaranteed a spot, no matter how well they played. But because these games were popular, supporters organized another game for New Year's Day 1935. This new game was called the Orange Bowl. Unlike the Palm Festival games, teams weren't guaranteed a spot. The University of Miami still played in it, but they had to earn their way. Because of this, the 1935 Orange Bowl is recognized as an official bowl game.
Modern Orange Bowl History
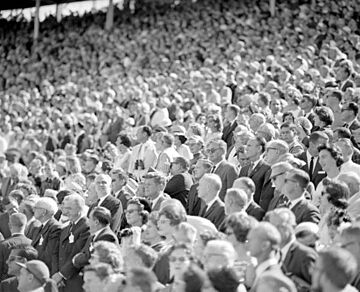
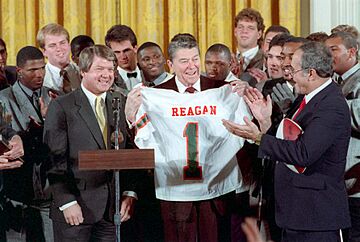
The Orange Bowl was played at Miami Field from 1935 to 1937. This is where the Miami Orange Bowl stadium was later built. From 1938 to 1996, and again in 1999, the game was held at the Miami Orange Bowl. It moved to its current home, Hard Rock Stadium in Miami Gardens, Florida, in December 1996. The game returned to the old Miami Orange Bowl stadium in 1999 because the Miami Dolphins (an NFL team) had a playoff game at the new stadium on the same day.
On January 1, 1965, the game between Texas and Alabama was the first college bowl game ever shown live on TV during prime time.
From 1954 to 1996, the Orange Bowl usually featured the champion of the Big Eight Conference. When the Big Eight joined with other teams to form the Big 12 Conference in 1996, their champion started playing in the Fiesta Bowl instead. From 1998 to 2013, the Orange Bowl was part of the Bowl Championship Series (BCS). This meant its team selection was linked to other major bowl games.
From 1998 to 2005, the Orange Bowl hosted the champion of either the ACC or Big East. This was unless those teams were playing in the national championship game, or if the Orange Bowl itself was the national championship game.
Since the 2006 season, the Orange Bowl has been closely linked with the ACC. It was known as the "Home of the ACC Champion." This connection continued when the College Football Playoff started after the 2014 season. However, with the playoff expanding to 12 teams, the Orange Bowl's special relationship with the ACC ended. Now, it's a permanent part of the playoff games.
King Orange Jamboree Parade
For many years, from 1936 to 2001, the Orange Bowl Committee also organized a parade. This parade was called the King Orange Jamboree Parade. It was held the day before the game. The first parade in 1936 had 30 floats and cost $40,000.
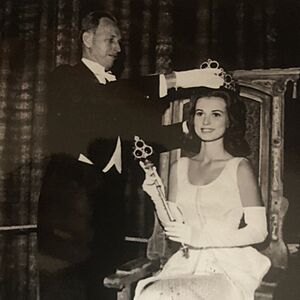
A special Orange Bowl Queen and her princesses were chosen from young women in Florida. They would ride on a float in the parade and be part of the halftime show at the game. Babs Beckwith was the first Orange Bowl queen. Famous people like Victoria Principal and Jackie Nespral were also Orange Bowl Queens.
In its best years, the parade was a New Year's Eve tradition. It was shown on national television with bright, lighted floats. Huge crowds of up to 500,000 people would watch it in downtown Miami. But over time, fewer people watched on TV, and the parade lost its national TV contract in 1997. It became much smaller because there weren't enough sponsors for the fancy floats. The number of people attending also dropped. By 2000, only about 20,000 people came. Because of this, the committee decided to stop the parade in early 2002.
Conference Connections
The Atlantic Coast Conference (ACC) has a special agreement with the Orange Bowl until 2025. If the ACC champion plays in the College Football Playoff in a year when the Orange Bowl isn't a semifinal, then the next highest-ranked ACC team will play in the Orange Bowl.
For the other team, the Southeastern Conference (SEC) and the Big Ten Conference are guaranteed to play three times each. The University of Notre Dame can play up to two games, but it's not guaranteed. The ACC team's opponent will be the highest-ranked team available from the SEC, Big Ten, or Notre Dame. However, the champions of the SEC and Big Ten are usually excluded. Also, if a team would create a rematch with the ACC team, the Orange Bowl can choose the next highest-ranked team instead. The College Football Playoff committee decides the rankings. ESPN broadcasts the game for 12 years.
Game Results
The rankings below are from the AP poll, which is how teams were ranked before each game.
| Date played | Winning team | Losing team | Venue | Attendance | Notes | ||
|---|---|---|---|---|---|---|---|
| January 1, 1935 | Bucknell | 26 | Miami (Florida) | 0 | Miami Field | 5,134 | notes |
| January 1, 1936 | Catholic | 20 | Ole Miss | 19 | 6,568 | notes | |
| January 1, 1937 | #14 Duquesne | 13 | Mississippi State | 12 | 9,210 | notes | |
| January 1, 1938 | Auburn | 6 | Michigan State | 0 | Miami Orange Bowl | 18,972 | notes |
| January 2, 1939 | #2 Tennessee | 17 | #4 Oklahoma | 0 | 32,191 | notes | |
| January 1, 1940 | #16 Georgia Tech | 21 | #6 Missouri | 7 | 29,278 | notes | |
| January 1, 1941 | #9 Mississippi State | 14 | #13 Georgetown | 7 | 29,554 | notes | |
| January 1, 1942 | #14 Georgia | 40 | TCU | 26 | 35,786 | notes | |
| January 1, 1943 | #10 Alabama | 37 | #8 Boston College | 21 | 25,166 | notes | |
| January 1, 1944 | LSU | 19 | Texas A&M | 14 | 25,203 | notes | |
| January 1, 1945 | Tulsa | 26 | #13 Georgia Tech | 12 | 23,279 | notes | |
| January 1, 1946 | Miami (Florida) | 13 | #16 Holy Cross | 6 | 35,709 | notes | |
| January 1, 1947 | #10 Rice | 8 | #7 Tennessee | 0 | 36,152 | notes | |
| January 1, 1948 | #10 Georgia Tech | 20 | #12 Kansas | 14 | 59,578 | notes | |
| January 1, 1949 | Texas | 41 | #8 Georgia | 28 | 60,523 | notes | |
| January 2, 1950 | #15 Santa Clara | 21 | #11 Kentucky | 13 | 64,816 | notes | |
| January 1, 1951 | #10 Clemson | 15 | #15 Miami (Florida) | 14 | 65,181 | notes | |
| January 1, 1952 | #6 Georgia Tech | 17 | #9 Baylor | 14 | 65,839 | notes | |
| January 1, 1953 | #9 Alabama | 61 | #14 Syracuse | 6 | 66,280 | notes | |
| January 1, 1954 | #4 Oklahoma | 7 | #1 Maryland | 0 | 68,640 | notes | |
| January 1, 1955 | #14 Duke | 34 | Nebraska | 7 | 68,750 | notes | |
| January 2, 1956 | #1 Oklahoma | 20 | #3 Maryland | 6 | 76,561 | notes | |
| January 1, 1957 | #20 Colorado | 27 | #19 Clemson | 21 | 72,552 | notes | |
| January 1, 1958 | #4 Oklahoma | 48 | #16 Duke | 21 | 76,318 | notes | |
| January 1, 1959 | #5 Oklahoma | 21 | #9 Syracuse | 6 | 75,281 | notes | |
| January 1, 1960 | #5 Georgia | 14 | #18 Missouri | 0 | 75,280 | notes | |
| January 2, 1961 | #5 Missouri | 21 | #4 Navy | 14 | 72,212 | notes | |
| January 1, 1962 | #4 LSU | 25 | #7 Colorado | 7 | 62,391 | notes | |
| January 1, 1963 | #5 Alabama | 17 | #8 Oklahoma | 0 | 72,880 | notes | |
| January 1, 1964 | #6 Nebraska | 13 | #5 Auburn | 7 | 72,647 | notes | |
| January 1, 1965 | #5 Texas | 21 | #1 Alabama | 17 | 72,647 | notes | |
| January 1, 1966 | #4 Alabama | 39 | #3 Nebraska | 28 | 72,214 | notes | |
| January 2, 1967 | Florida | 27 | #8 Georgia Tech | 12 | 72,426 | notes | |
| January 1, 1968 | #3 Oklahoma | 26 | #2 Tennessee | 24 | 77,993 | notes | |
| January 1, 1969 | #3 Penn State | 15 | #6 Kansas | 14 | 77,719 | notes | |
| January 1, 1970 | #2 Penn State | 10 | #6 Missouri | 3 | 77,282 | notes | |
| January 1, 1971 | #3 Nebraska | 17 | #5 LSU | 12 | 80,699 | notes | |
| January 1, 1972 | #1 Nebraska | 38 | #2 Alabama | 6 | 78,151 | notes | |
| January 1, 1973 | #9 Nebraska | 40 | #12 Notre Dame | 6 | 80,010 | notes | |
| January 1, 1974 | #6 Penn State | 16 | #13 LSU | 9 | 60,477 | notes | |
| January 1, 1975 | #9 Notre Dame | 13 | #2 Alabama | 11 | 71,801 | notes | |
| January 1, 1976 | #3 Oklahoma | 14 | #5 Michigan | 6 | 76,799 | notes | |
| January 1, 1977 | #11 Ohio State | 27 | #12 Colorado | 10 | 65,537 | notes | |
| January 2, 1978 | #6 Arkansas | 31 | #2 Oklahoma | 6 | 60,987 | notes | |
| January 1, 1979 | #4 Oklahoma | 31 | #6 Nebraska | 24 | 66,365 | notes | |
| January 1, 1980 | #5 Oklahoma | 24 | #4 Florida State | 7 | 66,714 | notes | |
| January 1, 1981 | #4 Oklahoma | 18 | #2 Florida State | 17 | 71,043 | notes | |
| January 1, 1982 | #1 Clemson | 22 | #4 Nebraska | 15 | 72,748 | notes | |
| January 1, 1983 | #3 Nebraska | 21 | #13 LSU | 20 | 68,713 | notes | |
| January 2, 1984 | #5 Miami (Florida) | 31 | #1 Nebraska | 30 | 72,549 | notes | |
| January 1, 1985 | #4 Washington | 28 | #2 Oklahoma | 17 | 56,294 | notes | |
| January 1, 1986 | #3 Oklahoma | 25 | #1 Penn State | 10 | 74,178 | notes | |
| January 1, 1987 | #3 Oklahoma | 42 | #9 Arkansas | 8 | 52,717 | notes | |
| January 1, 1988 | #2 Miami (Florida) | 20 | #1 Oklahoma | 14 | 74,760 | notes | |
| January 2, 1989 | #2 Miami (Florida) | 23 | #6 Nebraska | 3 | 79,480 | notes | |
| January 1, 1990 | #4 Notre Dame | 21 | #1 Colorado | 6 | 81,190 | notes | |
| January 1, 1991 | #1 Colorado | 10 | #5 Notre Dame | 9 | 77,062 | notes | |
| January 1, 1992 | #1 Miami (Florida) | 22 | #11 Nebraska | 0 | 77,747 | notes | |
| January 1, 1993 | #3 Florida State | 27 | #11 Nebraska | 14 | 57,324 | notes | |
| January 1, 1994 | #1 Florida State | 18 | #2 Nebraska | 16 | 81,536 | notes | |
| January 1, 1995 | #1 Nebraska | 24 | #3 Miami (Florida) | 17 | 81,753 | notes | |
| January 1, 1996 | #6 Florida State | 31 | #8 Notre Dame | 26 | 72,198 | notes | |
| December 31, 1996 | #6 Nebraska | 41 | #10 Virginia Tech | 21 | Pro Player Stadium |
63,297 | notes |
| January 2, 1998 | #2 Nebraska | 42 | #3 Tennessee | 17 | 74,002 | notes | |
| January 2, 1999 | #7 Florida | 31 | #18 Syracuse | 10 | Miami Orange Bowl |
67,919 | notes |
| January 1, 2000 | #8 Michigan | 35 | #5 Alabama | 34 | Pro Player Stadium |
70,461 | notes |
| January 3, 2001 | #1 Oklahoma | 13 | #3 Florida State | 2 | 76,835 | notes | |
| January 2, 2002 | #5 Florida | 56 | #6 Maryland | 23 | 73,640 | notes | |
| January 2, 2003 | #5 USC | 38 | #3 Iowa | 17 | 75,971 | notes | |
| January 1, 2004 | #10 Miami (Florida) | 16 | #9 Florida State | 14 | 76,739 | notes | |
| January 4, 2005 | #1 USC |
55 | #2 Oklahoma | 19 | 77,912 | notes | |
| January 3, 2006 | #3 Penn State | 26 | #22 Florida State | 23 | Dolphins Stadium |
77,773 | notes |
| January 2, 2007 | #5 Louisville | 24 | #15 Wake Forest | 13 | Dolphin Stadium |
74,470 | notes |
| January 3, 2008 | #8 Kansas | 24 | #5 Virginia Tech | 21 | 74,111 | notes | |
| January 1, 2009 | #21 Virginia Tech | 20 | #12 Cincinnati | 7 | 73,602 | notes | |
| January 5, 2010 | #10 Iowa | 24 | #9 Georgia Tech | 14 | Land Shark Stadium |
66,131 | notes |
| January 3, 2011 | #5 Stanford | 40 | #12 Virginia Tech | 12 | Sun Life Stadium |
65,453 | notes |
| January 4, 2012 | #17 West Virginia | 70 | #22 Clemson | 33 | 67,563 | notes | |
| January 1, 2013 | #13 Florida State | 31 | #16 Northern Illinois | 10 | 72,073 | notes | |
| January 3, 2014 | #12 Clemson | 40 | #7 Ohio State | 35 | 72,080 | notes | |
| December 31, 2014 | #10 Georgia Tech | 49 | #8 Mississippi State | 34 | 58,211 | notes | |
| December 31, 2015 | #1 Clemson | 37 | #4 Oklahoma | 17 | 67,615 | notes | |
| December 30, 2016 | #10 Florida State | 33 | #6 Michigan | 32 | Hard Rock Stadium | 67,432 | notes |
| December 30, 2017 | #6 Wisconsin | 34 | #11 Miami (Florida) | 24 | 65,326 | notes | |
| December 29, 2018 | #1 Alabama | 45 | #4 Oklahoma | 34 | 66,203 | notes | |
| December 30, 2019 | #6 Florida | 36 | #23 Virginia | 28 | 65,157 | notes | |
| January 2, 2021 | #5 Texas A&M | 41 | #14 North Carolina | 27 | 13,737 | notes | |
| December 31, 2021 | #3 Georgia | 34 | #2 Michigan | 11 | 66,839 | notes | |
| December 30, 2022 | #6 Tennessee | 31 | #10 Clemson | 14 | 63,912 | notes | |
| December 30, 2023 | #6 Georgia | 63 | #4 Florida State | 3 | 63,324 | notes | |
| January 9, 2025 | #3 Notre Dame | 27 | #5 Penn State | 24 | 66,881 | notes | |
Source:
- Denotes Bowl Coalition Championship Game
- Denotes Bowl Alliance Championship Game
- Denotes BCS National Championship Game
- Denotes College Football Playoff quarterfinal game
- Denotes College Football Playoff semifinal game
 Denotes a historical name for what is now Hard Rock Stadium
 Due to an NFL scheduling conflict, the 1999 game was played at the Miami Orange Bowl
 USC vacated their 2005 victory due to NCAA sanctions
Most Valuable Players (MVPs)
The Orange Bowl started naming a Most Valuable Player (MVP) in 1965. From 1970 to 1998, two MVPs were chosen for each game. Since 1999, usually only one MVP is named. However, if the game is part of the College Football Playoff, both an offensive and a defensive MVP are chosen.
|
|
Teams with Most Appearances
This list shows the teams that have played in the Orange Bowl the most times, up to the game played in January 2025. There have been 91 games in total.
- Teams with multiple appearances
|
|
![]() USC's win–loss record and winning percentage do not include their vacated 2005 win.
USC's win–loss record and winning percentage do not include their vacated 2005 win.
- Teams with a single appearance
- Won (11): Bucknell, Catholic, Duquesne, Louisville, Rice, Santa Clara, Stanford, Tulsa, Washington, West Virginia, Wisconsin
- Lost (14): Baylor, Boston College, Cincinnati, Georgetown, Holy Cross, Kentucky, Michigan State, Navy, North Carolina, Northern Illinois, Ole Miss, TCU, Virginia, Wake Forest
Appearances by Conference
This table shows how many times teams from different college football conferences have played in the Orange Bowl, up to the game in January 2025.
| Rank | Conference | Appearances | Record | # of Teams |
Teams | ||
|---|---|---|---|---|---|---|---|
| W | L | Win % | |||||
| 1 | Big Eight | 42 | 20 | 22 | .476 | 5 | |
| 2 | SEC | 40 | 23 | 17 | .575 | 11 | |
| 3 | ACC | 29 | 11 | 18 | .379 | 10 |
|
| 4 | Independent | 29 | 14 | 15 | .483 | 15 |
|
| 5 | Big Ten | 11 | 5 | 6 | .455 | 5 |
|
| 6 (tie) | Big East | 8 | 4 | 4 | .500 | 6 |
|
| 6 (tie) | SWC | 8 | 4 | 4 | .500 | 6 |
|
| 8 | Big 12 | 7 | 4 | 3 | .571 | 3 | |
| 9 | Pac-12 | 4 | 3 | 0 | 1.000 |
3 |
|
| 10 (tie) | SoCon | 1 | 1 | 0 | 1.000 | 1 | Clemson (1–0) |
| 10 (tie) | MVC | 1 | 1 | 0 | 1.000 | 1 | Tulsa (1–0) |
| 10 (tie) | MAC | 1 | 0 | 1 | .000 | 1 | Northern Illinois (0–1) |
| 10 (tie) | SIAA | 1 | 0 | 1 | .000 | 1 | Miami (FL) (0–1) |
![]() The Pac-12's win–loss record and winning percentage do not include USC's vacated 2005 win.
The Pac-12's win–loss record and winning percentage do not include USC's vacated 2005 win.
- Conferences that are no longer active in top-level college football are shown in italics.
- Big Eight records include results from when the conference was called the Big Six and Big Seven.
- Pac-12 records include results from when the conference was called the Pacific-10.
- Some teams have played in the Orange Bowl as members of different conferences over time.
Game Records
These are some of the biggest records from Orange Bowl games.
| Team | Record, Team vs. Opponent | Year |
|---|---|---|
| Most points scored (one team) | 70, West Virginia vs. Clemson | 2012 |
| Most points scored (losing team) | 35, Ohio State vs. Clemson | Jan. 2014 |
| Most points scored (both teams) | 103, West Virginia (70) vs. Clemson (33) | 2012 |
| Fewest points allowed | 0, 8 times, most recent: Miami (FL) vs. Nebraska |
1992 |
| Largest margin of victory | 60, Georgia (63) vs. Florida State (3) | 2023 |
| Total yards | 673, Georgia vs. Florida State | 2023 |
| Rushing yards | 452, Georgia Tech vs. Mississippi State | 2014 |
| Passing yards | 456, Florida vs. Maryland | 2002 |
| First downs | 37, Georgia vs. Florida State | 2023 |
| Fewest yards allowed | 28, Bucknell vs. Miami | 1935 |
| Fewest rushing yards allowed | –8, Missouri vs. Navy | 1961 |
| Fewest passing yards allowed | 0, shared by: Holy Cross vs. Miami Tennessee vs. Rice |
1946 1947 |
| Individual | Record, Player, Team vs. Opponent | Year |
| All-purpose yards | 280, Tavon Austin, West Virginia vs. Clemson (123 receiving, 117 return, 40 rush) |
2012 |
| Touchdowns (all-purpose) | 4, shared by: Tavon Austin, West Virginia vs. Clemson Johnny Rodgers, Nebraska vs. Notre Dame |
2012 1973 |
| Rushing yards | 206, Ahman Green, Nebraska vs. Tennessee | 1998 |
| Rushing touchdowns | 3, most recent: Synjyn Days, Georgia Tech vs. Mississippi State Justin Thomas, Georgia Tech vs. Mississippi State |
2014 2014 |
| Passing yards | 453, Dak Prescott, Mississippi State vs. Georgia Tech | 2014 |
| Passing touchdowns | 6, Geno Smith, West Virginia vs. Clemson | 2012 |
| Receiving yards | 227, Sammy Watkins, Clemson vs. Ohio State | 2014 |
| Receiving touchdowns | 4, Tavon Austin, West Virginia vs. Clemson | 2012 |
| Tackles | 31 (total), Lee Roy Jordan, Alabama vs. Oklahoma 13 (solo), most recently: Brian Bosworth, Oklahoma vs. Penn State |
1963 1986 |
| Sacks | 4, Rusty Medearis, Miami vs. Nebraska | 1992 |
| Interceptions | 3, Bud Hebert, Oklahoma vs. Florida State | 1980 |
| Long Plays | Record, Player, Team vs. Opponent | Year |
| Touchdown run | 94, Larry Smith, Florida vs. Georgia Tech | 1967 |
| Touchdown pass | 92, Nyqwan Murray from Deondre Francois, Florida State vs. Michigan | 2016 |
| Kickoff return | 100, C. J. Jones, Iowa vs. USC | 2003 |
| Punt return | 87, Willie Reid, Florida State vs. Penn State | 2006 |
| Interception return | 94, David Baker, Oklahoma vs. Duke | 1958 |
| Fumble return | 99, Darwin Cook, West Virginia vs. Clemson | 2012 |
| Punt | 82, Ike Pickle, Mississippi State vs. Duquesne | 1937 |
| Field goal | 56, Greg Cox, Miami vs. Oklahoma | 1988 |
Sponsors and TV Channels
The Orange Bowl has had different sponsors over the years. It was known as the Discover Orange Bowl from 2010 to 2014. Before that, it was the FedEx Orange Bowl from 1989 to 2010. Since December 2014, Capital One has been the main sponsor.
ESPN started broadcasting the Orange Bowl in 2011. They took over from Fox, which had shown the game for four seasons. Before Fox, ABC aired the game from 1999 to 2006. Other networks like CBS and NBC also broadcast the game in earlier years. The Orange Bowl is one of only two bowl games that have been shown on all four major U.S. television networks. ESPN Deportes also started showing the game in Spanish in 2013.
Images for kids
See also
 In Spanish: Orange Bowl para niños
 | Leon Lynch |
 | Milton P. Webster |
 | Ferdinand Smith |


