West Point Lake facts for kids
Quick facts for kids West Point Lake |
|
|---|---|
|
|
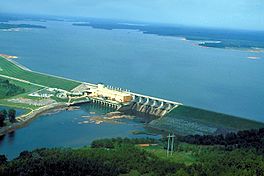
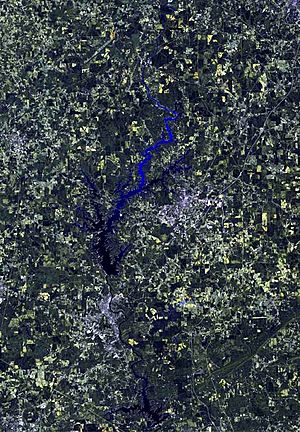
Northerly view, south of the dam
|
|
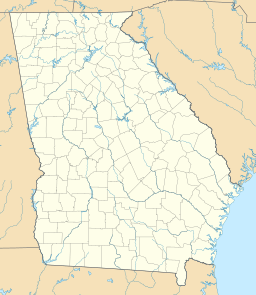
| Location | Troup County, GA, and Heard County, GA, and Chambers County, AL, and Randolph County, AL |
| Coordinates | 32°56′25″N 85°11′27″W / 32.9402922°N 85.1907668°W |
| Type | Reservoir |
| Etymology | The near city of West Point, GA |
| Part of | ACF River Basin |
| Primary inflows | Chattahoochee River |
| Primary outflows | Chattahoochee River |
| Catchment area | 3,440 sq mi (8,900 km2) |
| Basin countries | United States |
| Managing agency | U.S. Army Corps of Engineers (USACE) |
| Built | December 1965 |
| First flooded | May 25, 1975 |
| Max. length | 34 mi (55 km) |
| Max. width | 3 mi (4.8 km) |
| Surface area | 25,864 acres (10,467 ha) |
| Average depth | 23 ft (7.0 m) |
| Max. depth | 85 ft (26 m) |
| Water volume | 604,527 acre⋅ft (745,673,000 m3) at 635 ft (194 m) |
| Residence time | Approx. 55 days |
| Shore length1 | 604 mi (972 km) |
| Surface elevation | Summer: 635 ft (194 m) Winter: 628 ft (191 m) |
| Frozen | Never |
| Settlements | near West Point, GA |
| 1 Shore length is not a well-defined measure. | |
West Point Lake is a large, man-made lake located mostly in western Georgia. It was created on the Chattahoochee River and is managed by the U.S. Army Corps of Engineers (USACE). The Chattahoochee River flows into the lake from the north. The West Point Dam holds back the river to form the lake, and then the river continues its journey south towards Columbus, Georgia.
West Point Lake is one of four main lakes managed by the USACE in the ACF River Basin. It is the smallest of these lakes by area, covering about 25,864 acres (10,467 ha) of water. Its shoreline stretches for about 604 miles (972 km). The lake serves several important purposes: it helps control floods, generates electricity, and stores water. This stored water also helps boats navigate the lower Chattahoochee River.
Contents
Building West Point Lake: A Look Back
The idea for West Point Lake was approved by the government in 1962, as part of a plan to control floods. Building the lake cost around $105 million. Its main goals were to produce power and offer fun outdoor activities. Other important uses included flood control, protecting fish and wildlife, helping local areas develop, and making river travel easier.
When the lake was planned, it was decided that there would be a special public area, about 300 to 500 feet (91 to 152 m) wide, around the water's edge. This area, along with the lake itself, meant that the USACE bought and now owns about 56,638 acres (22,921 ha) of land.
Construction Timeline
Construction of the dam began in 1965. The first parts, like the west side of the dam and a road for the power plant, were finished in 1966. During this time, a team found important historical sites. They studied these sites until 1971, just before the lake was filled with water.
Two old covered bridges were in the area that would be flooded. One bridge, the Wehadkee Creek bridge, was carefully moved to Callaway Gardens in 1965. The other, Glass' bridge, was burned down in 1954 because it was the easiest way to remove it.
The main river channel was closed in May 1967, and the water was sent through a different path. The dam itself started being built in May 1968 and was finished by August 1970. The river was then rerouted again in June 1973 through an opening for a future power generator.
The first generator was ready in May 1974. However, problems with the dikes (walls that hold back water) delayed the lake's filling until October 16, 1974. West Point Lake was filled from its natural river level of 565 feet (172 m) above sea level to 617 feet (188 m). It couldn't be filled higher until April 30, 1975, after another power unit was completed.
One big reason for building West Point Lake was to help with river navigation. A goal for the entire ACF river basin is to keep the Apalachicola River deep enough for boats (about 9 feet (2.7 m) deep). After West Point Lake was built, it was decided to raise the lake's winter water level slightly, from 625 to 628 feet (191 to 191 m) above sea level. This change helped ensure that both West Point Lake and Walter F. George Lake could be filled to their summer levels without causing water shortages downstream for navigation. This change was made carefully to avoid flooding during heavy rains.
West Point Dam: A Closer Look
The West Point Dam is a large concrete structure, 896 feet (273 m) long and 132 feet (40 m) high, completed in 1975. The very top of the dam is 652 feet (199 m) above sea level.
The dam has a special building for generating power, which holds three large units that each produce 48.8 megawatts of electricity, plus one smaller 3.3 megawatt unit. On the eastern side, there's a 350 feet (110 m) long spillway, which is where excess water can flow out. Both the power generation and spillway are controlled remotely from Walter F. George Lake, but there are also local controls.
Long earth walls, called embankments, extend from the dam for a total of 7,250 feet (2,210 m). There's a road on top of these embankments and the concrete dam, allowing people to drive across. The dam can hold between 442,295 to 774,798 acre-feet (545,563,000 to 955,699,000 m3) of water, depending on the lake's level. During construction, rock was removed in case a navigable lock (a way for boats to move between different water levels) might be added in the future.
Where is West Point Lake?
West Point Lake starts at the West Point Dam. This is about 201.4 miles (324.1 km) upriver from where the Chattahoochee River meets the ocean, and about 3.2 miles (5.1 km) north of the city of West Point, GA.
The lake is within 50 miles (80 km) by air of several cities in Georgia and Alabama. In Georgia, these include Columbus, LaGrange, Newnan, Peachtree City, Carrollton, and parts of Atlanta. In Alabama, nearby cities are Phenix City, Opelika-Auburn, and Roanoke.
It's easy to get to either side of the lake, but crossing the main part of the lake can be tricky. There are only two bridges that go directly over the main channel. If you don't cross the lake directly, you would have to go to Franklin or West Point to get to the other side of the river. Sometimes, you can also cross directly over the West Point Dam for a slightly shorter route.
Animals and Plants of West Point Lake
When West Point Lake was filled, it changed the homes for animals like deer, doves, quail, and waterfowl. This also affected important paths that migratory birds use. To help, the West Point Wildlife Management Area was created, covering about 8,952 acres (3,623 ha). Two other wildlife areas, Dixie Creek Area (711 acres (288 ha)) and Glover's Creek Area (337 acres (136 ha)), were also set up.
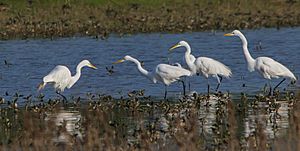
You might even spot an endangered Bald eagle in this part of the lake! There are many animals around, including some that can be harmful to humans. Two venomous snakes found here are the copperhead and the cottonmouth.
Scientists keep track of certain plants and animals that live around West Point Lake. Three fish on this list are the bluestripe shiner, southern brook lamprey, and highscale shiner. Only one bird, the bachman's sparrow, is on this special list, along with 19 types of plants, including a sunflower, azalea, and a strawberry plant.
Many common animals found in the southeastern United States also live in the West Point Lake area. These include different kinds of bass, crappie, waterfowl, snakes, and turtles. The American alligator has been seen here, but it's very rare. With all this wildlife, West Point Lake is a great place for hunting, fishing, shooting, and simply watching animals.
Visiting and Having Fun at West Point Lake
How to Access the Lake
There are four different ways people can access the shoreline of West Point Lake.
West Point Lake has more public recreation areas and shoreline access than any other USACE lake in its river basin. This means it's the easiest USACE lake in the area for the public to visit. Plus, the land around the lake, even if it's not a park, is considered public land. Except for private boat docks and restricted areas, people are allowed to be anywhere on this public land. Even if someone has a permit for a boat dock, it doesn't give them exclusive private rights to the USACE property.
Fun Activities at the Lake
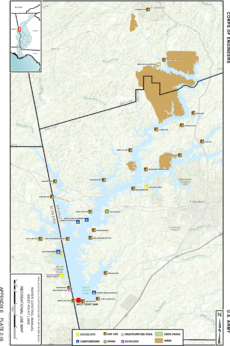
In 2016, West Point Lake had 36 parks, 2 marinas (places for boats), and 7 campgrounds. The fun areas are spread out around the lake, but a large part of the shoreline south of Georgia State Route 109 is open to the public.
When the lake first opened, there were only 26 parks covering about 5,786 acres (2,342 ha). But a lot of people started visiting! Annual visits grew from one million in 1976 to 4.2 million by 1981. Later, the number of visitors went down because of water pollution from nearby Atlanta. We don't know the exact number of visitors today, but many people still come to the lake for the yearly fireworks show at Pyne Road Park, which you can watch from a boat or on land.
Lake Environment and Geography
The area that feeds into the Chattahoochee River near West Point Lake is long and narrow, about 24 miles (39 km) wide and 140 miles (230 km) long. It covers about 3,440 square miles (8,900 km2) north of the West Point Dam. The Chattahoochee River flows southwest for 235 miles (378 km) to reach the dam, starting from the Blue Ridge Mountains in north Georgia.
The northern part of the river basin is in the Blue Ridge Mountains, but the middle part, where West Point Lake is, is in the Piedmont Region. This area has rolling hills, except for the nearby Pine Mountain Range. The soil around the lake is rich in iron-oxides and clay, which is what Georgia is famous for. Granite and soapstone are common rocks found here. The entire Chattahoochee River basin covers about 8,708 square miles (22,550 km2).
Water Quality and Pollution Efforts
West Point Lake sometimes gets negative attention because it's the first major body of water south of Atlanta. Scientists were very interested in studying the lake and the river for this reason. Detailed studies were done in the early 1990s to see how the city environment affected the lake's water.
Early Pollution Problems
Starting in the late 1970s, the lake began to have water quality problems. This meant fewer people used the lake, which hurt the local economy. On July 19, 1988, the water released from the dam downstream had too many nutrients, which caused fish to die. In February 1991, the Georgia Department of Natural Resources warned people not to eat fish from the lake. This warning was extended to Lake Harding in March.
Also in 1991, as the pollution became clear, the Georgia Environmental Protection Division (GEPD) and the City of Atlanta set a deadline to reduce phosphorus pollution by the late 1990s. Atlanta kept failing to reduce pollution, and the GEPD threatened them with fines and bans on new sewer connections. This could have harmed the economy around the 1996 Summer Olympics and increased daily fines. Atlanta was already facing $9,000 in daily fines, totaling $20 million by 1997, for not fixing its sewer overflow systems.
Solving the Pollution: Lawsuits and Improvements
On October 10, 1995, a group called the Upper Chattahoochee Riverkeepers sued the City of Atlanta. They claimed Atlanta was breaking the Clean Water Act by not upgrading its wastewater facilities.
In 1998, two Federal Consent Decrees (court orders) required Atlanta to fix its poorly maintained wastewater system. To solve the problems, a $4 billion program was created. This program successfully stopped over 400 million gallons of sewer drainage from entering the rivers each year. As part of the lawsuit, Atlanta was also fined $2.5 million and agreed to clean up trash and create green spaces along the river.
In 1998, an investigation found fish in the lake were contaminated with polychlorinated biphenyls (PCBs). However, Georgia no longer uses PCBs, so the contaminated fish were likely older ones from previous years. By 2012, 97 percent of the sewage problems from the 1990s had been fixed, and improvements were expected to continue. In 2015 and 2017, tests showed normal and safe bacteria levels in the lake. The lake is regularly tested according to United States Environmental Protection Agency standards, and the results are available for the public to see.
Weather Around West Point Lake
Many things affect the weather around West Point Lake. The lake is in the southern part of the temperate zone, close to both the Atlantic Ocean and the Gulf of Mexico. This means tropical storms and hurricanes can sometimes reach the area.
During the summer, most of the rain comes from thunderstorms. In winter and early spring, large weather systems called frontal systems are most likely to bring heavy, flood-causing rains. Snow can happen, but it rarely stays on the ground for more than a few days.
For the West Point Lake area, the coldest temperature ever recorded was −10 °F (−23 °C) in LaGrange, GA, on February 2, 1899. The hottest was 107 °F (42 °C) in LaFayette, AL, and Rock Mills, AL, in late July 1952. Usually, rainfall is spread out evenly throughout the year, with an average of 52.93 inches (1,344 mm) annually.
| Month | Jan | Feb | Mar | Apr | May | Jun | Jul | Aug | Sep | Oct | Nov | Dec | Year |
|---|---|---|---|---|---|---|---|---|---|---|---|---|---|
| Record high °F (°C) | 80 (27) |
84 (29) |
95 (35) |
94 (34) |
100 (38) |
104 (40) |
106 (41) |
106 (41) |
106 (41) |
99 (37) |
93 (34) |
80 (27) |
106 (41) |
| Mean daily maximum °F (°C) | 56.6 (13.7) |
59.8 (15.4) |
67.5 (19.7) |
75.7 (24.3) |
83.0 (28.3) |
89.4 (31.9) |
91.0 (32.8) |
90.3 (32.4) |
85.9 (29.9) |
76.8 (24.9) |
66.5 (19.2) |
57.9 (14.4) |
75.0 (23.9) |
| Daily mean °F (°C) | 45.1 (7.3) |
47.6 (8.7) |
54.8 (12.7) |
62.5 (16.9) |
70.4 (21.3) |
77.6 (25.3) |
80.1 (26.7) |
79.4 (26.3) |
74.4 (23.6) |
63.6 (17.6) |
53.6 (12.0) |
46.3 (7.9) |
62.9 (17.2) |
| Mean daily minimum °F (°C) | 33.5 (0.8) |
35.3 (1.8) |
42.2 (5.7) |
49.3 (9.6) |
57.8 (14.3) |
65.7 (18.7) |
69.2 (20.7) |
68.6 (20.3) |
63.0 (17.2) |
50.4 (10.2) |
40.6 (4.8) |
34.8 (1.6) |
50.9 (10.5) |
| Record low °F (°C) | −8 (−22) |
5 (−15) |
11 (−12) |
26 (−3) |
35 (2) |
43 (6) |
53 (12) |
50 (10) |
35 (2) |
24 (−4) |
8 (−13) |
1 (−17) |
−8 (−22) |
| Average rainfall inches (mm) | 4.55 (116) |
5.10 (130) |
5.80 (147) |
4.46 (113) |
3.65 (93) |
3.81 (97) |
5.57 (141) |
4.12 (105) |
3.21 (82) |
2.63 (67) |
3.40 (86) |
4.95 (126) |
51.24 (1,301) |
| Source: U.S. Army Corp of Engineers Water Control Manual, Appendix E | |||||||||||||
| Month | Jan | Feb | Mar | Apr | May | Jun | Jul | Aug | Sep | Oct | Nov | Dec | Year |
|---|---|---|---|---|---|---|---|---|---|---|---|---|---|
| Record high °F (°C) | 80 (27) |
82 (28) |
89 (32) |
93 (34) |
99 (37) |
102 (39) |
104 (40) |
103 (39) |
100 (38) |
99 (37) |
86 (30) |
80 (27) |
104 (40) |
| Mean daily maximum °F (°C) | 56.1 (13.4) |
59.9 (15.5) |
68.0 (20.0) |
76.4 (24.7) |
83.3 (28.5) |
88.7 (31.5) |
89.9 (32.2) |
89.3 (31.8) |
84.6 (29.2) |
75.9 (24.4) |
66.0 (18.9) |
58.0 (14.4) |
74.7 (23.7) |
| Daily mean °F (°C) | 45.2 (7.3) |
47.8 (8.8) |
55.1 (12.8) |
62.8 (17.1) |
70.4 (21.3) |
76.9 (24.9) |
79.1 (26.2) |
78.5 (25.8) |
73.3 (22.9) |
62.9 (17.2) |
53.3 (11.8) |
46.7 (8.2) |
62.7 (17.1) |
| Mean daily minimum °F (°C) | 34.2 (1.2) |
35.9 (2.2) |
42.2 (5.7) |
49.2 (9.6) |
57.4 (14.1) |
65.0 (18.3) |
68.3 (20.2) |
67.6 (19.8) |
61.9 (16.6) |
49.9 (9.9) |
40.7 (4.8) |
35.4 (1.9) |
50.6 (10.3) |
| Record low °F (°C) | −5 (−21) |
−10 (−23) |
11 (−12) |
26 (−3) |
33 (1) |
41 (5) |
50 (10) |
49 (9) |
32 (0) |
24 (−4) |
3 (−16) |
−1 (−18) |
−10 (−23) |
| Average rainfall inches (mm) | 5.06 (129) |
5.07 (129) |
6.05 (154) |
4.66 (118) |
3.35 (85) |
4.00 (102) |
5.42 (138) |
4.18 (106) |
3.35 (85) |
2.66 (68) |
3.46 (88) |
4.73 (120) |
52.00 (1,321) |
| Source: U.S. Army Corp of Engineers Water Control Manual, Appendix E | |||||||||||||
 | Aurelia Browder |
 | Nannie Helen Burroughs |
 | Michelle Alexander |


