
Caldwell County, Texas facts for kids
Quick facts for kids
Caldwell County
|
|
|---|---|

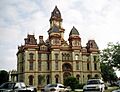
The Caldwell County Courthouse in Lockhart
|
|

Location within the U.S. state of Texas
|
|
 Texas's location within the U.S. |
|
| Country | |
| State | |
| Founded | 1848 |
| Named for | Mathew Caldwell |
| Seat | Lockhart |
| Largest city | San Marcos |
| Area | |
| • Total | 547 sq mi (1,420 km2) |
| • Land | 545 sq mi (1,410 km2) |
| • Water | 1.9 sq mi (5 km2) 0.3% |
| Population
(2020)
|
|
| • Total | 45,883 |
| • Density | 83.88/sq mi (32.387/km2) |
| Time zone | UTC−6 (Central) |
| • Summer (DST) | UTC−5 (CDT) |
| Congressional district | 27th |
Caldwell County is a special area in the state of Texas. In 2020, about 45,883 people lived there. The main town, or county seat, is Lockhart.
This county was created in 1848. It was named after Mathew Caldwell. He was a brave ranger captain who fought in important battles. He also helped sign the Texas Declaration of Independence. Caldwell County is also part of the larger Greater Austin area.
Contents
Discovering Caldwell County's Past
Caldwell County has a long and interesting history. Long ago, around 8000 BC, early people called Paleo-Indians lived here. They were hunter-gatherers, meaning they hunted animals and gathered plants for food. Later, Native American groups like the Tonkawa, Karankawa, and Comanche peoples made this area their home.
Early Settlements and Founding
In 1825, the Mexican government allowed Green DeWitt to start a colony in Texas. This was an important step for the area.
The first settler in the county's oldest town, Prairie Lea, was Edmund Bellinger in 1839. Sam Houston, a famous Texan leader, named the town. He named it after his future wife, Margaret Lea.
In March 1845, Caldwell County was officially formed. It was created from parts of Bastrop and Gonzales Counties. Lockhart was chosen as the county seat.
Growth and Changes in the 1800s
By 1860, the county's population grew to 2,871 people. The town of Fentress was started around this time. It was first called Riverside. Later, it was renamed to honor James Fentress, the town's first doctor.
During the American Civil War, many men from Caldwell County joined the fight. The county saw a lot of changes during this time.
In the 1870s, a new community called St. John Colony was formed. It was started by people who had been slaves. The town of Luling was also established in 1874. It was near an older farming area called Atlanta. People like John and James Merriwether built important mills there. These mills were later known as Zedler's Mills.
Connecting with Railroads
Railroads helped Caldwell County grow a lot.
- In 1887, the Missouri, Kansas, and Texas railroad finished its tracks. These tracks connected Lockhart to San Marcos.
- Two years later, the San Antonio and Aransas Pass Railway linked Lockhart and Luling to Shiner.
- By 1892, the Missouri, Kansas and Texas railroad built tracks from Lockhart to Smithville.
These railroads made it easier to transport goods and people.
Farming and Oil Discoveries
From 1880 to 1900, farming was very important in Caldwell County. Many farms were run by tenant farmers. These farmers rented land to grow crops.
In 1922, something big happened: Edgar B. Davis found oil! This discovery created the Luling Oilfield. To help local families, Davis started the Luling Foundation in 1927. This foundation taught farmers new ways to grow different crops.
Parks and Celebrations
Caldwell County also has fun places and traditions.
- The Lockhart State Park opened in 1948. It's a great place for outdoor activities.
- In 1953, Luling started its yearly Watermelon Thump celebration. It's a fun festival all about watermelons!
Caldwell County's Location and Roads
Caldwell County covers about 547 square miles. Most of this area is land, with a small part covered by water.
Main Roads in Caldwell County
Several important highways run through Caldwell County. They help people travel and transport goods.
- Interstate 10
- U.S. Highway 90
- U.S. Highway 183
- State Highway 80
- State Highway 130
.svg)


Neighboring Counties
Caldwell County shares its borders with several other counties in Texas:
- Travis County (to the northeast)
- Bastrop County (to the north)
- Fayette County (to the southeast)
- Gonzales County (to the southwest)
- Guadalupe County (to the south)
- Hays County (to the west)
Who Lives in Caldwell County?
The number of people living in Caldwell County has changed over time.
| Historical population | |||
|---|---|---|---|
| Census | Pop. | %± | |
| 1850 | 1,329 | — | |
| 1860 | 4,481 | 237.2% | |
| 1870 | 6,572 | 46.7% | |
| 1880 | 11,757 | 78.9% | |
| 1890 | 15,769 | 34.1% | |
| 1900 | 21,765 | 38.0% | |
| 1910 | 24,237 | 11.4% | |
| 1920 | 25,160 | 3.8% | |
| 1930 | 31,397 | 24.8% | |
| 1940 | 24,893 | −20.7% | |
| 1950 | 19,350 | −22.3% | |
| 1960 | 17,222 | −11.0% | |
| 1970 | 21,178 | 23.0% | |
| 1980 | 23,637 | 11.6% | |
| 1990 | 26,392 | 11.7% | |
| 2000 | 32,194 | 22.0% | |
| 2010 | 38,066 | 18.2% | |
| 2020 | 45,883 | 20.5% | |
| 2023 (est.) | 49,859 | 31.0% | |
| U.S. Decennial Census 1850–2010 2010 2020 |
|||
Population Makeup
The people of Caldwell County come from many different backgrounds. The U.S. Census helps us understand this mix.
| Race / Ethnicity (NH = Non-Hispanic) | Pop 2000 | Pop 2010 | Pop 2020 | % 2000 | % 2010 | % 2020 |
|---|---|---|---|---|---|---|
| White alone (NH) | 15,929 | 16,841 | 16,560 | 49.48% | 44.24% | 36.09% |
| Black or African American alone (NH) | 2,674 | 2,456 | 2,225 | 8.31% | 6.45% | 4.85% |
| Native American or Alaska Native alone (NH) | 90 | 90 | 129 | 0.28% | 0.24% | 0.28% |
| Asian alone (NH) | 102 | 344 | 227 | 0.32% | 0.90% | 0.49% |
| Pacific Islander alone (NH) | 8 | 8 | 4 | 0.02% | 0.02% | 0.01% |
| Other Race alone (NH) | 30 | 54 | 178 | 0.09% | 0.14% | 0.39% |
| Mixed Race or Multiracial (NH) | 343 | 351 | 1,092 | 1.07% | 0.92% | 2.38% |
| Hispanic or Latino (any race) | 13,018 | 17,922 | 25,468 | 40.44% | 47.08% | 55.51% |
| Total | 32,194 | 38,066 | 45,883 | 100.00% | 100.00% | 100.00% |
In 2010, about 38,066 people lived in the county.
- About 75.8% were White.
- About 6.8% were African American.
- About 0.9% were Asian.
- About 0.8% were Native American.
- About 13.1% were of some other race.
- About 2.5% were of two or more races.
- About 47.1% of the people were Hispanic or Latino.
In 2000, there were 32,194 people living in Caldwell County. The average number of people per square mile was about 59. There were also about 11,901 homes.
Many homes had children under 18 living there (37%). Most homes were married couples (56%). The average household had about 2.82 people.
The median age in the county was 34 years old. This means half the people were younger than 34, and half were older.
Towns and Communities
Caldwell County has several towns and smaller communities.
Cities in Caldwell County
- Lockhart (This is the county seat, the main town for county government.)
- Luling (A small part of Luling is in Guadalupe County.)
- Martindale
- Mustang Ridge (Most of this city is in Travis County, with a small part in Bastrop County.)
- Niederwald (Most of this city is in Hays County.)
- San Marcos (Most of this city is in Hays County, with small parts in Guadalupe and Comal Counties.)
- Uhland (Most of this city is in Hays County.)
Smaller Communities
These are smaller, unincorporated communities in Caldwell County:
- Brownsboro
- Dale
- Delhi
- Elm Grove
- Fentress
- Joliet
- Lytton Springs
- Maxwell
- McMahan
- McNeil
- Mendoza
- Pettytown (Partly in Bastrop County.)
- Prairie Lea
- Reedville
- Saint John Colony
- Seawillow
- Soda Springs
- Stairtown
- Taylorsville
- Tilmon
Old Ghost Town
- Polonia is a ghost town. This means it was once a community but is now mostly abandoned.
Images for kids
-
The Caldwell County Courthouse in Lockhart
See also
 In Spanish: Condado de Caldwell (Texas) para niños
