
Climate of Sydney facts for kids
The climate of Sydney, Australia, is known as humid subtropical. This means it has mild winters and warm summers. The ocean helps keep temperatures from getting too extreme, especially near the coast. However, areas further inland, like Western Sydney, can have bigger temperature changes.
Even though Sydney doesn't have a clear "dry" or "wet" season, it usually rains more in summer and autumn. The driest time is around the middle of the year. Rainfall can be different across the city, with coastal areas often getting the most rain. Sydney generally gets about 2,640 hours of sunshine each year, which is quite a lot! It's often sunnier in winter than in summer.
Sydney can experience something called the urban heat island effect. This means that some parts of the city, especially the west, can get much hotter than others. People are working on ways to cool these areas down, like planting more trees and adding gardens to rooftops. Sydney's weather is also affected by big climate patterns like El Niño and La Niña, which can bring droughts and bushfires or storms and floods. Summers in Sydney have been getting longer and winters shorter in recent years.
Contents
Seasons in Sydney
Summer in Sydney

Summer in Sydney is usually warm to hot. Sometimes, cool breezes from the sea help to lower the temperature, but they can also make the air feel more humid. In late summer, temperatures are usually steady, staying between 20°C and 40°C. When it gets really hot (over 37°C), the air is often dry because the heat comes from the Australian desert.
Sydney summers can have quick weather changes. Humidity and rain are common, and thunderstorms happen more often in the western parts of the city. The sun's ultraviolet (UV) index is very high in summer, averaging 12 and sometimes reaching 13. This means you need to protect your skin from the sun.
Hot, dry winds can blow from the Outback in late spring and summer. These winds can push temperatures above 38°C, making the air very dry. But often, a strong, cool wind called a "southerly buster" sweeps in from the south. This wind can quickly drop temperatures, sometimes bringing a thunderstorm or drizzle, and keeping things cooler for a few days.
In the city center, temperatures go above 30°C about 15 days a year, and above 35°C about 3 days a year. But in western suburbs like Liverpool and Penrith, it's much hotter. Penrith can have temperatures over 30°C for 67 days a year, and over 40°C for 4 days a year. The highest temperature ever recorded in Sydney's metropolitan area was 48.9°C in Penrith on January 4, 2020.
Autumn in Sydney
.jpg)
Autumn in Sydney starts with conditions similar to late summer, with temperatures around 25°C to 29°C in early April. The nights start to feel cooler and crisper. Most of Sydney's heavy rain happens in late summer and early autumn. This is because moist winds from the Tasman Sea bring rain to the region.
By mid-April, the weather becomes noticeably cooler. In mid-autumn, temperatures are usually a pleasant 23°C to 24°C. They rarely go above 30°C or below 20°C. In May, the average high is around 20°C to 21°C, with cool and often humid nights that rarely drop below 10°C. You might even feel a bit of winter chill (around 18°C) in the last week of autumn.
Autumn temperatures are usually steady, without the big ups and downs seen in spring and summer. Foggy mornings are common due to the moist easterly winds. The air is most humid in autumn mornings compared to other times of the year.
Winter in Sydney


Winter in central Sydney is generally mild, meaning not too cold. Temperatures rarely drop below 7°C, mostly because the city is close to the ocean. The city center has never recorded frost.
In the western suburbs, temperatures are typically around 17°C during the day and 5°C at night. In the far west, like Richmond and Camden, the temperature difference between day and night is much bigger. Days can be 18°C, but nights can drop to 3°C. This is because these areas are further from the ocean. With such low temperatures, frost can form on some mornings in the far western suburbs.
Sydney gets about 15 foggy days each year, mostly in winter mornings, especially in June. In the far west, the coldest temperature ever recorded was -8°C in Richmond.
In late winter, warm, dry westerly winds can sometimes push temperatures up to 25°C. August is often the sunniest month because of these dry winds coming from inland Australia. The UV index in early winter is low (around 2), meaning you don't need sun protection. But by the end of winter, it reaches 3, so sun protection is a good idea.
Spring in Sydney

Early spring changes quickly. Cool conditions from late winter might continue in September, with temperatures sometimes dropping to 18°C. But because of the fast changes, temperatures over 30°C can also happen in September. By November, it starts to feel like summer, with temperatures usually between 24°C and 30°C, and not much humidity.
Spring days are mostly sunny and often warm, with temperatures between 21°C and 25°C. The air is usually dry. Some days can be windy due to dry westerly winds. Nights can be cool, dropping to around 7°C in some suburbs. Hot air from inland Australia can cause temperatures to soar above 35°C, especially in October and November.
Spring has more extreme and changeable temperatures than other seasons. Sometimes, a very hot, dry day can be suddenly cooled down by a southerly buster, dropping temperatures from 40°C to as low as 19°C. These big changes usually happen in mid-to-late spring.
The highest spring temperature ever recorded at Sydney Airport was 43.4°C on November 25, 1982. In the wider Sydney area, Richmond recorded 45.3°C on November 23, 2014.
D'harawal Seasons
The Dharawal people, who are the traditional owners of the land where Sydney is located, describe six seasons for their country. These seasons are based on changes in nature and weather:
- January–March (Burran): Hot and dry
- April–June (Marrai'gang): Wet, becoming cooler
- June–July (Burrugin): Cold, frosty, short days
- July–August (Wiritjiribin): Cold and windy
- September–October (Ngoonungi): Cool, getting warmer
- November–December (Parra'dowee): Warm and wet
Warm and Cool Periods

The Bureau of Meteorology reported that the years 2002 to 2005 were the warmest in Sydney since records began in 1859. Seven of the ten warmest years in 151 years happened between 2001 and 2010. This shows a warming trend.
However, the summer of 2007–08 was actually the coolest in 11 years and the wettest in six years. It was also one of only three summers in recorded history that didn't have a temperature above 31°C.
In 2014, scientists suggested that sea temperatures off Sydney could become "tropical" in the coming decades. This means winter sea temperatures might stay above 18°C by 2020-2030, and summer sea temperatures might consistently go above 25°C by 2040-2060.
The year 2016 was the warmest on record for Sydney. The summer of 2020-21 was the coolest in a decade, influenced by a La Niña weather pattern.
Microclimate of Sydney


Sydney has different "microclimates" within the city. This means that in late spring and summer, the western suburbs can be 6°C to 10°C hotter than the city center. This happens because of urban sprawl (the way cities spread out) and the "urban heat island" effect. The sea breezes that cool down coastal Sydney don't reach far enough inland to cool the west.
The big temperature difference between coastal and inland areas is caused by hot, dry air from central Australia reaching the west. Also, the way houses are built, the lack of trees, and the Blue Mountains can trap hot air in the west.
For example, when it's 25°C at Bondi Beach, it might be 30°C just west of the Sydney Harbour Bridge, 35°C near Parramatta, and as much as 40°C 40 km inland. These big temperature differences usually happen in late spring when the ocean is still cool, but inland air is already warm.
Urban Heat Island Effect
The urban heat island effect means that cities are hotter than the surrounding rural areas. In Sydney, the western suburbs have a much stronger urban heat island effect than the eastern suburbs. This is partly because of human activity:
- Dark materials like black asphalt roads and dark roofs absorb more sunlight and heat.
- Heat comes from cars and buildings.
- There are fewer natural green spaces.
These factors create a "heat dome" over the city that blocks cooler air from the sea. Scientists say that cooling down the city center, which acts like a "wall" stopping the sea breeze, could help cool western Sydney. Planting more trees can also significantly cool down suburban streets, sometimes by as much as 10°C on hot days. Water features like fountains and open green spaces also help to cool urban areas.
Local councils are working on solutions. Penrith City Council planned to plant 100,000 trees starting in 2018 and is creating a large city park. Parramatta City Council is studying how different tree species can help reduce urban heat.
Precipitation in Sydney
Rainfall Patterns

Sydney usually gets more rain in the first half of the year, especially in late summer and early autumn. This is when the ocean is warmest. During this time, easterly winds bring moist air from the sea to the coast. Rainfall tends to be lower in the second half of the year when dry winds blow from inland Australia.
Rainfall can be unpredictable, so the wettest and driest months change each year. It rains on about 40% of days, but usually from January to June. Sydney generally gets short, heavy rain events that last only 2 or 3 days, followed by many weeks or months of good weather. This is especially true during an El Niño period. During a La Niña event, rain might fall more often over many days or weeks.
In 2022, Sydney recorded 2530 mm of rainfall, making it the wettest year on record.
Storms in Sydney

East coast lows are strong weather systems that bring heavy rainfall, usually in autumn to early winter. They can dump a lot of rain, sometimes as much as 70 mm over two days, or even 100 mm in just three hours during rare events. Other things that bring rain include "Black nor'easters" (in warm months) and thunderstorms.
Sydney has about 40 days with thunderstorms each year, mostly in late spring and summer. These storms usually come from the west and can bring heavy downpours, hail, and strong winds, which quickly cool the air.
The city is rarely hit by cyclones, but remnants of old cyclones can affect it. Sydney is prone to severe hail storms, like the one in 1947, and flash flooding from heavy rain. Scientists predict that rainfall will become even more unpredictable in the future. Parts of western Sydney experienced major floods in 2021 and early 2022.
Snowfall in Sydney
.jpg)
Snow is extremely rare in Sydney. The last time significant snowfall was reported in the Sydney area was on June 28, 1836. On that day, it was said that snow was "nearly 1 inch deep" in Hyde Park. The temperature dropped to 3°C. This snow event even affected trade because people couldn't transport goods to markets.
Since then, there have been a few reports of light snowflakes or melting snow:
- On June 22, 1951, light snowflakes were reported in suburbs like Liverpool and Pymble.
- On July 25, 1986, melting snow was seen in the city center, Sydney Airport, and Bankstown, but it didn't settle on the ground.
- On July 27, 2008, a fall of graupel (soft hail, often mistaken for snow) covered areas like Lindfield in white.
Snow in the Blue Mountains
The Blue Mountains, which are next to Sydney's metropolitan area, are known for snow in winter. Places like Katoomba and Blackheath get the most snow because they are higher up. However, even there, it only snows about five days a year, with two proper snowfalls per season. It's very rare to see snow in the lower parts of the Blue Mountains.
Drought in Sydney
Sydney's climate seems to be getting drier, with fewer rainy days in recent years. In summer, Sydney can go for long periods without rain. These long, dry, and hot periods often lead to bushfires in the areas around the city. Keeping enough water is a constant concern for Sydney during droughts.
In 2005, the city's water reservoirs reached their lowest levels ever. Many areas near bushland have experienced bushfires, notably in 1994 and 2001–02. These usually happen in spring and summer. Heatwaves, which are becoming more common, often lead to water restrictions and a high risk of bushfires. Sometimes, these fires cause smoky haze over the city.
The summer of 2013-14 was the driest in 72 years. The widespread bushfires in December 2019 affected the western edges of the city, and Sydney suffered from dangerous smoky haze for several days. 2019 was one of Sydney's warmest years and the driest since 2005.
Wind in Sydney

Sydney is the windiest capital city in Australia, with average afternoon winds at Sydney Airport reaching about 24.3 km/h. The city is generally windiest from October to January and calmest from March to June. Coastal areas, like the eastern suburbs, are usually windier.
The main winds in coastal Sydney change with the seasons:
- Northeasterly sea breezes: These are common in summer and bring relief on hot days.
- Westerly or north-westerly winds: These are usually strong and cool, especially in winter and early spring.
- Southerly winds: These can be strong in summer, like the "southerly buster."
Spring and autumn winds tend to be more varied.
Southerly busters are expected from October to March. They look like a scroll of cloud being rolled up by the strong wind. The wind change can be very sudden, going from a gentle northeasterly to a strong southerly gale in just ten minutes.
| Wind direction in Sydney from 2002 to 2012 (average values) | |||||||
|---|---|---|---|---|---|---|---|
| North | Northeast | East | South East | Southern | Southwest | West | Northwest |
| 5.9% | 16.9% | 14.1% | 14.6% | 24.9% | 4.1% | 11.9% | 7.6% |
| Source: world-weather.info | |||||||
Föhn Effect

Sydney is located on the eastern side of the Great Dividing Range. This means it experiences a special type of wind called a "föhn" wind, especially from late autumn to spring. This is a dry south-westerly wind that makes the air temperature warmer and brings clear or partly cloudy skies to Sydney. It happens because moist air rises over the mountains, drops its rain, and then dries out and warms up as it descends on the other side.
In the cooler months, these föhn-like winds can be strong and make it feel colder than the actual temperature due to the wind chill. However, this effect is also one reason why Sydney rarely gets extremely cold temperatures in winter. It also explains why late winter and early spring have the most clear, sunny days of the year, as the mountains protect the region from strong westerly cold fronts.
Historical Descriptions
In 1819, a British explorer named William Wentworth described Sydney's climate as "highly healthy and delightful." He noted that summer heats could be extreme, with temperatures often reaching 32°C or even higher. However, he said that the sea breeze regularly started around 9 AM, making the heat bearable for Europeans. He believed that the hot season only lasted about four months, and the rest of the year had a very pleasant temperature.
Wentworth also described Sydney's seasons in detail:
- Summer
During summer, strong thunderstorms with lots of rain are common. The country can look dry, except in moist areas. The most uncomfortable part of the day is usually between 6 AM and 8 AM, before the sea breeze starts, when the temperature is around 22°C.
- Autumn
March is often unsettled and can be the "rainy season," sometimes causing floods. Temperatures vary by about 12°C during the day, from 13-16°C at dawn to 21-24°C at noon. Sea and land breezes become weaker. April starts showery but becomes clear and calm by the end. Temperatures gradually drop through April and May. By May, the weather is lovely, with clear skies and chilly mornings and evenings that make a fire feel nice.
- Winter
June, July, and August are the winter months. Mornings and evenings are very chilly, and nights are extremely cold. Frost is common, especially further inland. Very little rain falls, but heavy dews help keep young crops alive. Fog is also frequent in low, damp areas. The average temperature is 4-7°C at dawn and 13-16°C at noon.
- Spring
September, October, and November are spring. In early September, fogs continue, nights are cold, but days are clear and pleasant. By the end of September, it starts to get warmer, with light showers and thunderstorms. Temperatures rise through October and November, with hot, dry winds becoming common. Strong thunderstorms with rain or hail can occur.
Climate Data
| Weather chart for Sydney, Australia | |||||||||||||||||||||||||||||||||||||||||||||||
|---|---|---|---|---|---|---|---|---|---|---|---|---|---|---|---|---|---|---|---|---|---|---|---|---|---|---|---|---|---|---|---|---|---|---|---|---|---|---|---|---|---|---|---|---|---|---|---|
| J | F | M | A | M | J | J | A | S | O | N | D | ||||||||||||||||||||||||||||||||||||
|
91
27
20
|
132
27
20
|
118
26
19
|
114
24
15
|
101
21
12
|
142
18
10
|
80
18
8
|
75
19
9
|
63
22
12
|
68
23
14
|
91
24
17
|
73
26
18
|
||||||||||||||||||||||||||||||||||||
| temperatures in °C precipitation totals in mm |
|||||||||||||||||||||||||||||||||||||||||||||||
|
Imperial conversion
|
|||||||||||||||||||||||||||||||||||||||||||||||

| Climate data for Sydney | |||||||||||||
|---|---|---|---|---|---|---|---|---|---|---|---|---|---|
| Month | Jan | Feb | Mar | Apr | May | Jun | Jul | Aug | Sep | Oct | Nov | Dec | Year |
| Record high °C (°F) | 45.3 (113.5) |
42.1 (107.8) |
39.8 (103.6) |
33.9 (93.0) |
30.0 (86.0) |
26.9 (80.4) |
25.9 (78.6) |
31.3 (88.3) |
34.6 (94.3) |
38.2 (100.8) |
41.8 (107.2) |
42.2 (108.0) |
45.3 (113.5) |
| Mean daily maximum °C (°F) | 25.9 (78.6) |
25.8 (78.4) |
24.7 (76.5) |
22.4 (72.3) |
19.4 (66.9) |
16.9 (62.4) |
16.3 (61.3) |
17.8 (64.0) |
20.0 (68.0) |
22.1 (71.8) |
23.6 (74.5) |
25.2 (77.4) |
21.7 (71.1) |
| Mean daily minimum °C (°F) | 18.7 (65.7) |
18.8 (65.8) |
17.5 (63.5) |
14.7 (58.5) |
11.5 (52.7) |
9.3 (48.7) |
8.0 (46.4) |
8.9 (48.0) |
11.1 (52.0) |
13.5 (56.3) |
15.6 (60.1) |
17.5 (63.5) |
13.8 (56.8) |
| Record low °C (°F) | 10.6 (51.1) |
9.6 (49.3) |
9.3 (48.7) |
7.0 (44.6) |
4.4 (39.9) |
2.1 (35.8) |
2.2 (36.0) |
2.7 (36.9) |
4.9 (40.8) |
5.7 (42.3) |
7.7 (45.9) |
9.1 (48.4) |
2.1 (35.8) |
| Average rainfall mm (inches) | 101.5 (4.00) |
118.7 (4.67) |
128.9 (5.07) |
125.8 (4.95) |
121.1 (4.77) |
130.7 (5.15) |
97.3 (3.83) |
81.2 (3.20) |
69.1 (2.72) |
77.6 (3.06) |
83.1 (3.27) |
77.8 (3.06) |
1,212.8 (47.75) |
| Average rainy days (≥ of ANY volume) | 12.2 | 12.4 | 13.5 | 12.8 | 13.2 | 12.5 | 11.1 | 10.5 | 10.6 | 11.6 | 11.6 | 11.5 | 143.5 |
| Mean monthly sunshine hours | 220.1 | 194.3 | 198.4 | 192.0 | 182.9 | 165.0 | 198.4 | 220.1 | 216.0 | 223.2 | 234.0 | 235.6 | 2,480 |
| Source: Bureau of Meteorology | |||||||||||||
_By_Air.jpg)
| Climate data for Sydney Airport (Southeastern Sydney, St George, parts of Southern Sydney, and southern City of Sydney) | |||||||||||||
|---|---|---|---|---|---|---|---|---|---|---|---|---|---|
| Month | Jan | Feb | Mar | Apr | May | Jun | Jul | Aug | Sep | Oct | Nov | Dec | Year |
| Record high °C (°F) | 46.4 (115.5) |
42.9 (109.2) |
41.2 (106.2) |
35.7 (96.3) |
29.1 (84.4) |
25.6 (78.1) |
26.7 (80.1) |
30.9 (87.6) |
35.9 (96.6) |
39.1 (102.4) |
43.4 (110.1) |
43.5 (110.3) |
46.4 (115.5) |
| Mean daily maximum °C (°F) | 27.7 (81.9) |
27.1 (80.8) |
25.8 (78.4) |
23.3 (73.9) |
20.6 (69.1) |
18.1 (64.6) |
17.7 (63.9) |
19.1 (66.4) |
21.6 (70.9) |
23.6 (74.5) |
24.6 (76.3) |
26.4 (79.5) |
23.0 (73.4) |
| Mean daily minimum °C (°F) | 20.0 (68.0) |
20.0 (68.0) |
18.5 (65.3) |
15.2 (59.4) |
12.1 (53.8) |
9.8 (49.6) |
8.5 (47.3) |
9.3 (48.7) |
11.9 (53.4) |
14.4 (57.9) |
16.5 (61.7) |
18.4 (65.1) |
14.5 (58.1) |
| Record low °C (°F) | 13.0 (55.4) |
12.0 (53.6) |
8.8 (47.8) |
7.1 (44.8) |
3.8 (38.8) |
2.2 (36.0) |
0.8 (33.4) |
3.2 (37.8) |
5.1 (41.2) |
6.0 (42.8) |
7.6 (45.7) |
11 (52) |
0.8 (33.4) |
| Average rainfall mm (inches) | 80.7 (3.18) |
117.2 (4.61) |
96.3 (3.79) |
98.2 (3.87) |
89.3 (3.52) |
125.9 (4.96) |
69.5 (2.74) |
63.3 (2.49) |
59.0 (2.32) |
55.5 (2.19) |
72.3 (2.85) |
67.1 (2.64) |
996.2 (39.22) |
| Average rainy days (≥ 1 mm) | 7.8 | 8.6 | 9.4 | 8.2 | 7.6 | 8.9 | 7.0 | 5.4 | 6.3 | 7.4 | 8.6 | 7.9 | 93.1 |
| Average afternoon relative humidity (%) | 59 | 62 | 60 | 58 | 59 | 58 | 53 | 46 | 49 | 52 | 56 | 57 | 56 |
| Average dew point °C (°F) | 16.2 (61.2) |
16.8 (62.2) |
15.5 (59.9) |
12.7 (54.9) |
9.9 (49.8) |
7.6 (45.7) |
5.6 (42.1) |
5.5 (41.9) |
7.7 (45.9) |
9.9 (49.8) |
12.3 (54.1) |
14.3 (57.7) |
11.2 (52.2) |
| Mean monthly sunshine hours | 232.5 | 205.9 | 210.8 | 213.0 | 204.6 | 171.0 | 207.7 | 248.0 | 243.0 | 244.9 | 222.0 | 235.6 | 2,639 |
| Source: Bureau of Meteorology (1991-2020 averages, records 1939-) | |||||||||||||
| Climate data for Parramatta (Western Sydney) | |||||||||||||
|---|---|---|---|---|---|---|---|---|---|---|---|---|---|
| Month | Jan | Feb | Mar | Apr | May | Jun | Jul | Aug | Sep | Oct | Nov | Dec | Year |
| Record high °C (°F) | 47.3 (117.1) |
44.5 (112.1) |
40.5 (104.9) |
37.0 (98.6) |
29.2 (84.6) |
25.5 (77.9) |
26.8 (80.2) |
30.6 (87.1) |
35.4 (95.7) |
40.1 (104.2) |
42.7 (108.9) |
44.0 (111.2) |
47.0 (116.6) |
| Mean daily maximum °C (°F) | 28.6 (83.5) |
27.9 (82.2) |
26.3 (79.3) |
23.8 (74.8) |
20.6 (69.1) |
17.8 (64.0) |
17.4 (63.3) |
19.1 (66.4) |
21.7 (71.1) |
24.0 (75.2) |
25.4 (77.7) |
27.5 (81.5) |
23.3 (73.9) |
| Mean daily minimum °C (°F) | 17.6 (63.7) |
17.6 (63.7) |
15.9 (60.6) |
12.8 (55.0) |
9.9 (49.8) |
7.5 (45.5) |
6.3 (43.3) |
7.1 (44.8) |
9.4 (48.9) |
12.0 (53.6) |
14.1 (57.4) |
16.3 (61.3) |
12.2 (54.0) |
| Record low °C (°F) | 10.1 (50.2) |
9.2 (48.6) |
6.8 (44.2) |
4.0 (39.2) |
1.4 (34.5) |
0.8 (33.4) |
−1.0 (30.2) |
0.7 (33.3) |
0.7 (33.3) |
3.6 (38.5) |
4.0 (39.2) |
7.7 (45.9) |
−1.0 (30.2) |
| Average rainfall mm (inches) | 100.7 (3.96) |
124.8 (4.91) |
109.3 (4.30) |
88.5 (3.48) |
70.5 (2.78) |
87.1 (3.43) |
45.6 (1.80) |
56.1 (2.21) |
52.8 (2.08) |
68.1 (2.68) |
87.0 (3.43) |
70.2 (2.76) |
958.6 (37.74) |
| Average rainy days (≥ 1 mm) | 9.0 | 9.3 | 10.1 | 7.1 | 6.9 | 7.5 | 5.6 | 5.2 | 5.8 | 7.5 | 8.7 | 7.7 | 90.4 |
| Average afternoon relative humidity (%) | 57 | 59 | 59 | 58 | 60 | 59 | 55 | 46 | 46 | 49 | 54 | 55 | 55 |
| Average dew point °C (°F) | 16.7 (62.1) |
17.2 (63.0) |
15.6 (60.1) |
12.5 (54.5) |
10.6 (51.1) |
8.3 (46.9) |
6.7 (44.1) |
5.5 (41.9) |
7.4 (45.3) |
10.0 (50.0) |
12.8 (55.0) |
14.9 (58.8) |
11.5 (52.7) |
| Source: Bureau of Meteorology | |||||||||||||
| Climate data for Bankstown Airport (South Western Sydney) | |||||||||||||
|---|---|---|---|---|---|---|---|---|---|---|---|---|---|
| Month | Jan | Feb | Mar | Apr | May | Jun | Jul | Aug | Sep | Oct | Nov | Dec | Year |
| Record high °C (°F) | 47.0 (116.6) |
45.3 (113.5) |
40.1 (104.2) |
35.9 (96.6) |
28.8 (83.8) |
25.4 (77.7) |
26.8 (80.2) |
30.2 (86.4) |
35.0 (95.0) |
37.4 (99.3) |
41.9 (107.4) |
44.9 (112.8) |
47.0 (116.6) |
| Mean daily maximum °C (°F) | 29.0 (84.2) |
28.2 (82.8) |
26.5 (79.7) |
24.0 (75.2) |
20.8 (69.4) |
18.0 (64.4) |
17.6 (63.7) |
19.3 (66.7) |
22.2 (72.0) |
24.4 (75.9) |
25.8 (78.4) |
27.6 (81.7) |
23.6 (74.5) |
| Daily mean °C (°F) | 23.8 (74.8) |
23.3 (73.9) |
21.5 (70.7) |
18.4 (65.1) |
15.1 (59.2) |
12.5 (54.5) |
11.5 (52.7) |
12.7 (54.9) |
15.6 (60.1) |
18.2 (64.8) |
20.3 (68.5) |
22.2 (72.0) |
17.9 (64.3) |
| Mean daily minimum °C (°F) | 18.5 (65.3) |
18.3 (64.9) |
16.4 (61.5) |
12.8 (55.0) |
9.3 (48.7) |
6.9 (44.4) |
5.4 (41.7) |
6.0 (42.8) |
8.9 (48.0) |
12.0 (53.6) |
14.7 (58.5) |
16.8 (62.2) |
12.2 (53.9) |
| Record low °C (°F) | 10.4 (50.7) |
10.0 (50.0) |
8.1 (46.6) |
2.4 (36.3) |
1.6 (34.9) |
−0.8 (30.6) |
−2.3 (27.9) |
−0.5 (31.1) |
0.0 (32.0) |
4.8 (40.6) |
6.8 (44.2) |
6.3 (43.3) |
−2.3 (27.9) |
| Average precipitation mm (inches) | 87.3 (3.44) |
107.3 (4.22) |
81.7 (3.22) |
67.1 (2.64) |
55.1 (2.17) |
83.0 (3.27) |
44.5 (1.75) |
42.7 (1.68) |
44.2 (1.74) |
53.2 (2.09) |
67.8 (2.67) |
66.6 (2.62) |
800.5 (31.51) |
| Average precipitation days (≥ 1.0 mm) | 7.6 | 7.4 | 8.3 | 6.2 | 5.8 | 6.8 | 5.4 | 3.9 | 5.0 | 6.0 | 7.4 | 7.5 | 77.3 |
| Average relative humidity (%) | 62.5 | 67.0 | 66.5 | 63.5 | 66.5 | 67.5 | 65.0 | 55.5 | 53.5 | 54.5 | 60.0 | 60.0 | 61.8 |
| Average dew point °C (°F) | 16.3 (61.3) |
17.1 (62.8) |
15.2 (59.4) |
12.1 (53.8) |
9.7 (49.5) |
7.5 (45.5) |
6.0 (42.8) |
5.2 (41.4) |
7.4 (45.3) |
9.7 (49.5) |
12.4 (54.3) |
14.4 (57.9) |
11.1 (52.0) |
| Source: Bureau of Meteorology | |||||||||||||
| Climate data for Penrith (Outer Western Sydney) | |||||||||||||
|---|---|---|---|---|---|---|---|---|---|---|---|---|---|
| Month | Jan | Feb | Mar | Apr | May | Jun | Jul | Aug | Sep | Oct | Nov | Dec | Year |
| Record high °C (°F) | 48.9 (120.0) |
46.9 (116.4) |
40.6 (105.1) |
34.2 (93.6) |
28.4 (83.1) |
26.0 (78.8) |
28.2 (82.8) |
29.7 (85.5) |
37.3 (99.1) |
38.9 (102.0) |
44.9 (112.8) |
46.3 (115.3) |
48.9 (120.0) |
| Mean daily maximum °C (°F) | 30.8 (87.4) |
29.3 (84.7) |
27.5 (81.5) |
24.4 (75.9) |
21.0 (69.8) |
18.1 (64.6) |
17.7 (63.9) |
19.9 (67.8) |
23.3 (73.9) |
25.9 (78.6) |
27.3 (81.1) |
29.2 (84.6) |
24.5 (76.1) |
| Daily mean °C (°F) | 24.8 (76.6) |
23.9 (75.0) |
22.1 (71.8) |
18.8 (65.8) |
15.2 (59.4) |
12.5 (54.5) |
11.6 (52.9) |
13.1 (55.6) |
16.4 (61.5) |
19.0 (66.2) |
21.2 (70.2) |
23.1 (73.6) |
18.4 (65.1) |
| Mean daily minimum °C (°F) | 18.5 (65.3) |
18.5 (65.3) |
16.6 (61.9) |
13.1 (55.6) |
9.3 (48.7) |
6.9 (44.4) |
5.4 (41.7) |
6.2 (43.2) |
9.4 (48.9) |
12.1 (53.8) |
15.0 (59.0) |
16.9 (62.4) |
12.3 (54.1) |
| Record low °C (°F) | 10.6 (51.1) |
11.6 (52.9) |
8.3 (46.9) |
3.6 (38.5) |
2.1 (35.8) |
−1.1 (30.0) |
−1.4 (29.5) |
−0.5 (31.1) |
2.2 (36.0) |
5.0 (41.0) |
7.8 (46.0) |
9.8 (49.6) |
−1.4 (29.5) |
| Average precipitation mm (inches) | 90.4 (3.56) |
131.6 (5.18) |
73.1 (2.88) |
42.2 (1.66) |
40.0 (1.57) |
51.6 (2.03) |
29.6 (1.17) |
30.1 (1.19) |
31.9 (1.26) |
54.5 (2.15) |
82.9 (3.26) |
60.1 (2.37) |
719.2 (28.31) |
| Average precipitation days (≥ 1 mm) | 7.7 | 8.3 | 8.8 | 5.6 | 4.3 | 5.6 | 4.2 | 3.3 | 4.6 | 5.6 | 8.0 | 7.4 | 73.4 |
| Average afternoon relative humidity (%) | 47 | 53 | 52 | 49 | 52 | 55 | 50 | 41 | 40 | 41 | 46 | 45 | 48 |
| Average dew point °C (°F) | 14.7 (58.5) |
16.2 (61.2) |
14.4 (57.9) |
10.8 (51.4) |
8.9 (48.0) |
7.2 (45.0) |
5.2 (41.4) |
3.9 (39.0) |
6.2 (43.2) |
7.5 (45.5) |
10.8 (51.4) |
12.6 (54.7) |
9.9 (49.8) |
| Climate data for Camden Airport AWS (MacArthur) | |||||||||||||
|---|---|---|---|---|---|---|---|---|---|---|---|---|---|
| Month | Jan | Feb | Mar | Apr | May | Jun | Jul | Aug | Sep | Oct | Nov | Dec | Year |
| Record high °C (°F) | 46.4 (115.5) |
45.6 (114.1) |
41.0 (105.8) |
38.5 (101.3) |
29.5 (85.1) |
24.9 (76.8) |
27.0 (80.6) |
30.2 (86.4) |
36.5 (97.7) |
40.5 (104.9) |
42.6 (108.7) |
43.1 (109.6) |
46.4 (115.5) |
| Mean daily maximum °C (°F) | 29.5 (85.1) |
28.6 (83.5) |
26.8 (80.2) |
23.8 (74.8) |
20.6 (69.1) |
17.7 (63.9) |
17.3 (63.1) |
19.0 (66.2) |
21.9 (71.4) |
24.3 (75.7) |
26.3 (79.3) |
28.5 (83.3) |
23.7 (74.7) |
| Mean daily minimum °C (°F) | 16.8 (62.2) |
16.8 (62.2) |
14.9 (58.8) |
11.1 (52.0) |
7.1 (44.8) |
4.6 (40.3) |
3.0 (37.4) |
3.9 (39.0) |
6.8 (44.2) |
9.9 (49.8) |
13.0 (55.4) |
15.2 (59.4) |
10.2 (50.4) |
| Record low °C (°F) | 7.9 (46.2) |
7.2 (45.0) |
1.0 (33.8) |
−0.7 (30.7) |
−2.2 (28.0) |
−5.4 (22.3) |
−6.0 (21.2) |
−4.0 (24.8) |
−1.8 (28.8) |
1.3 (34.3) |
3.8 (38.8) |
5.7 (42.3) |
−6.0 (21.2) |
| Average precipitation mm (inches) | 84.1 (3.31) |
96.9 (3.81) |
89.3 (3.52) |
68.5 (2.70) |
53.5 (2.11) |
67.0 (2.64) |
37.6 (1.48) |
46.0 (1.81) |
39.6 (1.56) |
61.2 (2.41) |
75.8 (2.98) |
56.8 (2.24) |
777.3 (30.60) |
| Average precipitation days (≥ 1 mm) | 5.0 | 5.1 | 5.1 | 4.1 | 3.6 | 3.6 | 3.0 | 2.9 | 3.2 | 4.4 | 4.9 | 4.4 | 49.3 |
| Average afternoon relative humidity (%) | 49 | 52 | 52 | 52 | 52 | 53 | 50 | 43 | 44 | 47 | 50 | 46 | 49 |
| Average dew point °C (°F) | 14.7 (58.5) |
15.1 (59.2) |
13.8 (56.8) |
11.0 (51.8) |
8.5 (47.3) |
6.2 (43.2) |
4.7 (40.5) |
4.0 (39.2) |
6.2 (43.2) |
8.8 (47.8) |
11.6 (52.9) |
12.5 (54.5) |
9.8 (49.6) |
| Climate data for Sydney CBD (Mean Maximum and Mean Minimum) | |||||||||||||
|---|---|---|---|---|---|---|---|---|---|---|---|---|---|
| Month | Jan | Feb | Mar | Apr | May | Jun | Jul | Aug | Sep | Oct | Nov | Dec | Year |
| Mean maximum °C (°F) | 31.1 (88.0) |
30.3 (86.5) |
28.7 (83.7) |
26.8 (80.2) |
24.1 (75.4) |
21.0 (69.8) |
20.8 (69.4) |
23.0 (73.4) |
26.7 (80.1) |
29.0 (84.2) |
29.3 (84.7) |
30.3 (86.5) |
31.1 (88.0) |
| Mean minimum °C (°F) | 17.2 (63.0) |
17.2 (63.0) |
15.5 (59.9) |
12.5 (54.5) |
9.5 (49.1) |
7.3 (45.1) |
6.4 (43.5) |
7.0 (44.6) |
9.0 (48.2) |
11.2 (52.2) |
13.2 (55.8) |
15.4 (59.7) |
6.4 (43.5) |
| Climate data for Western Sydney – Prospect Reservoir (Mean Maximum and Mean Minimum) | |||||||||||||
|---|---|---|---|---|---|---|---|---|---|---|---|---|---|
| Month | Jan | Feb | Mar | Apr | May | Jun | Jul | Aug | Sep | Oct | Nov | Dec | Year |
| Mean maximum °C (°F) | 35.4 (95.7) |
34.0 (93.2) |
31.1 (88.0) |
28.0 (82.4) |
23.8 (74.8) |
20.0 (68.0) |
19.8 (67.6) |
22.7 (72.9) |
27.1 (80.8) |
31.0 (87.8) |
32.5 (90.5) |
34.0 (93.2) |
35.4 (95.7) |
| Mean minimum °C (°F) | 14.6 (58.3) |
15.0 (59.0) |
13.0 (55.4) |
9.7 (49.5) |
6.0 (42.8) |
3.9 (39.0) |
2.7 (36.9) |
3.5 (38.3) |
5.7 (42.3) |
8.3 (46.9) |
10.6 (51.1) |
13.0 (55.4) |
2.7 (36.9) |
| Climate data for Far-western Sydney – Penrith (Mean Maximum and Mean Minimum) | |||||||||||||
|---|---|---|---|---|---|---|---|---|---|---|---|---|---|
| Month | Jan | Feb | Mar | Apr | May | Jun | Jul | Aug | Sep | Oct | Nov | Dec | Year |
| Mean maximum °C (°F) | 39.1 (102.4) |
35.7 (96.3) |
33.0 (91.4) |
29.0 (84.2) |
24.8 (76.6) |
20.7 (69.3) |
20.9 (69.6) |
23.8 (74.8) |
29.2 (84.6) |
33.1 (91.6) |
34.8 (94.6) |
37.0 (98.6) |
39.1 (102.4) |
| Mean minimum °C (°F) | 15.5 (59.9) |
15.5 (59.9) |
13.8 (56.8) |
9.6 (49.3) |
4.9 (40.8) |
2.7 (36.9) |
1.6 (34.9) |
2.3 (36.1) |
5.6 (42.1) |
8.0 (46.4) |
11.4 (52.5) |
13.6 (56.5) |
1.6 (34.9) |
: The Observatory Hill weather station covers the climate for Sydney CBD, the City of Sydney's northern portion and as well as the harbourside eastern suburbs and the Lower North Shore suburbs which lie on Port Jackson. The suburbs in the southern parts of the City of Sydney or the Inner City region are more adjacent to Sydney Airport's climate station.
Miscellaneous Data
| Month | Jan | Feb | Mar | Apr | May | Jun | Jul | Aug | Sep | Oct | Nov | Dec | Year |
|---|---|---|---|---|---|---|---|---|---|---|---|---|---|
| Average dew point °C (°F) | 16.5 (61.7) |
17.2 (63.0) |
15.4 (59.7) |
12.7 (54.9) |
10.3 (50.5) |
7.8 (46.0) |
6.1 (43.0) |
5.4 (41.7) |
7.8 (46.0) |
10.2 (50.4) |
12.6 (54.7) |
14.6 (58.3) |
11.4 (52.5) |
| Mean daily sunshine hours | 7.5 | 7.1 | 6.8 | 7.1 | 6.6 | 5.7 | 6.7 | 8.0 | 8.1 | 7.9 | 7.5 | 7.6 | 7.2 |
| Mean daily daylight hours | 13.5 | 13.4 | 12.4 | 11.3 | 10.4 | 10.0 | 10.1 | 10.9 | 11.9 | 13.0 | 13.9 | 14.4 | 12.1 |
| Percent possible sunshine | 53 | 54 | 56 | 61 | 59 | 60 | 65 | 72 | 66 | 61 | 55 | 55 | 60 |
| Average ultraviolet index | 12 | 11 | 8 | 5 | 3 | 2 | 2 | 3 | 5 | 8 | 10 | 11 | 7 |
| Source 1: Bureau of Meteorology | |||||||||||||
| Source 2: Bureau of Meteorology (UV index) | |||||||||||||
| Sea temperature | |||||||||||||
|---|---|---|---|---|---|---|---|---|---|---|---|---|---|
| Month | January | February | March | April | May | June | July | August | September | October | November | December | Year |
| Average sea temperature °C (°F) | 23.3 (73.9) |
23.7 (74.7) |
23.4 (74.1) |
22.7 (72.8) |
20.7 (69.3) |
19.3 (66.8) |
19.1 (66.4) |
18.8 (65.8) |
18.5 (65.3) |
19.2 (66.5) |
20.6 (69.0) |
21.9 (71.4) |
20.9 (69.6) |
| Source: Metoc (sea temperature) | |||||||||||||
Images for kids
-
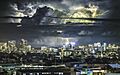
A thunderstorm in Sydney
.jpg)
