Marion County, Indiana facts for kids
Quick facts for kids
Marion County
|
|
|---|---|

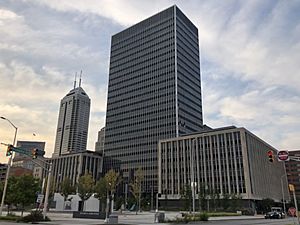
The City-County Building in Indianapolis
|
|

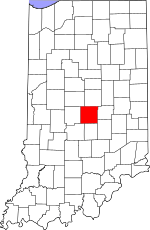
Location within the U.S. state of Indiana
|
|
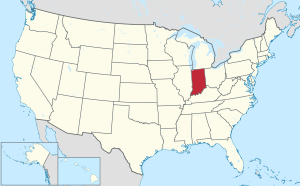
 Indiana's location within the U.S. |
|
| Country | |
| State | |
| Founded | April 1, 1822 |
| Named for | Francis Marion |
| Seat | Indianapolis |
| Largest city | Indianapolis |
| Area | |
| • Total | 403.01 sq mi (1,043.8 km2) |
| • Land | 396.30 sq mi (1,026.4 km2) |
| • Water | 6.71 sq mi (17.4 km2) |
| Population
(2020)
|
|
| • Total | 977,203 |
| • Estimate
(2023)
|
968,460 |
| • Density | 2,424.761/sq mi (936.206/km2) |
| Time zone | UTC−5 (Eastern) |
| • Summer (DST) | UTC−4 (EDT) |
| Congressional districts | 6th, 7th |
|
|
Marion County is a large county in the state of Indiana, United States. In 2020, about 977,203 people lived here. This makes it the most populated county in Indiana. It is also the 54th most populated county in the entire U.S.
Marion County is the main part of the larger Indianapolis–Carmel–Greenwood area. Indianapolis is the county seat, which means it is the center of the county's government. Indianapolis is also the capital city of Indiana and its largest city. Marion County and Indianapolis share a special combined government system called Unigov.
Contents
Geography
Marion County has low, rolling hills. Most of the land is used for cities or farms. Only areas around rivers and streams still have many trees. The highest point in the county is about 920 feet (280 meters) above sea level. This spot is in the northwest corner of the county.
The county covers about 403 square miles (1,044 square kilometers). Most of this area, about 396 square miles (1,026 square kilometers), is land. The rest, about 6.7 square miles (17 square kilometers), is water.
The White River flows through the middle of Marion County. Other creeks like Eagle Creek and Fall Creek join it. These creeks have dams that create lakes, such as Eagle Creek Reservoir and Geist Reservoir.
Marion County has two state parks: Fort Harrison State Park and White River State Park. There are also many local parks for people to enjoy.
Adjacent counties
- Hamilton County - north
- Hancock County - east
- Shelby County - southeast
- Johnson County - south
- Morgan County - southwest
- Hendricks County - west
- Boone County - northwest
Transportation
Major highways
Many important highways run through Marion County. These roads help people travel easily across the county and to other states.
 I-65
I-65 I-69
I-69 I-70
I-70 I-74
I-74 I-465
I-465 US 31
US 31 US 36
US 36 US 40
US 40 US 52
US 52 US 136
 US 421
 SR 67
SR 67 SR 134
 SR 135
Transit
People in Marion County can use different types of public transportation.
- Central Indiana Regional Transportation Authority
- IndyGo Red Line (a bus rapid transit system)
- Indianapolis Union Station (a train station)
- Amtrak Cardinal (a passenger train service)
- Barons Bus Lines
- Burlington Trailways
- Flixbus
- Greyhound Lines
- Miller Transportation
Airports
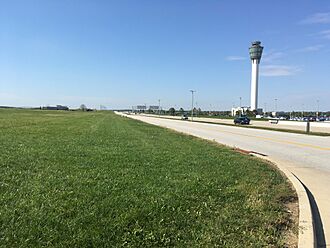
Marion County has several airports, including a major international airport.
- KIND - Indianapolis International Airport
- KEYE - Eagle Creek Airpark
- Post-Air Airport
History
Marion County was created on April 1, 1822. It was formed from land that was bought from the Lenape people. This land deal was called the "New Purchase" and happened through the Treaty of St. Mary's. The county is named after Francis Marion. He was a brigadier general from South Carolina during the American Revolutionary War.
The capital of Indiana moved to Indianapolis in Marion County on January 10, 1825. Before that, the capital was in Corydon. Moving the capital to Indianapolis helped the county grow very quickly.
Climate and weather
| Weather chart for Indianapolis, Indiana | |||||||||||||||||||||||||||||||||||||||||||||||
|---|---|---|---|---|---|---|---|---|---|---|---|---|---|---|---|---|---|---|---|---|---|---|---|---|---|---|---|---|---|---|---|---|---|---|---|---|---|---|---|---|---|---|---|---|---|---|---|
| J | F | M | A | M | J | J | A | S | O | N | D | ||||||||||||||||||||||||||||||||||||
|
3.1
36
21
|
2.4
41
24
|
3.7
52
34
|
4.3
64
43
|
4.8
73
54
|
5
82
63
|
4.4
86
66
|
3.2
84
65
|
3.1
78
57
|
3.2
66
46
|
3.5
52
35
|
2.9
40
26
|
||||||||||||||||||||||||||||||||||||
| temperatures in °F precipitation totals in inches source: The Weather Channel |
|||||||||||||||||||||||||||||||||||||||||||||||
|
Metric conversion
|
|||||||||||||||||||||||||||||||||||||||||||||||
The weather in Marion County changes throughout the year. In January, the average low temperature is about 20°F (–7°C). In July, the average high temperature is about 86°F (30°C). The coldest temperature ever recorded was –22°F (–30°C) in January 1985. The hottest was 104°F (40°C) in June 1988.
The amount of rain and snow also changes. January usually gets about 2.05 inches (5.2 cm) of precipitation. July gets the most, with about 4.78 inches (12.1 cm).
Demographics
The population of Marion County has grown a lot over the years.
| Historical population | |||
|---|---|---|---|
| Census | Pop. | %± | |
| 1830 | 7,192 | — | |
| 1840 | 16,080 | 123.6% | |
| 1850 | 24,103 | 49.9% | |
| 1860 | 39,855 | 65.4% | |
| 1870 | 71,939 | 80.5% | |
| 1880 | 102,782 | 42.9% | |
| 1890 | 141,156 | 37.3% | |
| 1900 | 197,227 | 39.7% | |
| 1910 | 263,661 | 33.7% | |
| 1920 | 348,061 | 32.0% | |
| 1930 | 422,666 | 21.4% | |
| 1940 | 460,926 | 9.1% | |
| 1950 | 551,777 | 19.7% | |
| 1960 | 697,567 | 26.4% | |
| 1970 | 792,299 | 13.6% | |
| 1980 | 765,233 | −3.4% | |
| 1990 | 797,159 | 4.2% | |
| 2000 | 860,454 | 7.9% | |
| 2010 | 903,393 | 5.0% | |
| 2020 | 977,203 | 8.2% | |
| 2023 (est.) | 968,460 | 7.2% | |
| US Decennial Census 1790-1960 1900-1990 1990-2000 2010-2019 |
|||
In 2010, there were 903,393 people living in Marion County. There were about 366,176 households. A household is a group of people living together. The county had about 2,280 people per square mile.
Most people in the county were white (62.7%). About 26.7% were black or African American. About 2.0% were Asian, and 0.3% were American Indian. People of Hispanic or Latino origin made up 9.3% of the population.
The average age of people in Marion County was 33.9 years old. About 32.3% of households had children under 18 living with them. The average household had 2.42 people.
The median income for a household was $47,697. This means half of the households earned more, and half earned less. About 17.3% of the population lived below the poverty line. This included 25.7% of people under 18.
Cities and towns
Marion County has a special type of government called Unigov. This means the city of Indianapolis and Marion County governments are combined. Because of this, only four cities and towns in the county have their own full governments. These are called "excluded cities."
Other smaller towns in the county are called "included towns." They have less power. They mostly handle things like zoning (how land can be used) and their own police. They can also collect some taxes for these services.
Municipalities
Excluded cities and town
Included towns
Townships
Marion County is divided into nine areas called townships. They are set up in a grid pattern.
| Pike | Washington | Lawrence |
| Wayne | Center | Warren |
| Decatur | Perry | Franklin |
Education
Marion County has many school districts. Each district manages schools in its area.
- Beech Grove City Schools
- Decatur Township Metropolitan School District
- Franklin Township Community School Corporation
- Indianapolis Public Schools
- Lawrence Township Metropolitan School District
- Perry Township Metropolitan School District
- Pike Township Metropolitan School District
- Speedway School Town
- Warren Township Metropolitan School District
- Washington Township Metropolitan School District
- Wayne Township Metropolitan School District
There are also two special state-run schools in the county:
- Indiana School for the Blind and Visually Impaired
- Indiana School for the Deaf
See also
 In Spanish: Condado de Marion (Indiana) para niños


