
New London County, Connecticut facts for kids
Quick facts for kids
New London County
|
|
|---|---|
|
County of Connecticut
|
|

Former New London County Courthouse
|
|

Location within the U.S. state of Connecticut
|
|
 Connecticut's location within the U.S. |
|
| Country | |
| State | |
| Founded | 1646 by John Winthrop, Jr. |
| Named for | London, England |
| Seat | none (since 1960) New London, Connecticut (before 1960) |
| Largest city | Norwich |
| Area | |
| • Total | 772 sq mi (2,000 km2) |
| • Land | 665 sq mi (1,720 km2) |
| • Water | 107 sq mi (280 km2) 13.8%% |
| Population
(2020)
|
|
| • Total | 268,555 |
| • Density | 403.8/sq mi (155.9/km2) |
| Time zone | UTC−5 (Eastern) |
| • Summer (DST) | UTC−4 (EDT) |
| Congressional district | 2nd |
New London County is a region in the southeastern part of Connecticut. It includes the cities of Norwich and New London, Connecticut. Unlike many other places in the United States, New London County does not have its own county government or a county seat (a main administrative city). This is true for all eight counties in Connecticut. Instead, local towns handle all government tasks, like fire services, snow removal, and schools.
As of 2020, about 268,555 people lived in New London County. This area is also home to land reservations for four of Connecticut's five state-recognized Native American tribes. In 2022, the U.S. Census Bureau started recognizing Connecticut's "councils of governments" as the official county equivalents. This is because the old county governments were stopped in 1960. The historical counties, like New London, still exist in name but are no longer used for official statistics.
Contents
Exploring New London County's Past
Southeastern New England was once home to the powerful Pequot people. They spoke the Mohegan-Pequot language, which is part of the Algonquian family. In 1637, after years of fighting, English colonists and their Native American allies won the Pequot War. This ended the Pequots' control over the area. Today, two Pequot tribes and three other tribes are officially recognized by the state.
How New London County Began
New London County was one of Connecticut's first four counties. It was officially created on May 10, 1666. The Connecticut General Court decided that the area from the Paukatuck River to the western edge of Killingworth would become "N: London County." They also decided that the county court would meet in New London twice a year.
When it was first formed in 1666, New London County included the towns of Stonington, Norwich, New London, and Saybrook. Killingworth was added in 1667. Over the next few decades, more towns joined New London County, such as Preston (1687), Colchester (1699), and Lebanon (1700). Settlements in the Quinebaug Valley became part of the county in 1697, with Plainfield joining in 1699. By 1717, even more towns in northeastern Connecticut were added.
Changes to County Borders Over Time
The size of New London County changed several times. In 1726, Windham County was created from parts of Hartford and New London counties. New London County lost towns like Voluntown, Plainfield, and Lebanon. Later, in 1785, Middlesex County was formed. This new county took towns along the lower Connecticut River, including Killingworth and Saybrook, from New London County.
There were also smaller boundary changes in the 1800s. Marlborough was established in 1803. Lebanon returned to New London County from Windham County in 1824. Finally, Voluntown also moved back from Windham County in 1881.
Geography of New London County
New London County covers a total area of about 772 square miles. Of this, 665 square miles are land, and 107 square miles (about 13.8%) are water.
The land in the county is mostly flat. It only gets higher in the very northern part. The highest point is Gates Hill in the town of Lebanon. It is about 660 feet (201 meters) above sea level. The lowest point is sea level, along the coast.
Neighboring Counties
New London County shares borders with several other counties:
- Windham County (north)
- Kent County, Rhode Island (northeast)
- Washington County, Rhode Island (east)
- Middlesex County (west)
- Tolland County (northwest)
- Hartford County (northwest)
- Suffolk County, New York (south)
People of New London County
| Historical population | |||
|---|---|---|---|
| Census | Pop. | %± | |
| 1790 | 32,918 | — | |
| 1800 | 34,888 | 6.0% | |
| 1810 | 34,707 | −0.5% | |
| 1820 | 35,943 | 3.6% | |
| 1830 | 42,201 | 17.4% | |
| 1840 | 44,463 | 5.4% | |
| 1850 | 51,821 | 16.5% | |
| 1860 | 61,731 | 19.1% | |
| 1870 | 66,570 | 7.8% | |
| 1880 | 73,152 | 9.9% | |
| 1890 | 76,634 | 4.8% | |
| 1900 | 82,758 | 8.0% | |
| 1910 | 91,253 | 10.3% | |
| 1920 | 104,611 | 14.6% | |
| 1930 | 118,966 | 13.7% | |
| 1940 | 125,224 | 5.3% | |
| 1950 | 144,821 | 15.6% | |
| 1960 | 185,745 | 28.3% | |
| 1970 | 230,654 | 24.2% | |
| 1980 | 238,409 | 3.4% | |
| 1990 | 254,957 | 6.9% | |
| 2000 | 259,088 | 1.6% | |
| 2010 | 274,055 | 5.8% | |
| 2020 | 268,555 | −2.0% | |
| U.S. Decennial Census 1790-1960 1900-1990 1990-2000 2010-2018 |
|||
Who Lives Here?
In 2010, there were 274,055 people living in New London County. The population density was about 412 people per square mile. Most people (82.2%) were white. Other groups included Black or African American (5.8%), Asian (4.2%), and American Indian (0.9%). About 8.5% of the population was of Hispanic or Latino background.
Many people in the county have Irish (18.9%), Italian (15.2%), English (14.8%), or German (11.6%) roots. The average age in the county was 40.4 years old. The median income for a household was about $65,419. This means half of the households earned more than this amount, and half earned less. About 7.2% of all people in the county lived below the poverty line.
Towns and Cities in New London County

New London County has two main cities and many towns. Some towns also have smaller villages or boroughs within them. These smaller places are part of the larger town and don't have their own separate governments.
Cities
Towns
Images for kids
-
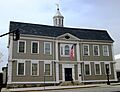
Former New London County Courthouse
See also
 In Spanish: Condado de New London para niños
