
2000 United States census facts for kids
Quick facts for kids Twenty-second census of the United States |
|
|---|---|

U.S. Census Bureau seal
|
|

2000 U.S. census logo
|
|
| General information | |
| Country | United States |
| Date taken | April 1, 2000 |
| Total population | 281,421,906 |
| Percent change | |
| Most populous state | California (33,871,648) |
| Least populous state | Wyoming (493,782) |
The 2000 United States census was a big count of all the people living in the United States. The Census Bureau did this count on April 1, 2000. They found that 281,421,906 people lived in the U.S. This was a 13.2% increase from the 1990 census, which counted 248,709,873 people. This census was the 22nd time the U.S. government had done such a count. At the time, it was the biggest peaceful project ever done by the government.
About 16% of homes received a "long form" for the 2000 census. This form had more than 100 questions. You can find all the details about the 2000 census, including the forms, from the Integrated Public Use Microdata Series.
This was the first time a state, California, had more than 30 million people. It was also the first time two states, California and Texas, had more than 20 million people.
Contents
Understanding Census Data
The census collects important information about people and homes. This data helps the government make decisions.
How Census Data Is Used
Information from the 2000 census is available for everyone to use. You can find detailed data about individuals (called microdata) through the Integrated Public Use Microdata Series. There is also information for smaller areas (called aggregate data) that you can download from the National Historical Geographic Information System. This data helps researchers and planners understand population changes.
When Personal Information Becomes Public
The personal details from the 2000 census will be kept private for a long time. They will only become available to the public in the year 2072. This rule helps protect people's privacy.
Population by State
The census shows how many people live in each state. It also shows how much the population changed since the last census.

| Rank | State | Population in 2000 | Population in 1990 | Change | Percent change |
|---|---|---|---|---|---|
| 1 | 33,871,648 | 29,760,021 | |||
| 2 | 20,851,820 | 16,986,510 | |||
| 3 | 18,976,457 | 17,990,455 | |||
| 4 | 15,982,378 | 12,937,926 | |||
| 5 | 12,419,293 | 11,430,602 | |||
| 6 | 12,281,054 | 11,881,643 | |||
| 7 | 11,353,140 | 10,847,115 | |||
| 8 | 9,938,444 | 9,295,297 | |||
| 9 | 8,414,350 | 7,730,188 | |||
| 10 | 8,186,453 | 6,478,216 | |||
| 11 | 8,049,313 | 6,628,637 | |||
| 12 | 7,078,515 | 6,187,358 | |||
| 13 | 6,349,097 | 6,016,425 | |||
| 14 | 6,080,485 | 5,544,159 | |||
| 15 | 5,894,121 | 4,866,692 | |||
| 16 | 5,689,283 | 4,877,185 | |||
| 17 | 5,595,211 | 5,117,073 | |||
| 18 | 5,363,675 | 4,891,769 | |||
| 19 | 5,296,486 | 4,781,468 | |||
| 20 | 5,130,632 | 3,665,228 | |||
| 21 | 4,919,479 | 4,375,099 | |||
| 22 | 4,468,976 | 4,219,973 | |||
| 23 | 4,447,100 | 4,040,587 | |||
| 24 | 4,301,261 | 3,294,394 | |||
| 25 | 4,041,769 | 3,685,296 | |||
| 26 | 4,012,012 | 3,486,703 | |||
| 27 | 3,450,654 | 3,145,585 | |||
| 28 | 3,421,399 | 2,842,321 | |||
| 29 | 3,405,565 | 3,287,116 | |||
| 30 | 2,926,324 | 2,776,755 | |||
| 31 | 2,844,658 | 2,573,216 | |||
| 32 | 2,688,418 | 2,477,574 | |||
| 33 | 2,673,400 | 2,350,725 | |||
| 34 | 2,233,169 | 1,722,850 | |||
| 35 | 1,998,257 | 1,201,833 | |||
| 36 | 1,819,046 | 1,515,069 | |||
| 37 | 1,808,344 | 1,793,477 | |||
| 38 | 1,711,263 | 1,578,385 | |||
| 39 | 1,293,953 | 1,006,749 | |||
| 40 | 1,274,923 | 1,227,928 | |||
| 41 | 1,235,786 | 1,109,252 | |||
| 42 | 1,211,537 | 1,108,229 | |||
| 43 | 1,048,319 | 1,003,464 | |||
| 44 | 902,195 | 799,065 | |||
| 45 | 783,600 | 666,168 | |||
| 46 | 754,844 | 696,004 | |||
| 47 | 642,200 | 638,800 | |||
| 48 | 626,932 | 550,043 | |||
| 49 | 608,827 | 562,758 | |||
| – | 572,059 | 606,900 | |||
| 50 | 493,782 | 453,588 | |||
| 281,421,906 | 248,709,873 | 32,712,033 | 13.2% |
Top Cities by Population
The census also counted people in cities across the U.S. Here are the 100 largest cities in the year 2000.
| Rank | City | State | Population | Region |
|---|---|---|---|---|
| 1 | New York | NY | 8,008,278 | Northeast |
| 2 | Los Angeles | CA | 3,694,820 | West |
| 3 | Chicago | IL | 2,896,016 | Midwest |
| 4 | Houston | TX | 1,953,631 | South |
| 5 | Philadelphia | PA | 1,517,550 | Northeast |
| 6 | Phoenix | AZ | 1,321,045 | West |
| 7 | San Diego | CA | 1,223,400 | West |
| 8 | Dallas | TX | 1,188,580 | South |
| 9 | San Antonio | TX | 1,144,646 | South |
| 10 | Detroit | MI | 951,270 | Midwest |
| 11 | San Jose | CA | 894,943 | West |
| 12 | Indianapolis | IN | 791,926 | Midwest |
| 13 | San Francisco | CA | 776,733 | West |
| 14 | Jacksonville | FL | 735,617 | South |
| 15 | Columbus | OH | 711,470 | Midwest |
| 16 | Austin | TX | 656,562 | South |
| 17 | Baltimore | MD | 651,154 | South |
| 18 | Memphis | TN | 650,100 | South |
| 19 | Milwaukee | WI | 596,974 | Midwest |
| 20 | Boston | MA | 589,141 | Northeast |
| 21 | Washington | DC | 572,059 | South |
| 22 | Nashville-Davidson | TN | 569,891 | South |
| 23 | El Paso | TX | 563,662 | South |
| 24 | Seattle | WA | 563,374 | West |
| 25 | Denver | CO | 554,636 | West |
| 26 | Charlotte | NC | 540,828 | South |
| 27 | Fort Worth | TX | 534,694 | South |
| 28 | Portland | OR | 529,121 | West |
| 29 | Oklahoma City | OK | 506,132 | South |
| 30 | Tucson | AZ | 486,699 | West |
| 31 | New Orleans | LA | 484,674 | South |
| 32 | Las Vegas | NV | 478,434 | West |
| 33 | Cleveland | OH | 478,403 | Midwest |
| 34 | Long Beach | CA | 461,522 | West |
| 35 | Albuquerque | NM | 448,607 | West |
| 36 | Kansas City | MO | 441,545 | Midwest |
| 37 | Fresno | CA | 427,652 | West |
| 38 | Virginia Beach | VA | 425,257 | South |
| 39 | San Juan | PR | 421,958 | |
| 40 | Atlanta | GA | 416,474 | South |
| 41 | Sacramento | CA | 407,018 | West |
| 42 | Oakland | CA | 399,484 | West |
| 43 | Mesa | AZ | 396,375 | West |
| 44 | Tulsa | OK | 393,049 | South |
| 45 | Omaha | NE | 390,007 | Midwest |
| 46 | Minneapolis | MN | 382,618 | Midwest |
| 47 | Honolulu | HI | 371,657 | West |
| 48 | Miami | FL | 362,470 | South |
| 49 | Colorado Springs | CO | 360,890 | West |
| 50 | St. Louis | MO | 348,189 | Midwest |
| 51 | Wichita | KS | 344,284 | Midwest |
| 52 | Santa Ana | CA | 337,977 | West |
| 53 | Pittsburgh | PA | 334,563 | Northeast |
| 54 | Arlington | TX | 332,969 | South |
| 55 | Cincinnati | OH | 331,285 | Midwest |
| 56 | Anaheim | CA | 328,014 | West |
| 57 | Toledo | OH | 313,619 | Midwest |
| 58 | Tampa | FL | 303,447 | South |
| 59 | Buffalo | NY | 292,648 | Northeast |
| 60 | St. Paul | MN | 287,151 | Midwest |
| 61 | Corpus Christi | TX | 277,454 | South |
| 62 | Aurora | CO | 276,393 | West |
| 63 | Raleigh | NC | 276,093 | South |
| 64 | Newark | NJ | 273,546 | Northeast |
| 65 | Lexington-Fayette | KY | 260,512 | South |
| 66 | Anchorage | AK | 260,283 | West |
| 67 | Louisville | KY | 256,231 | South |
| 68 | Riverside | CA | 255,166 | West |
| 69 | St. Petersburg | FL | 248,232 | South |
| 70 | Bakersfield | CA | 247,057 | West |
| 71 | Stockton | CA | 243,771 | West |
| 72 | Birmingham | AL | 242,820 | South |
| 73 | Jersey City | NJ | 240,055 | Northeast |
| 74 | Norfolk | VA | 234,403 | South |
| 75 | Baton Rouge | LA | 227,818 | South |
| 76 | Hialeah | FL | 226,419 | South |
| 77 | Lincoln | NE | 225,581 | Midwest |
| 78 | Greensboro | NC | 223,891 | South |
| 79 | Plano | TX | 222,030 | South |
| 80 | Rochester | NY | 219,773 | Northeast |
| 81 | Glendale | AZ | 218,812 | West |
| 82 | Akron | OH | 217,074 | Midwest |
| 83 | Garland | TX | 215,768 | South |
| 84 | Madison | WI | 208,054 | Midwest |
| 85 | Fort Wayne | IN | 205,727 | Midwest |
| 86 | Bayamon | PR | 203,499 | |
| 87 | Fremont | CA | 203,413 | West |
| 88 | Scottsdale | AZ | 202,705 | West |
| 89 | Montgomery | AL | 201,568 | South |
| 90 | Shreveport | LA | 200,145 | South |
| 91 | Augusta-Richmond County | GA | 199,775 | South |
| 92 | Lubbock | TX | 199,564 | South |
| 93 | Chesapeake | VA | 199,184 | South |
| 94 | Mobile | AL | 198,915 | South |
| 95 | Des Moines | IA | 198,682 | Midwest |
| 96 | Grand Rapids | MI | 197,800 | Midwest |
| 97 | Richmond | VA | 197,790 | South |
| 98 | Yonkers | NY | 196,086 | Northeast |
| 99 | Spokane | WA | 195,629 | West |
| 100 | Glendale | CA | 194,973 | West |
Understanding the U.S. Population
The 2000 census collected many interesting facts about the people living in the U.S. This information helps us understand who makes up the country.
Key Facts About Americans
The U.S. population includes everyone in the 50 states and District of Columbia. The census also counted people in the U.S. territory of Puerto Rico, which had 3,808,610 residents. This was an 8.1% increase for Puerto Rico since 1990.
Here are some interesting facts from the 2000 census:
- About 75% of people said they were White or Caucasian and no other race.
- Hispanic people made up 12.5% of the U.S. population. This was up from 9% in 1990.
- About 12.4% of Americans (34.5 million people) said they had German family roots.
- About 12.3% of people were Black or African American.
- About 3.6% of people were Asian.
- For the first time, people could choose more than one race. About 2.4% of people (6.8 million Americans) said they were multiracial (2 or more races).
- The number of people aged 45 to 54 grew by 49% between 1990 and 2000. Those aged 85 and older grew by 38%.
- Among people aged 85 and older, there were twice as many women as men.
- In 1997, almost one in five adults had some type of disability. The chance of having a disability increased with age.
- Most American homes were still families, but fewer than 30 years before.
- Since 1993, the average income for both families and non-families went up. Homes led by a woman without a spouse saw the fastest income growth.
- People in married-couple families had the lowest rates of poverty.
- People who were poor were more likely to not have health insurance.
- The number of elementary and high school students in 2000 was almost as high as the record of 49 million in 1970.
- People from all racial and ethnic groups showed improvements in getting an education.
- Most U.S. homes (51%) had computers. About 42% had Internet access.
Where People Moved: Population Shifts
The census showed that many people moved to the South and West of the U.S. These regions saw the biggest increases in population.


Population Growth by Region
The South gained about 14.8 million people. The West gained about 10.4 million people. This means that the "center" of the U.S. population moved to Phelps County, Missouri. The Northeastern United States grew by about 2.8 million people. The Midwest grew by about 4.7 million people.
How the Census Affects Government
The results of the census are very important for how the U.S. government works.

Changing Congressional Seats
The census helps decide how many congressional districts each state gets. This is called apportionment. The U.S. Congress sets the rules for this. There are 435 seats in the United States House of Representatives. Each seat represents a certain number of people.
The population used for this count includes people living in the 50 states. It also includes military members and federal workers living overseas with their families, if they can be linked to a state. People in Washington, D.C. and Puerto Rico are not included in this count. This is because they do not have voting representatives in the U.S. House of Representatives.
History of Representation
The census has been used to decide representation since the first count in 1790. The U.S. Constitution says there should not be more than one representative for every 30,000 people. It also says each state must have at least one representative. In 1790, each representative stood for about 34,000 people. The number of representatives grew a lot over time. In 1911, it was set at 435. Today, each representative stands for about 20 times more people than in 1790.
Images for kids
-
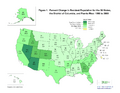
Population change by percentage in 2000.
-
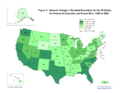
Numeric population change in 2000.
-
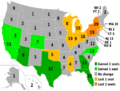
How congressional seats were reapportioned after the 2000 census.
See also
 In Spanish: Censo de los Estados Unidos de 2000 para niños
