
Baffin Island facts for kids
|
Native name:
ᕿᑭᖅᑖᓗᒃ (Qikiqtaaluk)
|
|
|---|---|
 |
|
 |
|

Baffin Island
Location in Nunavut

Baffin Island
Location in Canada
|
|
| Geography | |
| Location | Northern Canada |
| Coordinates | 68°N 70°W / 68°N 70°W |
| Archipelago | Arctic Archipelago |
| Area | 507,451 km2 (195,928 sq mi) |
| Area rank | 5th |
| Highest elevation | 2,147 m (7,044 ft) |
| Highest point | Mount Odin |
| Administration | |
|
Canada
|
|
| Territory | Nunavut |
| Largest settlement | Iqaluit (pop. 7,429) |
| Demographics | |
| Population | 13,039 |
| Pop. density | 0.03 /km2 (0.08 /sq mi) |
| Ethnic groups | Inuit (72.7%), non-Aboriginal (25.3%), First Nations (0.7%), Métis (0.5%) |
Baffin Island is a huge island in Canada's Nunavut territory. It's the largest island in Canada and the fifth largest in the world! Imagine an island almost as big as Thailand. About 13,000 people live here. Many live in Iqaluit, the capital city of Nunavut. Baffin Island is located in the northern part of Canada.
Contents
Island Names and Their Meanings
The local people, the Inuit, call the island Qikiqtaaluk. This name means "very big island" in their language, Inuktitut. It's a perfect name because the island is truly enormous!
Long ago, some Norse people (Vikings) might have called it Helluland. This means "stone land." This name describes the rocky parts of the island.
Later, in 1576, an English explorer named Martin Frobisher landed here. He named a part of it "Queen Elizabeth's Foreland." The island we know today is named after another English explorer, William Baffin. He explored the area in 1616 while searching for a sea route called the Northwest Passage.
How did it form?
Long, long ago (we’re talking billions of years!), Earth’s land was moving and shifting. Baffin Island began forming when giant pieces of Earth’s crust (called tectonic plates) smashed together. This collision pushed up mountains and created the foundation of the island.
Thousands of years ago, during the Ice Age, massive sheets of ice (glaciers) covered Baffin Island. These glaciers were like giant bulldozers—they scraped and carved the land, creating deep valleys, fjords (steep-walled inlets), and rugged mountains. When the ice melted, it left behind the stunning landscapes we see today!
Exploring Baffin Island's Landscape
Baffin Island has a varied and beautiful landscape. Iqaluit, the capital city of Nunavut, is found on the southeastern coast. This city was once called Frobisher Bay. But in 1987, people voted to bring back its original Inuktitut name.
The island is surrounded by different bodies of water. To the south, the Hudson Strait separates it from mainland Quebec. To the east, you'll find Davis Strait and Baffin Bay, with Greenland just beyond. To the west and north, other waters like the Foxe Basin separate Baffin Island from the rest of the Arctic Archipelago.
Mountains and Lakes
The Baffin Mountains stretch along the northeastern coast. These mountains are part of a larger chain called the Arctic Cordillera. The tallest mountain on the island is Mount Odin, standing over 2,140 meters (about 7,000 feet) high.
Another famous peak is Mount Thor. It is known for having one of the world's greatest vertical drops. Imagine a sheer cliff face that plunges 1,250 meters (over 4,000 feet)! It's an amazing sight.
Baffin Island also has two very large lakes in its southern-central part. These are Nettilling Lake and Amadjuak Lake. They are huge freshwater bodies, adding to the island's natural beauty.
A Look at Baffin Island's Past
Baffin Island has a long and rich history. People have lived there for over 3,000 years! The first known groups were the pre-Dorset people. They were followed by the Dorset people. Later, the Thule people arrived. They are the ancestors of today's Inuit. The Inuit have called Baffin Island home for the last thousand years.
Early European Visitors
Around the year 986, a Norse explorer named Bjarni Herjólfsson might have been the first European to see Baffin Island. He was sailing from Iceland to Greenland. Strong winds blew his ship off course. About 15 years later, another Norse explorer, Leif Erikson, explored the area. Many believe Baffin Island is the "Helluland" (stone land) mentioned in old Norse stories.
Archaeologists have found interesting clues about early visitors. At a place called Tanfield Valley, they discovered items like yarn and tools. Some findings suggest Europeans might have visited Baffin Island even before the Vikings were known to be in Greenland. Scientists are still studying these discoveries. It's a fascinating puzzle from the past!
How Baffin Island is Governed
Baffin Island is part of a larger area called the Qikiqtaaluk Region. This region helps manage the communities and services on the island.
People and Communities of Baffin Island
About 13,000 people live on Baffin Island. Most of the people living here are Indigenous, especially the Inuit. The Inuit make up a large part of the island's population.
The largest community is Iqaluit, which is also the capital of Nunavut. Other communities on the island include Arctic Bay, Clyde River, Kimmirut, Pangnirtung, and Pond Inlet. Each of these places has its own unique character and history.
| City or hamlet | 2021 Population |
|---|---|
| Arctic Bay | 944 |
| Clyde River | 1,181 |
| Iqaluit | 7,429 |
| Kimmirut | 426 |
| Nanisivik | 0 |
| Pangnirtung | 1,504 |
| Pond Inlet | 1,555 |
Some nearby communities like Kinngait and Qikiqtarjuaq are close to Baffin Island. But they are actually on smaller islands of their own.
Amazing Wildlife of Baffin Island
Baffin Island is a special place for many animals. It has two important protected areas. These are the Dewey Soper Migratory Bird Sanctuary and the Bowman Bay Wildlife Sanctuary. These places help protect the island's unique creatures.
Land Animals
Many animals live on Baffin Island all year round. These include the barren-ground caribou, polar bear, Arctic fox, red fox, Arctic hare, lemming, and the Baffin Island wolf.
- Caribou: These deer-like animals travel across the island. They move south in winter and return north in summer. Sadly, their numbers have dropped a lot since the 1990s.
- Arctic Hares: These hares are found everywhere on the island. Their fur turns pure white in winter to blend with the snow. In summer, it becomes a scruffy dark grey.
- Lemmings: These small rodents are a key food source for foxes, wolves, and snowy owls. In the winter, they dig tunnels under the snow to find food.
Predators of the Arctic
- Polar Bears: These powerful hunters live along the coast. They are most common where there is sea ice. This is where their main food, ringed seals, live. Female polar bears dig dens in snow banks to give birth to their cubs.
- Arctic and Red Foxes: Arctic foxes often follow polar bears to eat their leftovers. They also hunt ground-nesting birds and their eggs. Red foxes prefer the warmer southern parts of the island.
- Arctic Wolves: These wolves are also year-round residents. Unlike wolves in warmer places, Arctic wolves often hunt in smaller groups. Sometimes, just a pair hunts together.
Birds of Baffin Island
Many birds come to Baffin Island in the summer to nest. It's a major stop for migrating birds. You can see different types of waterfowl like eiders and Canada geese. Shorebirds like sandpipers and plovers also nest here.
One amazing bird is the Arctic tern. It flies all the way from Antarctica to Baffin Island every spring!
Marine Mammals in the Waters
The waters around Baffin Island are home to many marine mammals.
- Ringed Seals: These seals live near the coast all year. In winter, they make breathing holes in the thick ice. Females create small snow dens to have their pups.
- Harp Seals: These seals migrate to Baffin Island for the summer. They travel in large groups, diving and surfacing together. They feed on small sea creatures.
- Walruses: Walruses stay near the coast. They follow the edge of the ice in winter. In summer, they can be seen resting on rocks close to shore.
- Beluga Whales: These white whales travel along the coast. They often swim very close to shore. They come up to breathe often as they eat crustaceans.
- Narwhals: Known for the male's long, spiraling tusk, narwhals also visit Baffin Island's coast in the summer. They can be found in pairs or larger groups.
- Bowhead Whales: The largest summer visitor to Baffin Island is the bowhead whale. One group of these huge whales migrates to the Foxe Basin.
Baffin Island's Climate
Baffin Island has a very cold climate. This is because cold air flows over it all year. Winters are very long and cold. Summers can be foggy and cloudy.
Seasons and Sunlight
Spring arrives late on Baffin Island. In the south, snow starts to melt around early June. But on the northern coast, it might not melt until mid-July. Snow can fall at any time of year, even in summer!
Most of Baffin Island is north of the Arctic Circle. This means that in winter, some communities experience polar night. The sun doesn't rise for weeks. In summer, they have the midnight sun. The sun stays out all day and night!
The island has a tundra climate. This means it's too cold for trees to grow. The sea around the island is frozen for most of the year. Only for a few months does the temperature rise above freezing.
The Barnes Ice Cap, a large ice sheet in the middle of the island, has been shrinking since the 1960s. This shows how the climate is changing over time.
| Climate data for Iqaluit (Iqaluit Airport) WMO ID: 71909; coordinates 63°45′N 68°33′W / 63.750°N 68.550°W; elevation: 33.5 m (110 ft); 1991–2020 normals, extremes 1946–present |
|||||||||||||
|---|---|---|---|---|---|---|---|---|---|---|---|---|---|
| Month | Jan | Feb | Mar | Apr | May | Jun | Jul | Aug | Sep | Oct | Nov | Dec | Year |
| Record high humidex | 3.3 | 5.2 | 4.3 | 6.8 | 13.3 | 21.7 | 27.8 | 27.6 | 18.8 | 8.6 | 4.8 | 3.4 | 27.8 |
| Record high °C (°F) | 3.9 (39.0) |
5.7 (42.3) |
4.2 (39.6) |
7.2 (45.0) |
13.3 (55.9) |
22.7 (72.9) |
26.8 (80.2) |
25.5 (77.9) |
18.4 (65.1) |
9.1 (48.4) |
5.6 (42.1) |
3.8 (38.8) |
26.8 (80.2) |
| Mean daily maximum °C (°F) | −22.0 (−7.6) |
−22.9 (−9.2) |
−17.6 (0.3) |
−8.9 (16.0) |
−0.3 (31.5) |
7.0 (44.6) |
12.0 (53.6) |
11.1 (52.0) |
5.6 (42.1) |
−0.5 (31.1) |
−7.5 (18.5) |
−14.7 (5.5) |
−4.9 (23.2) |
| Daily mean °C (°F) | −26.0 (−14.8) |
−27.0 (−16.6) |
−22.4 (−8.3) |
−13.5 (7.7) |
−3.2 (26.2) |
3.9 (39.0) |
8.1 (46.6) |
7.5 (45.5) |
2.9 (37.2) |
−3.2 (26.2) |
−11.1 (12.0) |
−18.9 (−2.0) |
−8.6 (16.5) |
| Mean daily minimum °C (°F) | −29.9 (−21.8) |
−31.0 (−23.8) |
−27.2 (−17.0) |
−18.1 (−0.6) |
−6.1 (21.0) |
0.7 (33.3) |
4.2 (39.6) |
3.8 (38.8) |
0.2 (32.4) |
−5.8 (21.6) |
−14.7 (5.5) |
−23.0 (−9.4) |
−12.2 (10.0) |
| Record low °C (°F) | −45.0 (−49.0) |
−45.6 (−50.1) |
−44.7 (−48.5) |
−34.2 (−29.6) |
−26.1 (−15.0) |
−10.2 (13.6) |
−2.8 (27.0) |
−2.5 (27.5) |
−12.8 (9.0) |
−27.1 (−16.8) |
−36.2 (−33.2) |
−43.4 (−46.1) |
−45.6 (−50.1) |
| Record low wind chill | −65.4 | −65.6 | −62.1 | −53.1 | −36.0 | −18.8 | −7.2 | −8.6 | −18.6 | −42.9 | −56.8 | −60.1 | −65.6 |
| Average precipitation mm (inches) | 16.3 (0.64) |
14.0 (0.55) |
21.4 (0.84) |
22.7 (0.89) |
21.0 (0.83) |
48.7 (1.92) |
39.8 (1.57) |
61.7 (2.43) |
50.8 (2.00) |
30.2 (1.19) |
18.5 (0.73) |
16.2 (0.64) |
361.2 (14.22) |
| Average rainfall mm (inches) | 0.4 (0.02) |
0.1 (0.00) |
0.0 (0.0) |
0.0 (0.0) |
3.3 (0.13) |
46.1 (1.81) |
44.4 (1.75) |
65.5 (2.58) |
43.9 (1.73) |
12.3 (0.48) |
0.7 (0.03) |
0.0 (0.0) |
216.6 (8.53) |
| Average snowfall cm (inches) | 19.4 (7.6) |
15.1 (5.9) |
20.6 (8.1) |
23.8 (9.4) |
23.0 (9.1) |
3.8 (1.5) |
0.0 (0.0) |
0.1 (0.0) |
8.5 (3.3) |
21.1 (8.3) |
25.9 (10.2) |
28.8 (11.3) |
190.0 (74.8) |
| Average precipitation days (≥ 0.2 mm) | 12.1 | 10.7 | 12.4 | 12.8 | 10.6 | 12.3 | 12.4 | 14.3 | 15.7 | 13.2 | 12.5 | 12.8 | 151.5 |
| Average rainy days (≥ 0.2 mm) | 0.06 | 0.06 | 0.06 | 0.06 | 1.7 | 10.7 | 13.1 | 14.8 | 13.2 | 3.8 | 0.24 | 0.0 | 57.7 |
| Average snowy days (≥ 0.2 cm) | 10.1 | 8.8 | 8.7 | 9.6 | 8.7 | 2.1 | 0.06 | 0.12 | 3.7 | 9.8 | 11.9 | 12.7 | 86.3 |
| Average relative humidity (%) (at 3pm) | 68.1 | 67.6 | 68.9 | 74.6 | 77.3 | 74.6 | 72.9 | 73.5 | 75.2 | 78.7 | 78.4 | 74.3 | 73.7 |
| Mean monthly sunshine hours | 32.4 | 94.0 | 172.2 | 216.5 | 180.5 | 200.2 | 236.8 | 156.8 | 87.9 | 51.4 | 35.6 | 12.6 | 1,476.8 |
| Percent possible sunshine | 18.5 | 39.0 | 47.4 | 48.2 | 31.9 | 32.5 | 39.3 | 31.0 | 22.4 | 16.8 | 17.7 | 8.9 | 29.5 |
| Average ultraviolet index | 0 | 0 | 1 | 2 | 4 | 4 | 4 | 3 | 2 | 1 | 0 | 0 | 2 |
| Source 1: Environment and Climate Change Canada (Bright Sunshine 1981–2010) | |||||||||||||
| Source 2: Weather Atlas | |||||||||||||
| Climate data for Clyde River (Clyde River Airport) WMO ID: 71090; coordinates 70°29′10″N 68°31′00″W / 70.48611°N 68.51667°W; elevation: 26.5 m (87 ft); 1991–2020 normals, extremes 1933–present |
|||||||||||||
|---|---|---|---|---|---|---|---|---|---|---|---|---|---|
| Month | Jan | Feb | Mar | Apr | May | Jun | Jul | Aug | Sep | Oct | Nov | Dec | Year |
| Record high humidex | 2.2 | 1.7 | 0.1 | 7.2 | 8.5 | 16.1 | 23.6 | 20.7 | 14.4 | 8.1 | 1.7 | 1.7 | 23.6 |
| Record high °C (°F) | 3.3 (37.9) |
3.3 (37.9) |
0.2 (32.4) |
11.7 (53.1) |
8.9 (48.0) |
17.8 (64.0) |
22.2 (72.0) |
20.6 (69.1) |
14.6 (58.3) |
11.4 (52.5) |
6.7 (44.1) |
2.8 (37.0) |
22.2 (72.0) |
| Mean daily maximum °C (°F) | −24.2 (−11.6) |
−25.1 (−13.2) |
−22.0 (−7.6) |
−13.4 (7.9) |
−3.7 (25.3) |
3.8 (38.8) |
9.2 (48.6) |
8.2 (46.8) |
3.3 (37.9) |
−2.9 (26.8) |
−12.3 (9.9) |
−19.0 (−2.2) |
−8.2 (17.2) |
| Daily mean °C (°F) | −28.0 (−18.4) |
−29.0 (−20.2) |
−26.6 (−15.9) |
−18.2 (−0.8) |
−7.6 (18.3) |
1.0 (33.8) |
5.3 (41.5) |
5.0 (41.0) |
0.7 (33.3) |
−6.3 (20.7) |
−16.0 (3.2) |
−23.0 (−9.4) |
−11.9 (10.6) |
| Mean daily minimum °C (°F) | −31.8 (−25.2) |
−32.8 (−27.0) |
−31.2 (−24.2) |
−23.0 (−9.4) |
−11.3 (11.7) |
−1.6 (29.1) |
1.6 (34.9) |
1.9 (35.4) |
−1.6 (29.1) |
−9.3 (15.3) |
−19.6 (−3.3) |
−26.8 (−16.2) |
−15.5 (4.1) |
| Record low °C (°F) | −50.2 (−58.4) |
−50.1 (−58.2) |
−47.8 (−54.0) |
−41.1 (−42.0) |
−31.1 (−24.0) |
−17.2 (1.0) |
−6.8 (19.8) |
−5.6 (21.9) |
−16.1 (3.0) |
−28.7 (−19.7) |
−39.5 (−39.1) |
−45.0 (−49.0) |
−50.2 (−58.4) |
| Record low wind chill | −59.5 | −62.4 | −58.1 | −48.9 | −34.4 | −20.0 | −10.5 | −9.5 | −21.2 | −36.4 | −46.7 | −55.3 | −62.4 |
| Average precipitation mm (inches) | 10.4 (0.41) |
8.1 (0.32) |
11.9 (0.47) |
10.9 (0.43) |
15.0 (0.59) |
20.3 (0.80) |
25.0 (0.98) |
28.7 (1.13) |
37.9 (1.49) |
30.0 (1.18) |
18.4 (0.72) |
15.4 (0.61) |
231.9 (9.13) |
| Average rainfall mm (inches) | 0.0 (0.0) |
0.0 (0.0) |
0.0 (0.0) |
0.0 (0.0) |
0.5 (0.02) |
5.6 (0.22) |
14.5 (0.57) |
32.2 (1.27) |
10.2 (0.40) |
0.3 (0.01) |
0.0 (0.0) |
0.0 (0.0) |
63.3 (2.49) |
| Average snowfall cm (inches) | 10.6 (4.2) |
8.7 (3.4) |
8.4 (3.3) |
12.7 (5.0) |
16.5 (6.5) |
12.5 (4.9) |
6.6 (2.6) |
5.2 (2.0) |
27.7 (10.9) |
40.4 (15.9) |
28.2 (11.1) |
17.2 (6.8) |
194.7 (76.7) |
| Average precipitation days (≥ 0.2 mm) | 8.0 | 7.1 | 7.5 | 8.8 | 10.3 | 8.3 | 9.6 | 10.8 | 15.0 | 16.0 | 11.1 | 9.9 | 122.3 |
| Average rainy days (≥ 0.2 mm) | 0.0 | 0.0 | 0.0 | 0.0 | 0.3 | 1.6 | 6.6 | 9.1 | 3.8 | 0.3 | 0.1 | 0.0 | 21.8 |
| Average snowy days (≥ 0.2 cm) | 7.3 | 6.6 | 6.8 | 8.7 | 10.5 | 5.6 | 2.4 | 3.3 | 12.0 | 17.0 | 11.8 | 8.4 | 100.3 |
| Average relative humidity (%) (at 1500 LST) | 68.3 | 66.7 | 67.6 | 74.4 | 83.0 | 84.5 | 79.3 | 80.4 | 81.0 | 82.8 | 78.5 | 71.7 | 76.5 |
| Mean monthly sunshine hours | 0.0 | 56.1 | 175.6 | 253.3 | 264.1 | 273.4 | 279.0 | 161.6 | 83.9 | 45.5 | 0.0 | 0.0 | 1,592.5 |
| Percent possible sunshine | 0.0 | 28.6 | 48.8 | 51.8 | 37.9 | 38.0 | 37.6 | 28.0 | 20.7 | 16.4 | 0.0 | 0.0 | 34.2 |
| Source: Environment and Climate Change Canada (rain/rain days, snow/snow days, sun 1981–2010) | |||||||||||||
| Climate data for Pond Inlet (Pond Inlet Airport) WMO ID: 71095; coordinates 72°41′22″N 77°58′08″W / 72.68944°N 77.96889°W; elevation: 61.6 m (202 ft); 1981–2010 normals |
|||||||||||||
|---|---|---|---|---|---|---|---|---|---|---|---|---|---|
| Month | Jan | Feb | Mar | Apr | May | Jun | Jul | Aug | Sep | Oct | Nov | Dec | Year |
| Record high humidex | 3.6 | −4.0 | −0.8 | 3.9 | 9.4 | 15.0 | 22.0 | 18.9 | 11.8 | 6.0 | 1.2 | −0.5 | 22.0 |
| Record high °C (°F) | 3.7 (38.7) |
−3.3 (26.1) |
0.0 (32.0) |
3.9 (39.0) |
12.1 (53.8) |
15.5 (59.9) |
22.0 (71.6) |
19.0 (66.2) |
11.9 (53.4) |
6.5 (43.7) |
2.0 (35.6) |
−1.0 (30.2) |
22.0 (71.6) |
| Mean daily maximum °C (°F) | −30.0 (−22.0) |
−30.2 (−22.4) |
−26.2 (−15.2) |
−17.6 (0.3) |
−5.3 (22.5) |
5.2 (41.4) |
10.5 (50.9) |
7.8 (46.0) |
1.8 (35.2) |
−6.4 (20.5) |
−17.8 (0.0) |
−24.5 (−12.1) |
−11.1 (12.0) |
| Daily mean °C (°F) | −33.4 (−28.1) |
−33.7 (−28.7) |
−30.0 (−22.0) |
−21.9 (−7.4) |
−9.3 (15.3) |
2.4 (36.3) |
6.6 (43.9) |
4.8 (40.6) |
−0.8 (30.6) |
−9.7 (14.5) |
−21.7 (−7.1) |
−28.2 (−18.8) |
−14.6 (5.7) |
| Mean daily minimum °C (°F) | −36.7 (−34.1) |
−37.1 (−34.8) |
−33.6 (−28.5) |
−26.1 (−15.0) |
−13.2 (8.2) |
−0.6 (30.9) |
2.7 (36.9) |
1.7 (35.1) |
−3.4 (25.9) |
−12.9 (8.8) |
−25.2 (−13.4) |
−31.8 (−25.2) |
−18.0 (−0.4) |
| Record low °C (°F) | −49.8 (−57.6) |
−53.9 (−65.0) |
−49.0 (−56.2) |
−40.2 (−40.4) |
−28.4 (−19.1) |
−14.0 (6.8) |
−6.1 (21.0) |
−6.1 (21.0) |
−16.4 (2.5) |
−30.1 (−22.2) |
−42.0 (−43.6) |
−45.5 (−49.9) |
−53.9 (−65.0) |
| Record low wind chill | −64.8 | −68.5 | −60.3 | −51.4 | −36.2 | −20.7 | −6.7 | −17.8 | −25.0 | −42.0 | −51.6 | −58.6 | −68.5 |
| Average precipitation mm (inches) | 4.8 (0.19) |
3.8 (0.15) |
6.6 (0.26) |
10.5 (0.41) |
9.4 (0.37) |
15.6 (0.61) |
32.0 (1.26) |
38.8 (1.53) |
19.9 (0.78) |
25.1 (0.99) |
13.7 (0.54) |
8.9 (0.35) |
189.0 (7.44) |
| Average rainfall mm (inches) | 0.0 (0.0) |
0.0 (0.0) |
0.0 (0.0) |
0.0 (0.0) |
0.0 (0.0) |
12.1 (0.48) |
31.5 (1.24) |
35.9 (1.41) |
9.8 (0.39) |
1.3 (0.05) |
0.4 (0.02) |
0.0 (0.0) |
91.0 (3.58) |
| Average snowfall cm (inches) | 5.8 (2.3) |
5.0 (2.0) |
8.6 (3.4) |
12.7 (5.0) |
14.3 (5.6) |
4.4 (1.7) |
0.4 (0.2) |
2.8 (1.1) |
13.7 (5.4) |
33.8 (13.3) |
17.9 (7.0) |
12.6 (5.0) |
131.9 (51.9) |
| Average precipitation days (≥ 0.2 mm) | 4.6 | 4.1 | 6.5 | 6.2 | 6.2 | 5.9 | 8.0 | 9.9 | 7.9 | 11.7 | 8.2 | 7.4 | 86.7 |
| Average rainy days (≥ 0.2 mm) | 0.0 | 0.0 | 0.0 | 0.0 | 0.0 | 4.4 | 7.9 | 9.2 | 2.8 | 0.2 | 0.0 | 0.0 | 24.5 |
| Average snowy days (≥ 0.2 cm) | 4.6 | 4.2 | 6.6 | 6.1 | 6.2 | 2.1 | 0.2 | 1.0 | 5.3 | 11.5 | 8.2 | 7.4 | 63.3 |
| Average relative humidity (%) | 65.3 | 65.3 | 65.0 | 70.4 | 78.1 | 75.8 | 71.6 | 75.1 | 77.0 | 80.3 | 72.5 | 67.6 | 72.0 |
| Mean monthly sunshine hours | 0.0 | 0.0 | 177.0 | 301.7 | 353.7 | 330.4 | 359.6 | 192.1 | 90.2 | 39.3 | 0.0 | 0.0 | 1,844 |
| Percent possible sunshine | 0.0 | 0.0 | 49.5 | 59.0 | 48.4 | 45.9 | 48.3 | 30.7 | 21.9 | 15.0 | 0.0 | 0.0 | 39.8 |
| Source: Environment and Climate Change Canada Canadian Climate Normals 1981–2010 | |||||||||||||
| Climate data for Nanisivik (Nanisivik Airport) Climate ID: 2402730; coordinates 72°59′N 84°37′W / 72.983°N 84.617°W; elevation: 641.9 m (2,106 ft); 1981–2010 normals |
|||||||||||||
|---|---|---|---|---|---|---|---|---|---|---|---|---|---|
| Month | Jan | Feb | Mar | Apr | May | Jun | Jul | Aug | Sep | Oct | Nov | Dec | Year |
| Record high humidex | −3.0 | 1.2 | −2.2 | −1.2 | 6.5 | 14.5 | 18.4 | 16.7 | 9.0 | 1.2 | −6.3 | −1.3 | 18.4 |
| Record high °C (°F) | −2.0 (28.4) |
2.0 (35.6) |
−3.0 (26.6) |
−0.5 (31.1) |
7.0 (44.6) |
18.5 (65.3) |
18.2 (64.8) |
17.0 (62.6) |
8.5 (47.3) |
2.0 (35.6) |
−6.0 (21.2) |
−4.4 (24.1) |
18.5 (65.3) |
| Mean daily maximum °C (°F) | −26.8 (−16.2) |
−27.2 (−17.0) |
−24.7 (−12.5) |
−16.6 (2.1) |
−7.6 (18.3) |
2.2 (36.0) |
7.5 (45.5) |
3.9 (39.0) |
−3.3 (26.1) |
−11.3 (11.7) |
−19.8 (−3.6) |
−23.6 (−10.5) |
−12.3 (9.9) |
| Daily mean °C (°F) | −29.6 (−21.3) |
−29.9 (−21.8) |
−27.6 (−17.7) |
−19.8 (−3.6) |
−10.3 (13.5) |
−0.1 (31.8) |
5.1 (41.2) |
1.7 (35.1) |
−5.0 (23.0) |
−13.6 (7.5) |
−22.5 (−8.5) |
−26.3 (−15.3) |
−14.8 (5.4) |
| Mean daily minimum °C (°F) | −32.4 (−26.3) |
−32.3 (−26.1) |
−30.1 (−22.2) |
−22.9 (−9.2) |
−13.0 (8.6) |
−2.4 (27.7) |
2.7 (36.9) |
−0.5 (31.1) |
−6.7 (19.9) |
−15.8 (3.6) |
−24.9 (−12.8) |
−28.7 (−19.7) |
−17.2 (1.0) |
| Record low °C (°F) | −48.5 (−55.3) |
−53.0 (−63.4) |
−47.5 (−53.5) |
−42.0 (−43.6) |
−28.3 (−18.9) |
−14.0 (6.8) |
−6.0 (21.2) |
−10.0 (14.0) |
−19.5 (−3.1) |
−35.0 (−31.0) |
−39.4 (−38.9) |
−45.5 (−49.9) |
−53.0 (−63.4) |
| Record low wind chill | −62.9 | −72.3 | −67.0 | −54.8 | −39.4 | −24.9 | −12.8 | −21.0 | −30.3 | −50.0 | −53.5 | −60.6 | −72.3 |
| Average precipitation mm (inches) | 5.4 (0.21) |
5.1 (0.20) |
8.4 (0.33) |
10.9 (0.43) |
24.0 (0.94) |
25.2 (0.99) |
45.7 (1.80) |
45.0 (1.77) |
38.4 (1.51) |
37.4 (1.47) |
18.1 (0.71) |
7.3 (0.29) |
270.9 (10.67) |
| Average rainfall mm (inches) | 0.0 (0.0) |
0.0 (0.0) |
0.0 (0.0) |
0.0 (0.0) |
0.1 (0.00) |
6.7 (0.26) |
37.0 (1.46) |
29.2 (1.15) |
4.4 (0.17) |
0.0 (0.0) |
0.0 (0.0) |
0.0 (0.0) |
77.3 (3.04) |
| Average snowfall cm (inches) | 5.4 (2.1) |
5.2 (2.0) |
8.4 (3.3) |
11.2 (4.4) |
24.0 (9.4) |
17.7 (7.0) |
8.5 (3.3) |
15.0 (5.9) |
32.3 (12.7) |
38.2 (15.0) |
17.9 (7.0) |
7.5 (3.0) |
191.3 (75.3) |
| Average precipitation days (≥ 0.2 mm) | 4.4 | 4.6 | 6.2 | 5.7 | 9.6 | 8.8 | 12.4 | 12.6 | 13.3 | 14.2 | 8.4 | 6.3 | 106.5 |
| Average rainy days (≥ 0.2 mm) | 0.0 | 0.0 | 0.0 | 0.0 | 0.0 | 2.2 | 10.4 | 8.1 | 1.7 | 0.0 | 0.0 | 0.0 | 22.3 |
| Average snowy days (≥ 0.2 cm) | 4.4 | 4.6 | 6.2 | 5.8 | 9.6 | 7.1 | 3.0 | 5.4 | 12.1 | 14.3 | 8.5 | 6.4 | 87.3 |
| Average relative humidity (%) | 64.1 | 65.0 | 66.6 | 71.2 | 81.3 | 80.7 | 75.6 | 84.9 | 88.6 | 89.7 | 72.9 | 68.7 | 75.8 |
| Source: Environment and Climate Change Canada Canadian Climate Normals 1981–2010 | |||||||||||||
Resources and Industry
Baffin Island has valuable natural resources. In the southern part, there are special rock formations. These can contain diamonds!
The Mary River Mine is an important iron ore mine on the island. It started operating in 2015. It has been producing a lot of iron ore. This mine helps create jobs and brings resources to the area.
Images for kids
-
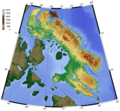
Topography of Baffin Island
-
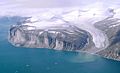
Coast of the Remote Peninsula in Kangiqtualuk Uqquqti (Sam Ford Fjord)
-
Southern tip of Baffin Island
-
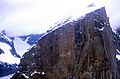
Mount Thor, a large cliff on Baffin Island
-
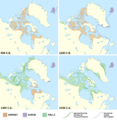
Map showing the spread of Thule culture in Canada and Greenland
-
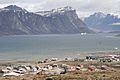
The community of Pangnirtung
-
Sea ice off Baffin Island
-
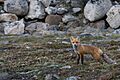
A Baffin Island red fox
-
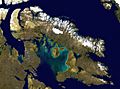
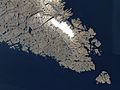
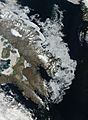
Satellite image of Baffin Island
-
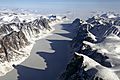
An ice-covered fjord on Baffin Island
-
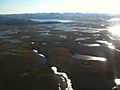
Aerial view of Baffin Island


See also
 In Spanish: Isla de Baffin para niños
