Climate of California facts for kids
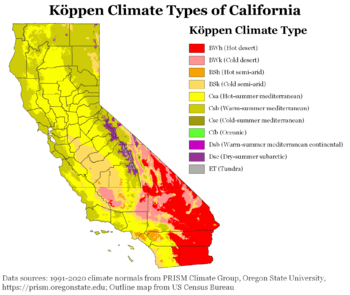
The climate of California is super varied! It can be a really hot desert in one place and feel like alpine tundra (cold, treeless mountains) in another. This depends on where you are (north or south), how high up you are, and how close you are to the Pacific Ocean.
Many parts of California, like the coastal areas, the Sierra Nevada foothills, and much of the Central Valley, have a Mediterranean climate. This means they have warm, dry summers and cooler, wetter winters. The ocean helps keep coastal temperatures mild, so winters are warmer and summers are much cooler right by the beach.
Contents
Temperature Differences
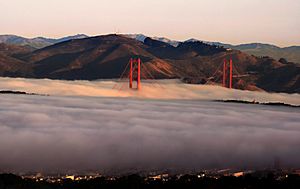
Near the coast, cool ocean water often creates summer fog. This gives places like San Francisco a "cool-summer Mediterranean climate." As you go further inland, away from the ocean, the climate changes. Winters become colder and summers get much hotter. Some areas even become semi-arid (meaning they are partly dry).
Low-lying inland valleys, especially the Central Valley, have a "hot-summer Mediterranean climate." This means they have warm, sunny summers and often foggy winters.
The temperature can change a lot between the coast and inland valleys. For example, in summer, it can be about 20°F (11°C) hotter inland than right on the coast. In San Francisco, the average high in July and August is around 62-68°F (17-20°C). But in Walnut Creek, which is about 20 miles (32 km) inland, the average high is 84°F (29°C)! That's a big jump in temperature over a short distance.
During the cooler months (October to March), the Coachella Valley often has the warmest winter temperatures west of the Rocky Mountains. Palm Springs, a city in this valley, has average high temperatures of 75°F (24°C) from November to April.
The very southwest part of California, around San Diego, has a subtropical semi-arid climate, which means its winters are drier.
The southeastern parts of California have a very hot and dry climate, similar to the Sahara Desert. In the northern part of the Mojave Desert is Death Valley, which has some of the highest temperatures ever recorded on Earth! It's common for summer temperatures there to go above 120°F (49°C). The highest temperature ever reliably recorded in the world was 134°F (57°C) in Death Valley on July 10, 1913.
Place | Jan | Feb | Mar | Apr | May | Jun | Jul | Aug | Sep | Oct | Nov | Dec |
---|---|---|---|---|---|---|---|---|---|---|---|---|
Alturas | 44 / 18 (7 / −8) |
48 / 21 (9 / −6) |
54 / 25 (12 / −4) |
60 / 28 (16 / −2) |
70 / 34 (21 / 1) |
79 / 40 (26 / 4) |
90 / 44 (32 / 7) |
89 / 42 (32 / 6) |
80 / 36 (27 / 2) |
68 / 28 (20 / −2) |
52 / 23 (11 / −5) |
42 / 18 (6 / −8) |
Bakersfield | 56 / 39 (13 / 4) |
63 / 42 (17 / 6) |
69 / 47 (21 / 8) |
75 / 50 (24 / 10) |
84 / 58 (29 / 14) |
91 / 64 (33 / 18) |
97 / 71 (36 / 22) |
96 / 69 (36 / 21) |
90 / 64 (32 / 18) |
80 / 55 (27 / 13) |
66 / 45 (19 / 7) |
57 / 39 (14 / 4) |
Bishop | 54 / 23 (12 / −5) |
58 / 27 (14 / −3) |
66 / 31 (19 / −1) |
73 / 36 (23 / 2) |
82 / 44 (28 / 7) |
92 / 51 (33 / 11) |
98 / 56 (37 / 13) |
96 / 54 (36 / 12) |
88 / 47 (31 / 8) |
76 / 37 (24 / 3) |
63 / 28 (17 / −2) |
53 / 22 (12 / −6) |
Bodie | 40 / 5 (4 / −15) |
41 / 7 (5 / −14) |
45 / 11 (7 / −12) |
50 / 17 (10 / −8) |
61 / 24 (16 / −4) |
70 / 30 (21 / −1) |
78 / 34 (26 / 1) |
77 / 32 (25 / 0) |
71 / 26 (22 / −3) |
60 / 18 (16 / −8) |
49 / 11 (9 / −12) |
41 / 6 (5 / −14) |
Death Valley | 67 / 40 (19 / 4) |
73 / 46 (23 / 8) |
82 / 55 (28 / 13) |
91 / 62 (33 / 17) |
101 / 73 (38 / 23) |
110 / 81 (43 / 27) |
117 / 88 (47 / 31) |
115 / 86 (46 / 30) |
107 / 76 (42 / 24) |
93 / 62 (34 / 17) |
77 / 48 (25 / 9) |
65 / 38 (18 / 3) |
Eureka | 56 / 41 (13 / 5) |
56 / 42 (13 / 6) |
57 / 43 (14 / 6) |
58 / 44 (14 / 7) |
60 / 48 (16 / 9) |
62 / 50 (17 / 10) |
63 / 52 (17 / 11) |
64 / 53 (18 / 12) |
64 / 50 (18 / 10) |
62 / 47 (17 / 8) |
58 / 44 (14 / 7) |
55 / 41 (13 / 5) |
Fresno | 55 / 38 (13 / 3) |
62 / 42 (17 / 6) |
68 / 46 (20 / 8) |
75 / 49 (24 / 9) |
84 / 56 (29 / 13) |
92 / 62 (33 / 17) |
98 / 68 (37 / 20) |
97 / 66 (36 / 19) |
91 / 62 (33 / 17) |
80 / 53 (27 / 12) |
65 / 43 (18 / 6) |
55 / 38 (13 / 3) |
Los Angeles | 68 / 48 (20 / 9) |
69 / 49 (21 / 9) |
70 / 51 (21 / 11) |
73 / 54 (23 / 12) |
75 / 57 (24 / 14) |
78 / 60 (26 / 16) |
83 / 64 (28 / 18) |
84 / 64 (29 / 18) |
83 / 63 (28 / 17) |
79 / 59 (26 / 15) |
73 / 52 (23 / 11) |
68 / 48 (20 / 9) |
Needles | 65 / 44 (18 / 7) |
70 / 47 (21 / 8) |
77 / 52 (25 / 11) |
85 / 59 (29 / 15) |
95 / 68 (35 / 20) |
104 / 77 (40 / 25) |
109 / 84 (43 / 29) |
107 / 83 (42 / 28) |
100 / 75 (38 / 24) |
88 / 62 (31 / 17) |
73 / 50 (23 / 10) |
63 / 43 (17 / 6) |
Redding | 55 / 37 (13 / 3) |
60 / 39 (16 / 4) |
65 / 43 (18 / 6) |
71 / 46 (22 / 8) |
81 / 54 (27 / 12) |
90 / 61 (32 / 16) |
98 / 66 (37 / 19) |
97 / 63 (36 / 17) |
90 / 58 (32 / 14) |
78 / 50 (26 / 10) |
63 / 41 (17 / 5) |
55 / 36 (13 / 2) |
Riverside | 69 / 43 (21 / 6) |
70 / 45 (21 / 7) |
73 / 46 (23 / 8) |
78 / 50 (26 / 10) |
83 / 55 (28 / 13) |
89 / 60 (32 / 16) |
95 / 64 (35 / 18) |
96 / 65 (36 / 18) |
92 / 61 (33 / 16) |
83 / 55 (28 / 13) |
75 / 47 (24 / 8) |
68 / 42 (20 / 6) |
Sacramento | 54 / 39 (12 / 4) |
60 / 41 (16 / 5) |
65 / 44 (18 / 7) |
71 / 46 (22 / 8) |
80 / 51 (27 / 11) |
87 / 56 (31 / 13) |
92 / 58 (33 / 14) |
91 / 58 (33 / 14) |
87 / 56 (31 / 13) |
78 / 50 (26 / 10) |
64 / 43 (18 / 6) |
54 / 38 (12 / 3) |
San Diego | 65 / 49 (18 / 9) |
65 / 51 (18 / 11) |
67 / 53 (19 / 12) |
68 / 56 (20 / 13) |
69 / 59 (21 / 15) |
71 / 62 (22 / 17) |
75 / 65 (24 / 18) |
76 / 67 (24 / 19) |
76 / 65 (24 / 18) |
73 / 61 (23 / 16) |
69 / 54 (21 / 12) |
65 / 48 (18 / 9) |
San Francisco |
57 / 46 (14 / 8) |
60 / 48 (16 / 9) |
62 / 49 (17 / 9) |
63 / 49 (17 / 9) |
64 / 51 (18 / 11) |
66 / 53 (19 / 12) |
66 / 54 (19 / 12) |
68 / 55 (20 / 13) |
70 / 55 (21 / 13) |
69 / 54 (21 / 12) |
63 / 50 (17 / 10) |
57 / 46 (14 / 8) |
San Jose | 58 / 42 (14 / 6) |
62 / 45 (17 / 7) |
66 / 47 (19 / 8) |
69 / 49 (21 / 9) |
74 / 52 (23 / 11) |
79 / 56 (26 / 13) |
82 / 58 (28 / 14) |
82 / 58 (28 / 14) |
80 / 57 (27 / 14) |
74 / 53 (23 / 12) |
64 / 46 (18 / 8) |
58 / 42 (14 / 6) |
Santa Rosa | 59 / 39 (15 / 4) |
63 / 41 (17 / 5) |
67 / 43 (19 / 6) |
70 / 45 (21 / 7) |
75 / 48 (24 / 9) |
80 / 52 (27 / 11) |
82 / 52 (28 / 11) |
83 / 53 (28 / 12) |
83 / 52 (28 / 11) |
78 / 48 (26 / 9) |
67 / 43 (19 / 6) |
59 / 39 (15 / 4) |
South Lake Tahoe |
43 / 16 (6 / −9) |
44 / 18 (7 / −8) |
49 / 23 (9 / −5) |
54 / 27 (12 / −3) |
64 / 32 (18 / 0) |
72 / 37 (22 / 3) |
81 / 41 (27 / 5) |
80 / 40 (27 / 4) |
74 / 35 (23 / 2) |
63 / 28 (17 / −2) |
51 / 22 (11 / −6) |
43 / 17 (6 / −8) |
California's Hottest and Coldest Temperatures
The highest temperature ever recorded in California was 134°F (57°C) in Death Valley on July 10, 1913. This is also the highest temperature ever recorded anywhere on Earth! The lowest temperature was -45°F (-43°C) in Boca on January 20, 1937.
Climate data for California | |||||||||||||
---|---|---|---|---|---|---|---|---|---|---|---|---|---|
Month | Jan | Feb | Mar | Apr | May | Jun | Jul | Aug | Sep | Oct | Nov | Dec | Year |
Record high °F (°C) | 97 (36) |
102 (39) |
108 (42) |
118 (48) |
122 (50) |
129 (54) |
134 (57) |
130 (54) |
127 (53) |
118 (48) |
105 (41) |
100 (38) |
134 (57) |
Record low °F (°C) | −45 (−43) |
−43 (−42) |
−35 (−37) |
−30 (−34) |
−15 (−26) |
2 (−17) |
12 (−11) |
12 (−11) |
−5 (−21) |
−20 (−29) |
−28 (−33) |
−40 (−40) |
−45 (−43) |
Source: https://www.infoplease.com/science-health/weather/california-temperature-extremes |
Weather for Major Cities
Here are some detailed weather statistics for a few major cities in California:
Climate data for Fresno, California (Fresno Airport), 1981–2010 normals, extremes 1881–present | |||||||||||||
---|---|---|---|---|---|---|---|---|---|---|---|---|---|
Month | Jan | Feb | Mar | Apr | May | Jun | Jul | Aug | Sep | Oct | Nov | Dec | Year |
Record high °F (°C) | 78 (26) |
84 (29) |
90 (32) |
101 (38) |
110 (43) |
112 (44) |
115 (46) |
113 (45) |
111 (44) |
102 (39) |
90 (32) |
77 (25) |
115 (46) |
Mean daily maximum °F (°C) | 54.8 (12.7) |
61.6 (16.4) |
67.6 (19.8) |
74.6 (23.7) |
84.1 (28.9) |
92.0 (33.3) |
98.4 (36.9) |
97.1 (36.2) |
90.9 (32.7) |
79.5 (26.4) |
65.1 (18.4) |
54.9 (12.7) |
76.7 (24.8) |
Mean daily minimum °F (°C) | 38.3 (3.5) |
41.5 (5.3) |
45.6 (7.6) |
49.4 (9.7) |
56.2 (13.4) |
62.4 (16.9) |
67.6 (19.8) |
66.2 (19.0) |
61.5 (16.4) |
53.0 (11.7) |
43.4 (6.3) |
38.0 (3.3) |
51.9 (11.1) |
Record low °F (°C) | 17 (−8) |
24 (−4) |
26 (−3) |
32 (0) |
36 (2) |
42 (6) |
50 (10) |
49 (9) |
37 (3) |
27 (−3) |
26 (−3) |
18 (−8) |
17 (−8) |
Average precipitation inches (mm) | 2.19 (56) |
2.03 (52) |
2.03 (52) |
0.95 (24) |
0.43 (11) |
0.21 (5.3) |
0.01 (0.25) |
0.01 (0.25) |
0.17 (4.3) |
0.63 (16) |
1.07 (27) |
1.77 (45) |
11.50 (292) |
Average precipitation days (≥ 0.01 in) | 7.6 | 8.6 | 7.5 | 4.5 | 2.2 | 0.7 | 0.2 | 0.3 | 1.0 | 2.5 | 5.5 | 7.5 | 48.1 |
Average relative humidity (%) | 83.3 | 77.2 | 68.9 | 57.4 | 47.3 | 41.9 | 39.2 | 44.7 | 50.0 | 58.5 | 74.1 | 84.2 | 60.6 |
Mean monthly sunshine hours | 141.5 | 196.9 | 286.2 | 335.5 | 398.9 | 412.2 | 428.2 | 399.6 | 345.9 | 302.3 | 189.9 | 127.1 | 3,564.2 |
Percent possible sunshine | 46 | 65 | 77 | 85 | 91 | 94 | 96 | 95 | 93 | 87 | 62 | 42 | 80 |
Source: NOAA (relative humidity and sun 1961–1990) , Weather.com |
Climate data for Los Angeles (USC, Downtown), 1981–2010 normals, extremes 1877–present | |||||||||||||
---|---|---|---|---|---|---|---|---|---|---|---|---|---|
Month | Jan | Feb | Mar | Apr | May | Jun | Jul | Aug | Sep | Oct | Nov | Dec | Year |
Record high °F (°C) | 95 (35) |
95 (35) |
99 (37) |
106 (41) |
103 (39) |
112 (44) |
109 (43) |
106 (41) |
113 (45) |
108 (42) |
100 (38) |
92 (33) |
113 (45) |
Mean maximum °F (°C) | 83.3 (28.5) |
84.3 (29.1) |
85.8 (29.9) |
91.2 (32.9) |
89.7 (32.1) |
90.2 (32.3) |
94.1 (34.5) |
95.3 (35.2) |
98.9 (37.2) |
95.5 (35.3) |
88.0 (31.1) |
81.4 (27.4) |
102.7 (39.3) |
Mean daily maximum °F (°C) | 68.2 (20.1) |
68.6 (20.3) |
70.2 (21.2) |
72.7 (22.6) |
74.5 (23.6) |
78.1 (25.6) |
83.1 (28.4) |
84.4 (29.1) |
83.1 (28.4) |
78.5 (25.8) |
72.8 (22.7) |
67.7 (19.8) |
75.2 (24.0) |
Daily mean °F (°C) | 58.0 (14.4) |
58.9 (14.9) |
60.6 (15.9) |
63.1 (17.3) |
65.8 (18.8) |
69.2 (20.7) |
73.3 (22.9) |
74.3 (23.5) |
73.1 (22.8) |
68.6 (20.3) |
62.4 (16.9) |
57.6 (14.2) |
65.4 (18.6) |
Mean daily minimum °F (°C) | 47.8 (8.8) |
49.3 (9.6) |
51.0 (10.6) |
53.5 (11.9) |
57.1 (13.9) |
60.3 (15.7) |
63.6 (17.6) |
64.1 (17.8) |
63.1 (17.3) |
58.7 (14.8) |
52.0 (11.1) |
47.5 (8.6) |
55.7 (13.2) |
Mean minimum °F (°C) | 41.3 (5.2) |
42.9 (6.1) |
44.9 (7.2) |
48.4 (9.1) |
53.6 (12.0) |
57.2 (14.0) |
61.2 (16.2) |
61.8 (16.6) |
59.2 (15.1) |
54.1 (12.3) |
45.0 (7.2) |
40.8 (4.9) |
39.1 (3.9) |
Record low °F (°C) | 28 (−2) |
28 (−2) |
31 (−1) |
36 (2) |
40 (4) |
46 (8) |
49 (9) |
49 (9) |
44 (7) |
40 (4) |
34 (1) |
30 (−1) |
28 (−2) |
Average rainfall inches (mm) | 3.12 (79) |
3.80 (97) |
2.43 (62) |
0.91 (23) |
0.26 (6.6) |
0.09 (2.3) |
0.01 (0.25) |
0.04 (1.0) |
0.24 (6.1) |
0.66 (17) |
1.04 (26) |
2.33 (59) |
14.93 (379.25) |
Average rainy days (≥ 0.01 in) | 6.1 | 6.4 | 5.5 | 3.2 | 1.3 | 0.6 | 0.3 | 0.3 | 1.0 | 2.5 | 3.3 | 5.2 | 35.7 |
Mean monthly sunshine hours | 225.3 | 222.5 | 267.0 | 303.5 | 276.2 | 275.8 | 364.1 | 349.5 | 278.5 | 255.1 | 217.3 | 219.4 | 3,254.2 |
Percent possible sunshine | 71 | 72 | 72 | 78 | 64 | 64 | 83 | 84 | 75 | 73 | 70 | 71 | 73 |
Source: NOAA (sun 1961–1977) |
Climate data for Los Angeles (LAX), 1981–2010 normals, extremes 1944–present | |||||||||||||
---|---|---|---|---|---|---|---|---|---|---|---|---|---|
Month | Jan | Feb | Mar | Apr | May | Jun | Jul | Aug | Sep | Oct | Nov | Dec | Year |
Record high °F (°C) | 91 (33) |
92 (33) |
95 (35) |
95 (35) |
91 (33) |
103 (39) |
93 (34) |
98 (37) |
106 (41) |
101 (38) |
101 (38) |
94 (34) |
106 (41) |
Mean maximum °F (°C) | 81.2 (27.3) |
81.0 (27.2) |
79.6 (26.4) |
83.4 (28.6) |
79.9 (26.6) |
80.0 (26.7) |
83.6 (28.7) |
85.7 (29.8) |
90.1 (32.3) |
89.9 (32.2) |
85.5 (29.7) |
78.9 (26.1) |
94.7 (34.8) |
Mean daily maximum °F (°C) | 64.6 (18.1) |
64.3 (17.9) |
64.4 (18.0) |
66.4 (19.1) |
68.1 (20.1) |
70.6 (21.4) |
73.8 (23.2) |
74.9 (23.8) |
74.6 (23.7) |
72.5 (22.5) |
68.9 (20.5) |
64.6 (18.1) |
69.0 (20.6) |
Daily mean °F (°C) | 56.7 (13.7) |
57.1 (13.9) |
58.0 (14.4) |
60.1 (15.6) |
62.7 (17.1) |
65.5 (18.6) |
68.8 (20.4) |
69.6 (20.9) |
68.9 (20.5) |
65.9 (18.8) |
61.1 (16.2) |
56.6 (13.7) |
62.6 (17.0) |
Mean daily minimum °F (°C) | 48.8 (9.3) |
50.0 (10.0) |
51.7 (10.9) |
53.8 (12.1) |
57.3 (14.1) |
60.5 (15.8) |
63.7 (17.6) |
64.3 (17.9) |
63.2 (17.3) |
59.3 (15.2) |
53.2 (11.8) |
48.7 (9.3) |
56.2 (13.4) |
Mean minimum °F (°C) | 41.1 (5.1) |
42.5 (5.8) |
44.6 (7.0) |
47.5 (8.6) |
52.5 (11.4) |
56.2 (13.4) |
59.8 (15.4) |
60.6 (15.9) |
58.4 (14.7) |
52.7 (11.5) |
45.3 (7.4) |
40.9 (4.9) |
38.8 (3.8) |
Record low °F (°C) | 27 (−3) |
34 (1) |
35 (2) |
42 (6) |
45 (7) |
48 (9) |
52 (11) |
51 (11) |
47 (8) |
43 (6) |
38 (3) |
32 (0) |
27 (−3) |
Average rainfall inches (mm) | 2.71 (69) |
3.25 (83) |
1.85 (47) |
0.70 (18) |
0.22 (5.6) |
0.08 (2.0) |
0.03 (0.76) |
0.05 (1.3) |
0.21 (5.3) |
0.56 (14) |
1.11 (28) |
2.05 (52) |
12.82 (326) |
Average rainy days (≥ 0.01 in) | 6.0 | 6.6 | 5.8 | 2.8 | 1.2 | 0.6 | 0.5 | 0.3 | 1.0 | 2.3 | 3.4 | 5.2 | 35.7 |
Average relative humidity (%) | 63.4 | 67.9 | 70.5 | 71.0 | 74.0 | 75.9 | 76.6 | 76.6 | 74.2 | 70.5 | 65.5 | 62.9 | 70.8 |
Source: NOAA (relative humidity 1961–1990) |
Climate data for Sacramento, California (Sacramento Executive Airport), 1981–2010 normals, extremes 1941–present | |||||||||||||
---|---|---|---|---|---|---|---|---|---|---|---|---|---|
Month | Jan | Feb | Mar | Apr | May | Jun | Jul | Aug | Sep | Oct | Nov | Dec | Year |
Record high °F (°C) | 76 (24) |
76 (24) |
88 (31) |
95 (35) |
105 (41) |
115 (46) |
114 (46) |
110 (43) |
108 (42) |
104 (40) |
87 (31) |
73 (23) |
115 (46) |
Mean maximum °F (°C) | 64.0 (17.8) |
70.5 (21.4) |
76.8 (24.9) |
87.2 (30.7) |
95.8 (35.4) |
102.3 (39.1) |
105.0 (40.6) |
103.7 (39.8) |
100.1 (37.8) |
91.6 (33.1) |
76.1 (24.5) |
64.6 (18.1) |
106.8 (41.6) |
Mean daily maximum °F (°C) | 53.8 (12.1) |
60.3 (15.7) |
65.1 (18.4) |
71.1 (21.7) |
79.9 (26.6) |
87.1 (30.6) |
92.1 (33.4) |
91.2 (32.9) |
87.2 (30.7) |
77.6 (25.3) |
63.8 (17.7) |
53.9 (12.2) |
73.6 (23.1) |
Mean daily minimum °F (°C) | 38.8 (3.8) |
41.4 (5.2) |
44.1 (6.7) |
46.2 (7.9) |
51.1 (10.6) |
55.8 (13.2) |
58.4 (14.7) |
58.0 (14.4) |
55.7 (13.2) |
50.2 (10.1) |
42.8 (6.0) |
38.4 (3.6) |
48.4 (9.1) |
Mean minimum °F (°C) | 29.1 (−1.6) |
31.5 (−0.3) |
35.1 (1.7) |
38.0 (3.3) |
42.9 (6.1) |
48.7 (9.3) |
53.1 (11.7) |
53.0 (11.7) |
49.2 (9.6) |
41.7 (5.4) |
32.5 (0.3) |
28.5 (−1.9) |
26.6 (−3.0) |
Record low °F (°C) | 20 (−7) |
23 (−5) |
26 (−3) |
31 (−1) |
34 (1) |
41 (5) |
48 (9) |
48 (9) |
42 (6) |
35 (2) |
26 (−3) |
18 (−8) |
18 (−8) |
Average precipitation inches (mm) | 3.64 (92) |
3.47 (88) |
2.75 (70) |
1.15 (29) |
0.68 (17) |
0.21 (5.3) |
0 (0) |
0.05 (1.3) |
0.29 (7.4) |
0.95 (24) |
2.08 (53) |
3.25 (83) |
18.25 (464) |
Average precipitation days (≥ 0.01 in) | 10.3 | 9.4 | 9.1 | 4.9 | 3.2 | 1.2 | 0 | 0.3 | 1.3 | 3.6 | 6.9 | 9.9 | 60.0 |
Average relative humidity (%) | 83.3 | 76.8 | 71.6 | 64.5 | 58.9 | 55.0 | 53.2 | 55.7 | 57.0 | 63.1 | 75.6 | 82.9 | 66.5 |
Mean monthly sunshine hours | 145.5 | 201.3 | 278.0 | 329.6 | 406.3 | 419.5 | 440.2 | 406.9 | 347.8 | 296.7 | 194.9 | 141.1 | 3,607.8 |
Percent possible sunshine | 48 | 67 | 75 | 83 | 92 | 94 | 98 | 96 | 93 | 86 | 64 | 48 | 81 |
Source: NOAA (relative humidity and sun 1961–1990) |
Climate data for Sacramento 5 ESE, California (1981–2010 normals, extremes 1877–present) | |||||||||||||
---|---|---|---|---|---|---|---|---|---|---|---|---|---|
Month | Jan | Feb | Mar | Apr | May | Jun | Jul | Aug | Sep | Oct | Nov | Dec | Year |
Record high °F (°C) | 79 (26) |
80 (27) |
90 (32) |
98 (37) |
107 (42) |
112 (44) |
114 (46) |
111 (44) |
109 (43) |
102 (39) |
86 (30) |
72 (22) |
114 (46) |
Mean maximum °F (°C) | 65.7 (18.7) |
72.8 (22.7) |
80.0 (26.7) |
90.2 (32.3) |
97.9 (36.6) |
104.1 (40.1) |
106.6 (41.4) |
105.4 (40.8) |
101.7 (38.7) |
93.1 (33.9) |
77.0 (25.0) |
65.6 (18.7) |
108.3 (42.4) |
Mean daily maximum °F (°C) | 54.4 (12.4) |
61.2 (16.2) |
66.8 (19.3) |
72.7 (22.6) |
80.9 (27.2) |
87.9 (31.1) |
93.3 (34.1) |
92.2 (33.4) |
87.9 (31.1) |
77.9 (25.5) |
63.7 (17.6) |
54.3 (12.4) |
74.4 (23.6) |
Mean daily minimum °F (°C) | 40.7 (4.8) |
43.7 (6.5) |
46.5 (8.1) |
49.0 (9.4) |
53.9 (12.2) |
58.4 (14.7) |
60.9 (16.1) |
60.5 (15.8) |
58.4 (14.7) |
52.8 (11.6) |
45.5 (7.5) |
40.4 (4.7) |
50.9 (10.5) |
Mean minimum °F (°C) | 32.8 (0.4) |
35.0 (1.7) |
38.7 (3.7) |
41.9 (5.5) |
46.7 (8.2) |
51.6 (10.9) |
55.0 (12.8) |
55.3 (12.9) |
52.1 (11.2) |
45.1 (7.3) |
35.7 (2.1) |
31.5 (−0.3) |
30.1 (−1.1) |
Record low °F (°C) | 19 (−7) |
21 (−6) |
29 (−2) |
34 (1) |
37 (3) |
43 (6) |
47 (8) |
48 (9) |
44 (7) |
34 (1) |
27 (−3) |
17 (−8) |
17 (−8) |
Average precipitation inches (mm) | 3.97 (101) |
3.69 (94) |
3.02 (77) |
1.30 (33) |
0.76 (19) |
0.19 (4.8) |
0 (0) |
0.03 (0.76) |
0.35 (8.9) |
1.05 (27) |
2.43 (62) |
3.48 (88) |
20.27 (515) |
Average precipitation days (≥ 0.01 in) | 11.2 | 9.8 | 9.2 | 5.2 | 3.2 | 1.2 | 0.1 | 0.4 | 1.4 | 3.6 | 7.4 | 10.5 | 63.5 |
Source: NOAA , Western Regional Climate Center |
Climate data for San Francisco (downtown), 1981–2010 normals, extremes 1849–present | |||||||||||||
---|---|---|---|---|---|---|---|---|---|---|---|---|---|
Month | Jan | Feb | Mar | Apr | May | Jun | Jul | Aug | Sep | Oct | Nov | Dec | Year |
Record high °F (°C) | 79 (26) |
81 (27) |
87 (31) |
94 (34) |
97 (36) |
103 (39) |
98 (37) |
98 (37) |
101 (38) |
102 (39) |
86 (30) |
76 (24) |
103 (39) |
Mean maximum °F (°C) | 67.3 (19.6) |
72.5 (22.5) |
75.7 (24.3) |
82.3 (27.9) |
82.7 (28.2) |
86.0 (30.0) |
83.1 (28.4) |
85.5 (29.7) |
89.6 (32.0) |
88.1 (31.2) |
76.1 (24.5) |
66.4 (19.1) |
94.3 (34.6) |
Mean daily maximum °F (°C) | 56.9 (13.8) |
60.2 (15.7) |
61.8 (16.6) |
63.1 (17.3) |
64.3 (17.9) |
66.4 (19.1) |
66.5 (19.2) |
68.1 (20.1) |
70.2 (21.2) |
69.2 (20.7) |
63.1 (17.3) |
57.1 (13.9) |
63.9 (17.7) |
Daily mean °F (°C) | 51.3 (10.7) |
53.9 (12.2) |
55.1 (12.8) |
56.2 (13.4) |
57.6 (14.2) |
59.6 (15.3) |
60.3 (15.7) |
61.6 (16.4) |
62.7 (17.1) |
61.5 (16.4) |
56.6 (13.7) |
51.6 (10.9) |
57.3 (14.1) |
Mean daily minimum °F (°C) | 45.7 (7.6) |
47.5 (8.6) |
48.5 (9.2) |
49.2 (9.6) |
51.0 (10.6) |
52.8 (11.6) |
54.1 (12.3) |
55.1 (12.8) |
55.1 (12.8) |
53.7 (12.1) |
50.1 (10.1) |
46.1 (7.8) |
50.7 (10.4) |
Mean minimum °F (°C) | 40.3 (4.6) |
41.8 (5.4) |
43.6 (6.4) |
45.1 (7.3) |
47.7 (8.7) |
50.2 (10.1) |
51.5 (10.8) |
52.6 (11.4) |
52.0 (11.1) |
49.6 (9.8) |
44.2 (6.8) |
40.1 (4.5) |
38.2 (3.4) |
Record low °F (°C) | 29 (−2) |
31 (−1) |
33 (1) |
40 (4) |
42 (6) |
46 (8) |
47 (8) |
46 (8) |
47 (8) |
43 (6) |
38 (3) |
27 (−3) |
27 (−3) |
Average rainfall inches (mm) | 4.50 (114) |
4.46 (113) |
3.26 (83) |
1.46 (37) |
0.70 (18) |
0.16 (4.1) |
0.00 (0.00) |
0.06 (1.5) |
0.21 (5.3) |
1.12 (28) |
3.16 (80) |
4.56 (116) |
23.65 (601) |
Average rainy days (≥ 0.01 in) | 11.7 | 11.1 | 11.0 | 6.5 | 3.8 | 1.5 | 0.3 | 1.0 | 1.7 | 3.9 | 8.9 | 11.6 | 73.0 |
Mean monthly sunshine hours | 185.9 | 207.7 | 269.1 | 309.3 | 325.1 | 311.4 | 313.3 | 287.4 | 271.4 | 247.1 | 173.4 | 160.6 | 3,061.7 |
Percent possible sunshine | 61 | 69 | 73 | 78 | 74 | 70 | 70 | 68 | 73 | 71 | 57 | 54 | 69 |
Source: NOAA (sun 1961–1974) |
Climate data for San Diego Int'l Airport (1981–2010 normals, extremes 1874–present) | |||||||||||||
---|---|---|---|---|---|---|---|---|---|---|---|---|---|
Month | Jan | Feb | Mar | Apr | May | Jun | Jul | Aug | Sep | Oct | Nov | Dec | Year |
Record high °F (°C) | 88 (31) |
90 (32) |
99 (37) |
98 (37) |
98 (37) |
101 (38) |
100 (38) |
98 (37) |
111 (44) |
107 (42) |
100 (38) |
88 (31) |
111 (44) |
Mean maximum °F (°C) | 78.4 (25.8) |
79.2 (26.2) |
79.8 (26.6) |
82.8 (28.2) |
79.0 (26.1) |
81.2 (27.3) |
83.2 (28.4) |
85.4 (29.7) |
89.5 (31.9) |
86.8 (30.4) |
82.9 (28.3) |
76.6 (24.8) |
94.1 (34.5) |
Mean daily maximum °F (°C) | 65.1 (18.4) |
65.0 (18.3) |
65.6 (18.7) |
67.5 (19.7) |
68.5 (20.3) |
70.8 (21.6) |
74.6 (23.7) |
76.4 (24.7) |
75.9 (24.4) |
72.8 (22.7) |
69.0 (20.6) |
64.7 (18.2) |
69.7 (20.9) |
Mean daily minimum °F (°C) | 49.0 (9.4) |
50.7 (10.4) |
53.2 (11.8) |
55.9 (13.3) |
59.4 (15.2) |
62.0 (16.7) |
65.4 (18.6) |
66.7 (19.3) |
65.2 (18.4) |
60.6 (15.9) |
53.6 (12.0) |
48.4 (9.1) |
57.5 (14.2) |
Mean minimum °F (°C) | 41.9 (5.5) |
44.6 (7.0) |
47.1 (8.4) |
50.7 (10.4) |
55.0 (12.8) |
59.1 (15.1) |
62.5 (16.9) |
63.3 (17.4) |
60.4 (15.8) |
54.4 (12.4) |
45.8 (7.7) |
41.4 (5.2) |
40.3 (4.6) |
Record low °F (°C) | 25 (−4) |
34 (1) |
36 (2) |
39 (4) |
45 (7) |
50 (10) |
54 (12) |
54 (12) |
50 (10) |
43 (6) |
36 (2) |
32 (0) |
25 (−4) |
Average rainfall inches (mm) | 1.98 (50) |
2.27 (58) |
1.81 (46) |
0.78 (20) |
0.12 (3.0) |
0.07 (1.8) |
0.03 (0.76) |
0.02 (0.51) |
0.15 (3.8) |
0.57 (14) |
1.01 (26) |
1.53 (39) |
10.34 (263) |
Average rainy days (≥ 0.01 in) | 6.7 | 7.1 | 6.5 | 4.0 | 1.4 | 0.8 | 0.7 | 0.4 | 1.2 | 2.8 | 4.1 | 5.8 | 41.5 |
Average relative humidity (%) | 63.1 | 65.7 | 67.3 | 67.0 | 70.6 | 74.0 | 74.6 | 74.1 | 72.7 | 69.4 | 66.3 | 63.7 | 69.0 |
Mean monthly sunshine hours | 239.3 | 227.4 | 261.0 | 276.2 | 250.5 | 242.4 | 304.7 | 295.0 | 253.3 | 243.4 | 230.1 | 231.3 | 3,054.6 |
Percent possible sunshine | 75 | 74 | 70 | 71 | 58 | 57 | 70 | 71 | 68 | 69 | 73 | 74 | 69 |
Source: NOAA (sun and relative humidity 1961–1990) |
Rain and Snow
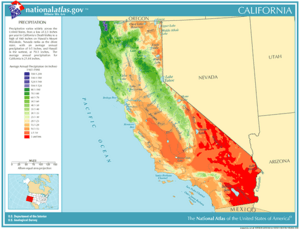
Winds from the ocean bring moisture to California. The northern parts of the state usually get more rain each year than the south. California's mountains also play a big role. When moist air from the west hits the mountains, it cools down and drops its moisture as rain or snow. That's why some of the rainiest places are on the western slopes of mountains.
Northwestern California has a mild climate with lots of rain, from 15 to 50 inches (380 to 1,270 mm) per year. Some areas with Coast Redwood forests can even get over 100 inches (2,540 mm) of rain each year!
The Central Valley has different amounts of rain. The northern parts get a lot of rain from winter storms that come down from the Pacific Northwest. But the very southern parts of the Central Valley are almost like a desert because they don't get much rain.
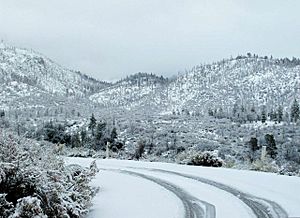
The high mountains, like the Sierra Nevada, Cascade Range, and Klamath Mountains, have a mountain climate. This means snowy winters and mild to warm summers. Ski resorts in places like Lake Tahoe and Mammoth Lakes often get over 10 feet (3 meters) of snow in a season!
On the east side of the mountains, it's much drier. This is called a "rain shadow." California's desert areas are east of the high Sierra Nevada and the southern California mountains. These include the hot Sonoran Desert areas like the Imperial and Coachella valleys, and the higher Mojave Desert and Owens Valley, which are part of the Great Basin region.
In the summer, especially from July to early September, the deserts can get sudden, heavy thunderstorms. This happens because of the "Mexican Monsoon," which brings moisture from the tropical Pacific and Gulf of California.
The ENSO cycle, which includes El Niño and La Niña, greatly affects California's rain and snow, especially in winter and spring. During El Niño, California often gets warmer temperatures and more heavy rains, especially in the south. During La Niña, the northern parts of California are wetter, but the south stays cool and dry.
Fog in California
You might notice less dense fog in Los Angeles over time. Scientists think this might be because cities are getting warmer (the "urban heat island effect") and there's less air pollution.
In the Central Valley during winter, a very thick fog called "tule fog" can form. It's named after the local tule grass. This fog can make it almost impossible to see, causing many traffic accidents. In 2007, a sudden patch of tule fog caused a huge crash involving 108 vehicles in Fresno. Because of this, a fog warning system was created along a section of Highway 99.
Tornadoes in California
California does get tornadoes, but they are usually weaker and don't last as long as those in the central United States. They mostly happen in the Los Angeles area, the southern California deserts, and the Central Valley. Because they are so unpredictable, it's very hard to forecast them before they touch down.
The most tornadoes in California on a single day was seven, on November 9, 1982. In July 2004, a tornado touched down in Sequoia National Park at a very high altitude of about 12,156 feet (3,705 meters). This was the highest confirmed tornado in the United States!
Tropical Storms and California
Even though California has a long coastline, it doesn't get hit by tropical cyclones (like hurricanes) very often. This is because of the cold ocean current from the North Pacific. In recorded history, California has only been hit by three tropical storms. One storm in 1939 brought heavy rain to the Los Angeles area and deserts. However, the leftover parts of tropical storms can affect California every few years.
Wildfires

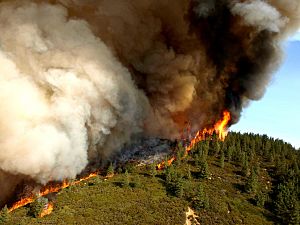
Summers in inland California can be very hot, often over 100°F (38°C), and get very little rain. This makes them very likely to have wildfires. These fires can be dangerous and force people to evacuate their homes. Wildfires are less common along the coast because it's cooler and more humid in the summer. But they can still happen in autumn when the air is drier.
Sometimes, wildfires can even create "fire whirls" or fire tornadoes! One such event was very powerful, like an EF3 tornado, and happened in Redding during the Carr Fire. This fire whirl had winds over 143 mph (230 km/h) and caused a lot of damage.
Winds
In February 2017, a winter storm brought a super strong wind gust of 199 mph (320 km/h) at Ward Peak in the Alpine Meadows ski resort.
Glossary of California Weather Terms
Here are some special terms used to describe California's unique weather:
- Earthquake weather: This is a popular idea that unusual, uncomfortable weather (often hot and humid) means an earthquake is coming. However, scientists say there's no real connection between weather and earthquakes.
- Marine layer: This is a cool, moist layer of air that comes in from the ocean, often bringing fog. It's common along the northern and central California coast from late spring to early fall.
- May Gray/June Gloom: This describes the cloudy and foggy weather that often happens along coastal California in May and June. It's caused by a mix of warm inland air, cool ocean water, and wind patterns.
- Pineapple Express: This is when a lot of rain comes to California. It happens when the jet stream pulls warm, humid air from near Hawaii (that's why it's called "Pineapple Express") towards California. This can cause extremely heavy rains.
- Santa Ana winds: These are hot, strong winds that blow from the eastern mountains and deserts towards coastal southern California, usually in spring and fall. They are caused by air pressure building up between mountain ranges. As the air moves down to lower elevations, it heats up and becomes very dry. These winds can be as strong as a hurricane and make wildfires spread very quickly.
- Tule fog: This is a very thick ground fog that forms in the San Joaquin Valley and Sacramento Valley parts of the California Central Valley. It usually happens in late fall, winter, and early spring after the first big rain. It's named after the tule grass in the area. Tule fog can make it almost impossible to see, leading to many traffic accidents.
Images for kids
-
Köppen climate types of California, showing different climate zones.
-
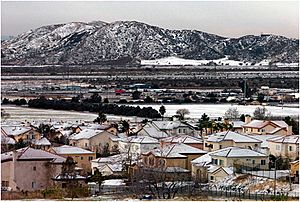
Snow in the mountains of Southern California
-
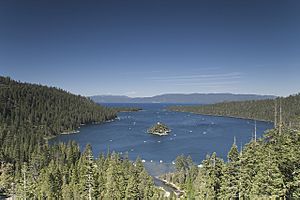
Summer in the Sierra Nevada at Lake Tahoe
-
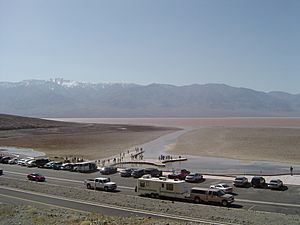
Heavy rain in 2005 created a temporary lake in the Badwater Basin of Death Valley.
See also
In Spanish: Clima de California para niños