
Yuma County, Arizona facts for kids
Quick facts for kids
Yuma County
|
|||
|---|---|---|---|
      .jpg)  Clockwise from top: Old Yuma City Hall, Ocean to Ocean Bridge, Kofa Mountains, Downtown Yuma, Yuma County administration building, McPhaul Suspension Bridge, Yuma County Courthouse and the Sonoran Desert near Yuma.
|
|||
|
|||

Location within the U.S. state of Arizona
|
|||
 Arizona's location within the U.S. |
|||
| Country | |||
| State | |||
| Founded | November 9, 1864 | ||
| Named for | Yuma (Quechan) people | ||
| Seat | Yuma | ||
| Largest city | Yuma | ||
| Area | |||
| • Total | 5,519 sq mi (14,290 km2) | ||
| • Land | 5,514 sq mi (14,280 km2) | ||
| • Water | 5.1 sq mi (13 km2) 0.1% | ||
| Population
(2020)
|
|||
| • Total | 203,881 | ||
| • Estimate
(2023)
|
213,221 |
||
| • Density | 36.942/sq mi (14.2633/km2) | ||
| Time zone | UTC−7 (Mountain) | ||
| Congressional districts | 7th, 9th | ||


Yuma County is a place in the southwestern part of Arizona, a state in the USA. In 2020, about 203,881 people lived here. The main city, or county seat, is Yuma.
Yuma County is part of the larger Yuma city area. It shares borders with three other places: Sonora, a state in Mexico, to the south. To the west, across the Colorado River, it borders California in the USA and Baja California, another state in Mexico.
In 2020, about 63.8% of the people in Yuma County were of Hispanic or Latino background. This makes it Arizona's largest county with a majority Hispanic population.
Contents
History of Yuma County
For thousands of years, Native American groups lived in this area. Later, the Spanish Empire took control during the colonial period. In the 1800s, it was part of independent Mexico. Then, after the Mexican–American War and the Gadsden Purchase, it became part of the United States.
Yuma County was one of the first four counties created in Arizona. This happened when the 1st Arizona Territorial Legislature met. The county's original borders stayed the same until 1982. That's when La Paz County was formed from its northern half.
The first county seat was a city called La Paz. In 1871, the county seat moved to Arizona City. This city was later renamed Yuma in 1873.
Economy and Agriculture
Yuma County is a very important farming area. It grows more crops by value than any other county in Arizona each year. It leads the state in growing vegetables, melons, and potatoes, bringing in over $782 million. It also leads in fruits, tree nuts, and berries, earning over $62 million.
Overall, Yuma County is the second-biggest farming county in Arizona, after Maricopa County. It produces over $1.1 billion in agricultural products each year. It's also a top producer of organic crops.
Almost all the dates grown in Arizona come from Yuma County. Farmers here grow about 10 million pounds of dates, worth $35 million every year. It's also the second-largest producer of citrus fruits, like grapefruit, limes, and oranges. However, it grows far more lemons than any other county. Some olives, clingstone peaches, and plums are also grown here. Yuma County produces almost all the vegetable seeds grown in the state.
The average age of farmers in Yuma County is 56.6 years, which is the lowest in Arizona.
Winter Farming and Trade
During the winter farming season, from November to March, many workers from Mexico cross the border daily. They come to work in the fields in the United States. The farms here get their water from the Colorado River. This area provides a large amount of the leafy vegetables eaten in the US. The Yuma Lettuce Days festival celebrates Yuma's farming, and people can visit farms as part of agritourism.
In 2017, Yuma County produced vegetables worth over $782 million. This made it the top vegetable producer in Arizona and third in the entire country. Fruits brought in over $62 million, also first in the state.
Jojoba (Simmondsia chinensis) is a valuable native plant grown here. It has also been introduced to farms in other countries.
Future of Farming Jobs
Leaders in Yuma County know that their economy is closely linked to the Mexican states across the border. Both sides work together on trade and business. For example, there are car factories in Ciudad Juárez, Mexico, and aerospace factories in Mexicali, Mexico. On the US side, there are many stores, warehouses, and trucking companies.
The Greater Yuma Economic Development Corp expects that many farming jobs in the county will soon start using robots.
Geography of Yuma County
Yuma County covers about 5,519 square miles. Most of this area, about 5,514 square miles, is land. Only a small part, about 5.1 square miles, is water.
The lowest point in Arizona is in Yuma County. It's on the Colorado River in San Luis, where the river flows out of Arizona into Mexico.
Yuma County is in the western part of the Sonoran Desert. This desert stretches through the Mexican state of Sonora. West of the county, across the Colorado River, is the Colorado Desert. This is another part of the Sonoran Desert. To the north, Yuma County meets the southeastern Mojave Desert.
Important mountains in Yuma County include the Gila Mountains and the Tule Mountains.
Neighboring Areas
- La Paz County – north
- Maricopa County – east
- Pima County – southeast
- Sonora, Mexico – south
- Baja California, Mexico – southwest
- Imperial County, California – west
Main Roads
 Interstate 8
 Historic U.S. Route 80
 U.S. Route 95
 Arizona State Route 195
Protected Natural Areas
- Cabeza Prieta National Wildlife Refuge (part)
- Imperial National Wildlife Refuge (part)
- Kofa National Wildlife Refuge (part)
Climate in Yuma County
| Climate data for Yuma, Arizona (Yuma Int'l), 1981–2010 normals, extremes 1878–present | |||||||||||||
|---|---|---|---|---|---|---|---|---|---|---|---|---|---|
| Month | Jan | Feb | Mar | Apr | May | Jun | Jul | Aug | Sep | Oct | Nov | Dec | Year |
| Record high °F (°C) | 88 (31) |
97 (36) |
102 (39) |
107 (42) |
120 (49) |
122 (50) |
124 (51) |
120 (49) |
123 (51) |
112 (44) |
98 (37) |
91 (33) |
124 (51) |
| Mean maximum °F (°C) | 79.4 (26.3) |
85.0 (29.4) |
92.9 (33.8) |
100.0 (37.8) |
106.8 (41.6) |
112.6 (44.8) |
114.7 (45.9) |
114.3 (45.7) |
110.8 (43.8) |
102.1 (38.9) |
89.1 (31.7) |
77.8 (25.4) |
116.2 (46.8) |
| Mean daily maximum °F (°C) | 69.6 (20.9) |
73.8 (23.2) |
79.9 (26.6) |
86.4 (30.2) |
95.3 (35.2) |
103.5 (39.7) |
106.8 (41.6) |
106.2 (41.2) |
101.3 (38.5) |
89.9 (32.2) |
77.5 (25.3) |
68.3 (20.2) |
88.2 (31.2) |
| Mean daily minimum °F (°C) | 47.6 (8.7) |
50.1 (10.1) |
54.4 (12.4) |
59.6 (15.3) |
67.3 (19.6) |
74.6 (23.7) |
82.1 (27.8) |
82.3 (27.9) |
76.5 (24.7) |
65.0 (18.3) |
53.9 (12.2) |
46.6 (8.1) |
63.3 (17.4) |
| Mean minimum °F (°C) | 37.3 (2.9) |
39.7 (4.3) |
43.9 (6.6) |
49.1 (9.5) |
56.4 (13.6) |
64.3 (17.9) |
74.1 (23.4) |
73.6 (23.1) |
65.3 (18.5) |
54.2 (12.3) |
43.1 (6.2) |
36.4 (2.4) |
34.6 (1.4) |
| Record low °F (°C) | 22 (−6) |
25 (−4) |
31 (−1) |
38 (3) |
39 (4) |
50 (10) |
61 (16) |
58 (14) |
50 (10) |
35 (2) |
29 (−2) |
22 (−6) |
22 (−6) |
| Average precipitation inches (mm) | 0.36 (9.1) |
0.33 (8.4) |
0.34 (8.6) |
0.12 (3.0) |
0.03 (0.76) |
0.01 (0.25) |
0.26 (6.6) |
0.52 (13) |
0.53 (13) |
0.21 (5.3) |
0.20 (5.1) |
0.45 (11) |
3.36 (85) |
| Average precipitation days (≥ 0.01 in) | 2.3 | 2.0 | 1.8 | .8 | .4 | .2 | .9 | 2.3 | 1.2 | 1.1 | 1.0 | 2.1 | 16.2 |
| Mean monthly sunshine hours | 268.4 | 270.8 | 335.5 | 365.5 | 407.4 | 415.4 | 392.6 | 375.6 | 341.7 | 319.6 | 270.1 | 252.7 | 4,015.3 |
| Percent possible sunshine | 84 | 88 | 90 | 94 | 95 | 97 | 90 | 91 | 92 | 91 | 86 | 81 | 90 |
| Source: NOAA | |||||||||||||
Population and People
| Historical population | |||
|---|---|---|---|
| Census | Pop. | %± | |
| 1870 | 1,621 | — | |
| 1880 | 3,215 | 98.3% | |
| 1890 | 2,671 | −16.9% | |
| 1900 | 4,145 | 55.2% | |
| 1910 | 7,733 | 86.6% | |
| 1920 | 14,904 | 92.7% | |
| 1930 | 17,816 | 19.5% | |
| 1940 | 19,326 | 8.5% | |
| 1950 | 28,006 | 44.9% | |
| 1960 | 46,235 | 65.1% | |
| 1970 | 60,827 | 31.6% | |
| 1980 | 90,554 | 48.9% | |
| 1990 | 106,895 | 18.0% | |
| 2000 | 160,026 | 49.7% | |
| 2010 | 195,751 | 22.3% | |
| 2020 | 203,881 | 4.2% | |
| 2023 (est.) | 213,221 | 8.9% | |
| U.S. Decennial Census 1790–1960 1900–1990 1990–2000 2010–2020 |
|||
In 2010, there were 195,751 people living in Yuma County. The population density was about 35.5 people per square mile.
Most people in the county were White (70.4%). About 20.8% were from other races, and 3.8% were from two or more races. People of Hispanic or Latino origin made up 59.7% of the population.
The average age of people in Yuma County was 33.8 years. The median income for a household was $40,340. About 20.9% of the population lived below the poverty line.
Cities, Towns, and Communities

Cities
Town
Census-Designated Places (CDPs)
These are areas that are like towns but are not officially incorporated as cities or towns.
Other Unincorporated Communities
These are small communities that are not officially part of a city or town.
Ghost Towns
These are towns that used to exist but are now abandoned.
Native American Reservations
Population Ranking of Communities
This table shows how many people lived in the cities, towns, and CDPs in Yuma County in 2010.
| Rank | City/Town/etc. | Population (2010 Census) | Municipal type | Incorporated |
|---|---|---|---|---|
| 1 | † Yuma | 93,064 | City | 1914 |
| 2 | Fortuna Foothills | 26,265 | CDP | |
| 3 | San Luis | 25,505 | City | 1979 |
| 4 | Somerton | 14,287 | City | 1918 |
| 5 | Avenue B and C | 4,176 | CDP | |
| 6 | Wellton | 2,882 | Town | 1970 |
| 7 | Donovan Estates | 1,508 | CDP | |
| 8 | Martinez Lake | 798 | CDP | |
| 9 | Gadsden | 678 | CDP | |
| 10 | Rancho Mesa Verde | 625 | CDP | |
| 11 | Tacna | 602 | CDP | |
| 12 | Orange Grove Mobile Manor | 594 | CDP | |
| 13 | El Prado Estates | 504 | CDP | |
| 14 | Dateland | 416 | CDP | |
| 15 | Wall Lane | 415 | CDP | |
| 16 | Drysdale | 272 | CDP | |
| 17 | Wellton Hills | 258 | CDP | |
| 18 | Padre Ranchitos | 171 | CDP | |
| 19 | Buckshot | 153 | CDP | |
| 20 | Aztec | 47 | CDP | |
| 21 | Yuma Proving Ground | 0 | CDP |
Images for kids
-

Old Yuma City Hall
-
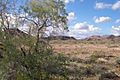
A desert plant found in the region
-
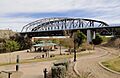
Ocean to Ocean Bridge in Yuma
-
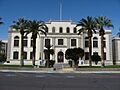
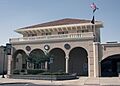
Yuma County Courthouse
-
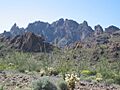
The Kofa Mountains
-
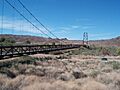
McPhaul Suspension Bridge
-
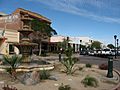
Downtown Yuma
-
Yuma County administration building
See also
 In Spanish: Condado de Yuma (Arizona) para niños
