
Maricopa County, Arizona facts for kids
Quick facts for kids
Maricopa County
|
|||
|---|---|---|---|

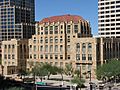
The Maricopa County Courthouse and Old Phoenix City Hall, also known as the County-City Administration Building, in 2013
|
|||
|
|||

Location within the U.S. state of Arizona
|
|||
 Arizona's location within the U.S. |
|||
| Country | |||
| State | |||
| Founded | February 14, 1871 | ||
| Named for | Maricopa people | ||
| Seat | Phoenix | ||
| Largest city | Phoenix | ||
| Area | |||
| • Total | 9,224 sq mi (23,890 km2) | ||
| • Land | 9,200 sq mi (24,000 km2) | ||
| • Water | 24 sq mi (60 km2) 0.3% | ||
| Population
(2020)
|
|||
| • Total | 4,420,568 | ||
| • Estimate
(2023)
|
4,585,871 |
||
| • Density | 479.246/sq mi (185.038/km2) | ||
| Time zone | UTC−7 (Mountain) | ||
| Congressional districts | 1st, 2nd, 3rd, 4th, 5th, 7th, 8th, 9th | ||


Maricopa County is a large county in the middle of Arizona. It was named after the Maricopa people.
In 2020, over 4.4 million people lived here. This is about 62% of everyone in Arizona! It makes Maricopa County the fourth most populated county in the whole United States.
The main city and county seat is Phoenix. Phoenix is also the capital of Arizona. It is the fifth largest city in the United States.
Maricopa County is the center of the Phoenix–Mesa–Chandler Metropolitan Area. This big area includes many cities and towns. Five Indian reservations are also in the county. The biggest ones are the Salt River Pima–Maricopa Indian Community and the Gila River Indian Community.
Contents
About the Land and Nature
Maricopa County is very large. It covers about 9,224 square miles. Only a small part (0.3%) is water. The land area is bigger than four other U.S. states! From west to east, it stretches 132 miles. From north to south, it is 103 miles wide.
It is the biggest county in the United States that has a state capital city.
Neighboring Counties
Maricopa County shares borders with these other counties:
- La Paz County (to the west)
- Yuma County (to the west)
- Pima County (to the south)
- Pinal County (to the southeast and south)
- Gila County (to the east)
- Yavapai County (to the north)
Special Protected Areas
Parts of these national protected areas are in Maricopa County:
- Sonoran Desert National Monument
- Tonto National Forest
County Parks and Preserves
Maricopa County has 14 regional parks for people to enjoy:
- Adobe Mountain Desert Park
- Chaparral Lake
- Estrella Mountain Regional Park
- Hassayampa River Preserve
- Indian Mesa
- Lake Pleasant Regional Park
- Litchfield Park, Arizona
- Manistee Ranch
- McCormick-Stillman Railroad Park
- Papago Park
- Phoenix Mountains Preserve
- Sahuaro Ranch
- San Tan Mountain Regional Park
- White Tank Mountain Regional Park
There are also at least 21 other protected areas, like:
- Big Horn Mountains Wilderness
- Daisy Mountain Preserve
- Deer Valley Petroglyph Preserve
- Eagletail Mountains Wilderness
- Harquahala Mountains
- Hells Canyon Wilderness (Arizona)
- Hummingbird Springs Wilderness
- Mesa Grande
- Mummy Mountain (Arizona)
- National Memorial Cemetery of Arizona
- Painted Rock Petroglyph Site
- Sierra Estrella
- Signal Mountain Wilderness
- Sonoran Desert National Monument
- Superstition Mountains
- Table Top Mountain (Arizona)
- Tonto National Forest
- Wabayuma Peak
- White Tank Mountain Regional Park
- Woolsey Peak
Plants and Animals
Scientists have studied the plants growing along the Salt River and other rivers in the Phoenix area. They looked at all the different types of plants there.
In 2022, health officials found Dengue virus in mosquitoes in Maricopa County. This led to the first local case of dengue fever in Arizona. Before this, dengue cases were only from people who had traveled.
People and Population


| Historical population | |||
|---|---|---|---|
| Census | Pop. | %± | |
| 1880 | 5,689 | — | |
| 1890 | 10,986 | 93.1% | |
| 1900 | 20,457 | 86.2% | |
| 1910 | 34,488 | 68.6% | |
| 1920 | 89,576 | 159.7% | |
| 1930 | 150,970 | 68.5% | |
| 1940 | 186,193 | 23.3% | |
| 1950 | 331,770 | 78.2% | |
| 1960 | 663,510 | 100.0% | |
| 1970 | 971,228 | 46.4% | |
| 1980 | 1,509,175 | 55.4% | |
| 1990 | 2,122,101 | 40.6% | |
| 2000 | 3,072,149 | 44.8% | |
| 2010 | 3,817,117 | 24.2% | |
| 2020 | 4,420,568 | 15.8% | |
| 2023 (est.) | 4,585,871 | 20.1% | |
| U.S. Decennial Census 1790–1960 1900–1990 1990–2000 2010–2020 |
|||
Maricopa County has grown a lot over the years. In 1880, fewer than 6,000 people lived here. By 2020, the population was over 4.4 million!
Different Backgrounds
People from many different backgrounds live in Maricopa County. In 2020, about 59.8% of people were White. About 30.6% were Hispanic or Latino. Other groups include Black or African American (5.8%), Asian (4.6%), and Native American (2.3%). Many people also identify as Mixed Race.
In 2010, most people (73.7%) spoke only English at home. About 20.3% spoke Spanish. Other languages spoken include Chinese, Vietnamese, and Tagalog.
Religions in the County
Many different religions are practiced in Maricopa County. In 2010, the largest group was Catholics. There were over 500,000 Catholics with many churches.
Other large religious groups include:
- LDS Mormons
- Non-denominational Christians
- Assembly of God Pentecostals
- Southern Baptists
- Christian churches and churches of Christ Christians
- Evangelical Lutherans
- UMC Methodists
- Missouri Synod Lutherans
- Presbyterians
Learning and Schools
The Maricopa County Library District runs the public libraries in the county. The Maricopa County School Superintendent helps manage the public schools. This person is elected by the people every four years.
Schools for Kids
Many school districts serve the children of Maricopa County. These include:
- Unified School Districts (meaning they have both elementary and high schools):
* Cave Creek Unified School District * Chandler Unified School District * Deer Valley Unified District * Dysart Unified School District * Fountain Hills Unified School District * Gila Bend Unified School District * Gilbert Unified School District * Higley Unified School District * Mesa Unified School District * Nadaburg Unified School District * Paradise Valley Unified School District * Peoria Unified School District * Queen Creek Unified School District * Saddle Mountain Unified School District * Scottsdale Unified School District * Wickenburg Unified School District
- High School Districts (only for high school students):
* Agua Fria Union High School District * Buckeye Union High School District * Glendale Union High School District * Phoenix Union High School District * Tempe Union High School District * Tolleson Union High School District
- Elementary School Districts (for younger students):
* Aguila Elementary School District * Alhambra Elementary School District * Arlington Elementary School District * Avondale Elementary School District * Balsz Elementary School District * Buckeye Elementary School District * Cartwright Elementary School District * Creighton Elementary School District * Fowler Elementary School District * Glendale Elementary School District * Isaac Elementary School District * Kyrene Elementary School District * Laveen Elementary School District * Liberty Elementary School District * Litchfield Elementary School District * Littleton Elementary School District * Madison Elementary School District * Mobile Elementary School District * Morristown Elementary School District * Murphy Elementary School District * Osborn Elementary School District * Palo Verde Elementary School District * Paloma School District * Pendergast Elementary School District * Phoenix Elementary School District * Riverside Elementary School District * Roosevelt Elementary School District * Sentinel Elementary School District * Tempe School District * Tolleson Elementary School District * Union Elementary School District * Washington Elementary School District * Wilson Elementary School District
The Phoenix Day School for the Deaf is a special school run by the state.
Getting Around
Maricopa County has many ways to travel, including major roads, airports, and trains.
Main Roads
Many important highways run through the county:
 Interstate 8
 Interstate 10
 Interstate 17
 U.S. Route 60
 Historic U.S. Route 80
 U.S. Route 93
 Loop 101
 Loop 202
 Loop 303
 State Route 24
 State Route 51
 State Route 71
 State Route 74
 State Route 85
 State Route 87
 State Route 143
 State Route 347
Airports
The main airport is Phoenix Sky Harbor International Airport (PHX). Many other airports are also in the county:
- Phoenix-Mesa Gateway Airport in Mesa (AZA)
- Scottsdale Municipal Airport in Scottsdale (SCF)
- Deer Valley Airport in Deer Valley Village in Phoenix (DVT)
- Chandler Municipal Airport in Chandler (CHD)
- Phoenix Goodyear Airport in Goodyear (GYR)
- Glendale Municipal Airport in Glendale (GEU)
- Buckeye Municipal Airport in Buckeye (BXK)
- Falcon Field in Mesa (MSC)
- Gila Bend Municipal Airport in Gila Bend (E63)
- Wickenburg Municipal Airport in Wickenburg (E25)
Train Travel
For moving goods, the Union Pacific Railroad and Burlington Northern Santa Fe Railroad use tracks in the county. For people, the Phoenix area has a light rail system. This is a train that carries passengers around the city.
There is no other passenger train service directly in Phoenix. The closest Amtrak stop is in Maricopa, a town in the next county over.
Cities and Towns
Maricopa County has many different communities.
Cities
- Apache Junction (mostly in Pinal County)
- Avondale
- Buckeye
- Chandler
- El Mirage
- Glendale
- Goodyear
- Litchfield Park
- Mesa
- Peoria (partly in Yavapai County)
- Phoenix (county seat)
- Scottsdale
- Surprise
- Tempe
- Tolleson
Towns
- Carefree
- Cave Creek
- Fountain Hills
- Gila Bend
- Gilbert
- Guadalupe
- Paradise Valley
- Queen Creek (partly in Pinal County)
- Wickenburg (partly in Yavapai County)
- Youngtown
Other Communities
Some areas are called "census-designated places" (CDPs). These are communities that are not officially cities or towns, but the census bureau counts their population.
There are also unincorporated communities, which means they don't have their own local government.
Some places are now "ghost towns," meaning people no longer live there.
- Agua Caliente
- Alma
- Angel Camp
- Marinette
- Vulture City
Native American Communities
These Native American communities are located in Maricopa County:
- Fort McDowell Yavapai Nation
- Gila River Indian Community
- Salt River Pima–Maricopa Indian Community
- Tohono O'odham Indian Reservation
Weather in Maricopa County
|
||||||||||||||||||||||||||||||||||||||||||||||||||||||||||||||||||||||||||||||||||||||||||||||||
Maricopa County has a desert climate. This means it gets very hot in the summer and has mild winters. There isn't much rain throughout the year.
Jobs and Economy
In 2019, many large companies and organizations were major employers in Maricopa County. This means they provided many jobs for people living there.
The top employers included:
- Banner Health (a healthcare company)
- The State of Arizona government
- Walmart (a large retail store)
- Frys Food Stores (a grocery store chain)
- Wells Fargo (a bank)
- Maricopa County government
- City of Phoenix government
- Intel Corporation (a technology company)
- Arizona State University (a large university)
- HonorHealth (another healthcare company)
What Kinds of Jobs are There?
Many different types of jobs are found in Maricopa County. In 2019, the largest job sectors were:
- Health care and social assistance: This includes doctors, nurses, and people who help others.
- Retail trade: Jobs in stores where you buy things.
- Administrative and support services: Office jobs and support roles.
- Finance and insurance: Jobs in banks and insurance companies.
- Accommodation and food services: Jobs in hotels and restaurants.
- Professional, scientific, and technical services: Jobs for engineers, scientists, and other experts.
- Construction: Building homes and other structures.
- Real estate and rental and leasing: Jobs related to buying, selling, or renting properties.
Farming in Maricopa County
Even though it's a desert, Maricopa County grows a lot of food! It produces more of certain vegetables than anywhere else in Arizona, like:
- cabbage
- collards
- mustard greens
- eggplant
- tomato (grown in greenhouses)
The county also grows a lot of broccoli, cauliflower, and spinach. It's a top producer of parsley and other fresh herbs. Some melon, okra, and bell pepper are also grown here.
Maricopa County is known for its fruits, especially:
Small amounts of figs, grapes, pears, and plums are also grown. The county also harvests berries like boysenberry and elderberry. A large part of the vegetable seeds grown in Arizona come from Maricopa County.
Images for kids
-
The Maricopa County Courthouse and Old Phoenix City Hall, also known as the County-City Administration Building, in 2013
See also
 In Spanish: Condado de Maricopa para niños
