2000 United States census facts for kids
Quick facts for kids Twenty-second census of the United States |
|
|---|---|

U.S. Census Bureau seal
|
|

2000 U.S. census logo
|
|
| General information | |
| Country | United States |
| Date taken | April 1, 2000 |
| Total population | 281,421,906 |
| Percent change | |
| Most populous state | California (33,871,648) |
| Least populous state | Wyoming (493,782) |
The 2000 United States census, conducted by the Census Bureau, determined the resident population of the United States on April 1, 2000, to be 281,421,906, an increase of 13.2 percent over the 248,709,873 people enumerated during the 1990 census. This was the twenty-second federal census and was at the time the largest civilly administered peacetime effort in the United States.
Approximately 16 percent of households received a "long form" of the 2000 census, which contained over 100 questions. Full documentation on the 2000 census, including census forms and a procedural history, is available from the Integrated Public Use Microdata Series.
This was the first census in which a state—California—recorded a population of over 30 million, as well as the first in which two states—California and Texas—recorded populations of more than 20 million.
Contents
Data availability
Microdata from the 2000 census is freely available through the Integrated Public Use Microdata Series. Aggregate data for small areas, together with electronic boundary files, can be downloaded from the National Historical Geographic Information System. Personally identifiable information will be available in 2072.
State rankings
| Rank | State | Population as of 2000 census |
Population as of 1990 census |
Change | Percent change |
|---|---|---|---|---|---|
| 1 | 33,871,648 | 29,760,021 | |||
| 2 | 20,851,820 | 16,986,510 | |||
| 3 | 18,976,457 | 17,990,455 | |||
| 4 | 15,982,378 | 12,937,926 | |||
| 5 | 12,419,293 | 11,430,602 | |||
| 6 | 12,281,054 | 11,881,643 | |||
| 7 | 11,353,140 | 10,847,115 | |||
| 8 | 9,938,444 | 9,295,297 | |||
| 9 | 8,414,350 | 7,730,188 | |||
| 10 | 8,186,453 | 6,478,216 | |||
| 11 | 8,049,313 | 6,628,637 | |||
| 12 | 7,078,515 | 6,187,358 | |||
| 13 | 6,349,097 | 6,016,425 | |||
| 14 | 6,080,485 | 5,544,159 | |||
| 15 | 5,894,121 | 4,866,692 | |||
| 16 | 5,689,283 | 4,877,185 | |||
| 17 | 5,595,211 | 5,117,073 | |||
| 18 | 5,363,675 | 4,891,769 | |||
| 19 | 5,296,486 | 4,781,468 | |||
| 20 | 5,130,632 | 3,665,228 | |||
| 21 | 4,919,479 | 4,375,099 | |||
| 22 | 4,468,976 | 4,219,973 | |||
| 23 | 4,447,100 | 4,040,587 | |||
| 24 | 4,301,261 | 3,294,394 | |||
| 25 | 4,041,769 | 3,685,296 | |||
| 26 | 4,012,012 | 3,486,703 | |||
| 27 | 3,450,654 | 3,145,585 | |||
| 28 | 3,421,399 | 2,842,321 | |||
| 29 | 3,405,565 | 3,287,116 | |||
| 30 | 2,926,324 | 2,776,755 | |||
| 31 | 2,844,658 | 2,573,216 | |||
| 32 | 2,688,418 | 2,477,574 | |||
| 33 | 2,673,400 | 2,350,725 | |||
| 34 | 2,233,169 | 1,722,850 | |||
| 35 | 1,998,257 | 1,201,833 | |||
| 36 | 1,819,046 | 1,515,069 | |||
| 37 | 1,808,344 | 1,793,477 | |||
| 38 | 1,711,263 | 1,578,385 | |||
| 39 | 1,293,953 | 1,006,749 | |||
| 40 | 1,274,923 | 1,227,928 | |||
| 41 | 1,235,786 | 1,109,252 | |||
| 42 | 1,211,537 | 1,108,229 | |||
| 43 | 1,048,319 | 1,003,464 | |||
| 44 | 902,195 | 799,065 | |||
| 45 | 783,600 | 666,168 | |||
| 46 | 754,844 | 696,004 | |||
| 47 | 642,200 | 638,800 | |||
| 48 | 626,932 | 550,043 | |||
| 49 | 608,827 | 562,758 | |||
| – | 572,059 | 606,900 | |||
| 50 | 493,782 | 453,588 | |||
| 281,421,906 | 248,709,873 | 32,712,033 | 13.2% |
City rankings
Top 100
| Rank | City | State | Population | Region |
|---|---|---|---|---|
| 1 | New York | NY | 8,008,278 | Northeast |
| 2 | Los Angeles | CA | 3,694,820 | West |
| 3 | Chicago | IL | 2,896,016 | Midwest |
| 4 | Houston | TX | 1,953,631 | South |
| 5 | Philadelphia | PA | 1,517,550 | Northeast |
| 6 | Phoenix | AZ | 1,321,045 | West |
| 7 | San Diego | CA | 1,223,400 | West |
| 8 | Dallas | TX | 1,188,580 | South |
| 9 | San Antonio | TX | 1,144,646 | South |
| 10 | Detroit | MI | 951,270 | Midwest |
| 11 | San Jose | CA | 894,943 | West |
| 12 | Indianapolis | IN | 791,926 | Midwest |
| 13 | San Francisco | CA | 776,733 | West |
| 14 | Jacksonville | FL | 735,617 | South |
| 15 | Columbus | OH | 711,470 | Midwest |
| 16 | Austin | TX | 656,562 | South |
| 17 | Baltimore | MD | 651,154 | South |
| 18 | Memphis | TN | 650,100 | South |
| 19 | Milwaukee | WI | 596,974 | Midwest |
| 20 | Boston | MA | 589,141 | Northeast |
| 21 | Washington | DC | 572,059 | South |
| 22 | Nashville-Davidson | TN | 569,891 | South |
| 23 | El Paso | TX | 563,662 | South |
| 24 | Seattle | WA | 563,374 | West |
| 25 | Denver | CO | 554,636 | West |
| 26 | Charlotte | NC | 540,828 | South |
| 27 | Fort Worth | TX | 534,694 | South |
| 28 | Portland | OR | 529,121 | West |
| 29 | Oklahoma City | OK | 506,132 | South |
| 30 | Tucson | AZ | 486,699 | West |
| 31 | New Orleans | LA | 484,674 | South |
| 32 | Las Vegas | NV | 478,434 | West |
| 33 | Cleveland | OH | 478,403 | Midwest |
| 34 | Long Beach | CA | 461,522 | West |
| 35 | Albuquerque | NM | 448,607 | West |
| 36 | Kansas City | MO | 441,545 | Midwest |
| 37 | Fresno | CA | 427,652 | West |
| 38 | Virginia Beach | VA | 425,257 | South |
| 39 | San Juan | PR | 421,958 | |
| 40 | Atlanta | GA | 416,474 | South |
| 41 | Sacramento | CA | 407,018 | West |
| 42 | Oakland | CA | 399,484 | West |
| 43 | Mesa | AZ | 396,375 | West |
| 44 | Tulsa | OK | 393,049 | South |
| 45 | Omaha | NE | 390,007 | Midwest |
| 46 | Minneapolis | MN | 382,618 | Midwest |
| 47 | Honolulu | HI | 371,657 | West |
| 48 | Miami | FL | 362,470 | South |
| 49 | Colorado Springs | CO | 360,890 | West |
| 50 | St. Louis | MO | 348,189 | Midwest |
| 51 | Wichita | KS | 344,284 | Midwest |
| 52 | Santa Ana | CA | 337,977 | West |
| 53 | Pittsburgh | PA | 334,563 | Northeast |
| 54 | Arlington | TX | 332,969 | South |
| 55 | Cincinnati | OH | 331,285 | Midwest |
| 56 | Anaheim | CA | 328,014 | West |
| 57 | Toledo | OH | 313,619 | Midwest |
| 58 | Tampa | FL | 303,447 | South |
| 59 | Buffalo | NY | 292,648 | Northeast |
| 60 | St. Paul | MN | 287,151 | Midwest |
| 61 | Corpus Christi | TX | 277,454 | South |
| 62 | Aurora | CO | 276,393 | West |
| 63 | Raleigh | NC | 276,093 | South |
| 64 | Newark | NJ | 273,546 | Northeast |
| 65 | Lexington-Fayette | KY | 260,512 | South |
| 66 | Anchorage | AK | 260,283 | West |
| 67 | Louisville | KY | 256,231 | South |
| 68 | Riverside | CA | 255,166 | West |
| 69 | St. Petersburg | FL | 248,232 | South |
| 70 | Bakersfield | CA | 247,057 | West |
| 71 | Stockton | CA | 243,771 | West |
| 72 | Birmingham | AL | 242,820 | South |
| 73 | Jersey City | NJ | 240,055 | Northeast |
| 74 | Norfolk | VA | 234,403 | South |
| 75 | Baton Rouge | LA | 227,818 | South |
| 76 | Hialeah | FL | 226,419 | South |
| 77 | Lincoln | NE | 225,581 | Midwest |
| 78 | Greensboro | NC | 223,891 | South |
| 79 | Plano | TX | 222,030 | South |
| 80 | Rochester | NY | 219,773 | Northeast |
| 81 | Glendale | AZ | 218,812 | West |
| 82 | Akron | OH | 217,074 | Midwest |
| 83 | Garland | TX | 215,768 | South |
| 84 | Madison | WI | 208,054 | Midwest |
| 85 | Fort Wayne | IN | 205,727 | Midwest |
| 86 | Bayamon | PR | 203,499 | |
| 87 | Fremont | CA | 203,413 | West |
| 88 | Scottsdale | AZ | 202,705 | West |
| 89 | Montgomery | AL | 201,568 | South |
| 90 | Shreveport | LA | 200,145 | South |
| 91 | Augusta-Richmond County | GA | 199,775 | South |
| 92 | Lubbock | TX | 199,564 | South |
| 93 | Chesapeake | VA | 199,184 | South |
| 94 | Mobile | AL | 198,915 | South |
| 95 | Des Moines | IA | 198,682 | Midwest |
| 96 | Grand Rapids | MI | 197,800 | Midwest |
| 97 | Richmond | VA | 197,790 | South |
| 98 | Yonkers | NY | 196,086 | Northeast |
| 99 | Spokane | WA | 195,629 | West |
| 100 | Glendale | CA | 194,973 | West |
Population profile
The U.S. resident population includes the total number of people in the 50 states and the District of Columbia. The Bureau also enumerated the residents of the U.S. territory of Puerto Rico; its population was 3,808,610, an 8.1% increase over the number from a decade earlier.
In an introduction to a more detailed population profile (see references below), the Census Bureau highlighted the following facts about U.S. population dynamics:
- 75% of respondents said they were White or Caucasian and no other race;
- Hispanics accounted for 12.5% of the U.S. population, up from 9% in 1990;
- 12.4% (34.5 million Americans) were of German descent;
- 12.3% were of Black or African American descent;
- 3.6% of respondents were Asian;
- 2.4% (6.8 million Americans) of respondents were multiracial (2 or more races). The 2000 census was the first time survey options for multiracial Americans were provided.
- Between 1990 and 2000, the population aged 45 to 54 grew by 49% and those aged 85 and older grew 38%;
- Women outnumbered men two to one among those aged 85 and older;
- Almost one in five adults had some type of disability in 1997 and the likelihood of having a disability increased with age;
- Families (as opposed to men or women living alone) still dominated American households, but less so than they did thirty years ago;
- Since 1993, both families and non-families have seen median household incomes rise, with "households headed by a woman without a spouse present" growing the fastest;
- People in married-couple families had the lowest poverty rates;
- The poor of any age were more likely than others to lack health insurance coverage;
- The number of elementary and high school students in 2000 fell just short of the all-time high of 49 million reached in 1970;
- Improvements in educational attainment cross racial and ethnic lines; and
- The majority (51%) of U.S. households had access to computers; 42% had Internet access.
Changes in population
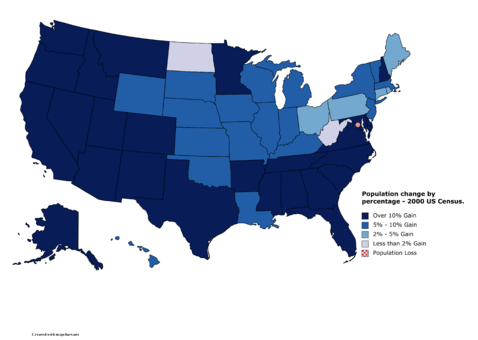
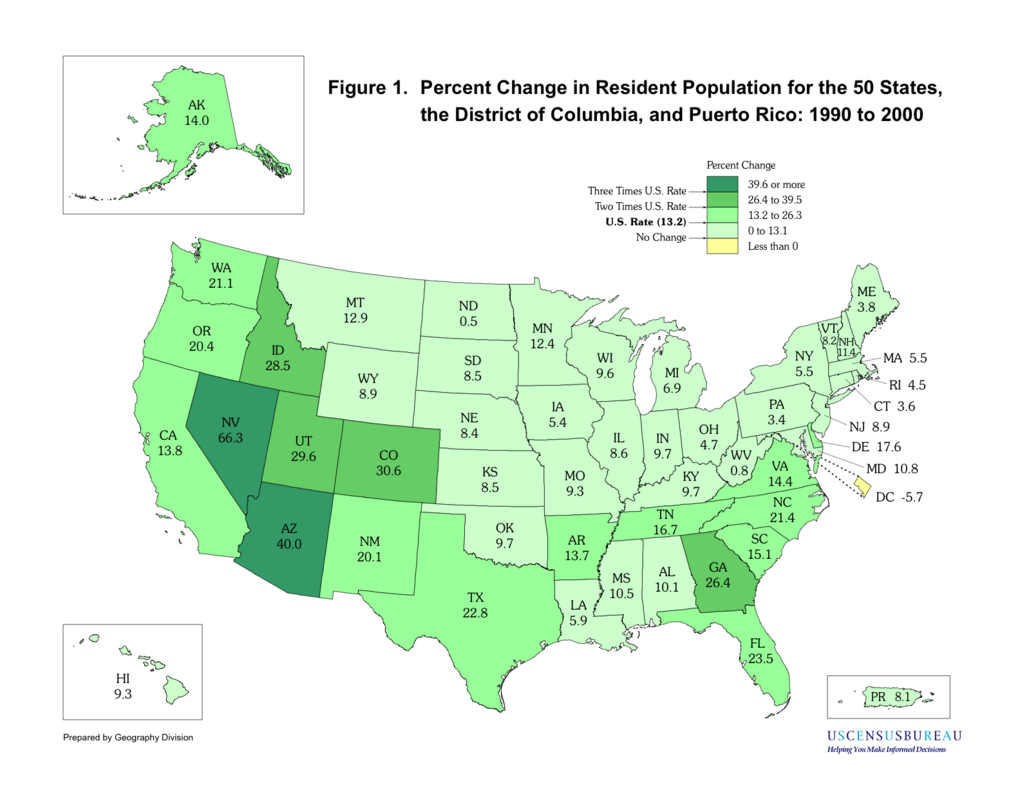
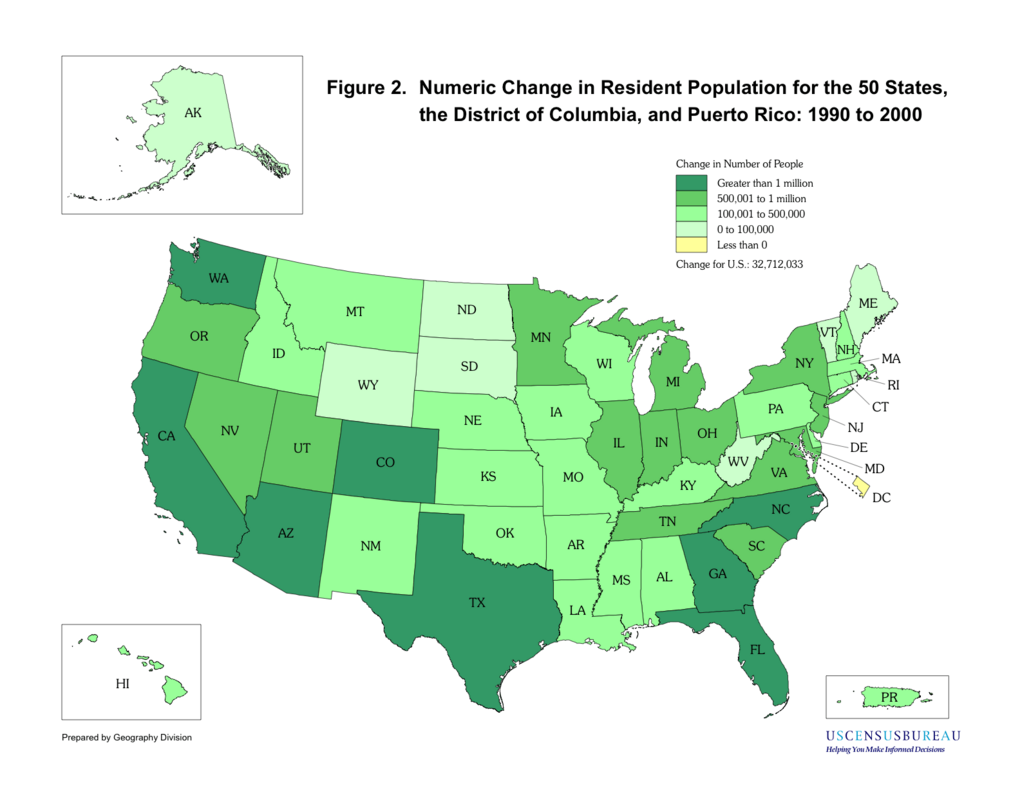
Regionally, the South and West experienced the bulk of the nation's population increase: 14,790,890 and 10,411,850, respectively. This meant that the mean center of U.S. population moved to Phelps County, Missouri. The Northeastern United States grew by 2,785,149; the Midwest by 4,724,144.
(maps not to scale)
Reapportionment
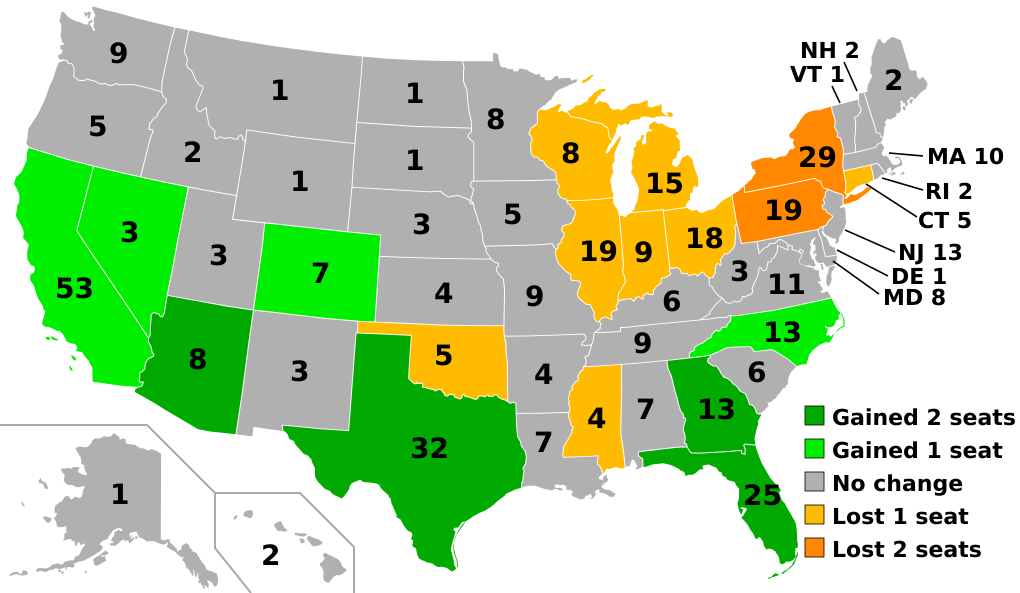
The results of the census are used to determine how many congressional districts each state is apportioned. Congress defines the formula, in accordance with Title 2 of the U.S. Code, to reapportion among the states the 435 seats in the United States House of Representatives. The apportionment population consists of the resident population of the fifty states, plus the overseas military and federal civilian employees and their dependents living with them who could be allocated to a state. Each member of the House represents a population of about 647,000. The populations of the District of Columbia and Puerto Rico are excluded from the apportionment population because they do not have voting seats in the U. S. House of Representatives.
Since the first census in 1790, the decennial count has been the basis for the United States representative form of government. Article I, Section II specifies that "The Number of Representatives shall not exceed one for every thirty Thousand, but each State shall have at Least one Representative." In 1790, each member of the House represented about 34,000 residents. Since then, the House more than quadrupled in size, and in 1911 the number of representatives was fixed at 435. Today, each member represents about 20 times as many constituents.
See also
 In Spanish: Censo de los Estados Unidos de 2000 para niños


