
Cantons of Costa Rica facts for kids

Costa Rica is a country in Central America. It's divided into seven main areas called provinces. These provinces are then split into smaller areas called cantons. There are 84 cantons in total. Each canton is further divided into even smaller areas called districts.
Cantons are special because they are the only areas in Costa Rica that have their own local government. This local government is called a municipality. Each municipality has a mayor and several representatives. These leaders are chosen by people voting in local elections every four years.
The first 14 cantons were created way back in 1848. Over time, more cantons have been added by splitting up the older ones. A law from 1969 says that a new canton can only be created if it has at least one percent of Costa Rica's total population. In 2022, Costa Rica had about 5,044,197 people. The newest canton, Puerto Jiménez, was created on June 21, 2022. It used to be part of the canton of Golfito.
The capital city, San José, is also the largest canton by population, with about 352,381 people. The smallest canton by population is Monteverde, with about 5,386 residents. When it comes to land size, San Carlos is the biggest, covering about 3,352 square kilometers (1,294 square miles). The smallest canton is Flores, which is only about 6.75 square kilometers (2.61 square miles).
How Cantons are Governed
Every canton in Costa Rica is managed by a local government unit called a Municipalidad. This word is similar to "municipality" in many other Spanish-speaking countries. The Municipalidad has two main parts:
- A municipal council (called Concejo Municipal).
- A leader called a mayor (alcalde for a man, alcaldesa for a woman). The role of mayor was created in 1998.
The mayor's main jobs are to work with the municipal council and other local groups. They also approve and carry out the decisions made by the municipal council. The number of people on the municipal council changes from one canton to another. These council members are also elected in local elections every four years. The person in charge of the council is called the municipal president.
The council's main job is to manage the canton at a local level. They are in charge of planning important policies and setting budgets. This includes things like planning for cities and farms, organizing cultural events, and looking after health care, education, and local businesses. The municipal president also creates special groups to work on specific issues in the canton.
What is a City in Costa Rica?
In Costa Rica, the title of "city" is mostly ceremonial. It's given to a district (or districts) that holds the main administrative center of a canton. This means it's where the local government offices are. It doesn't depend on how many people live there, how crowded it is, or how strong its economy is. This special title is also known as cabecera de cantón, which means "head city of the canton."
Cantons of Costa Rica
- Largest Cantons of Costa Rica by population
-
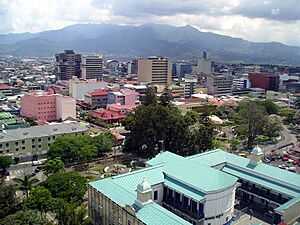
San José, Costa Rica's capital and largest canton by population
-
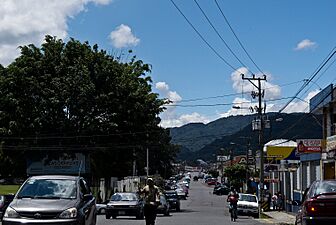
Alajuela, Costa Rica's second largest canton by population
-
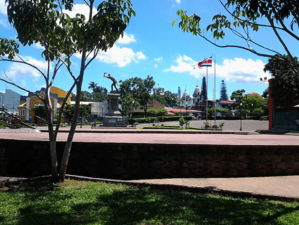
Desamparados, Costa Rica's third largest canton by population and a suburb of San Jose
-
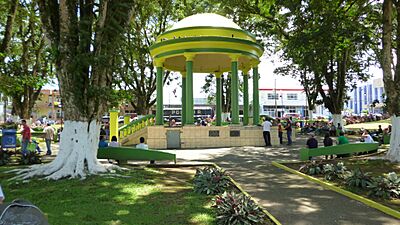
Pavilion of Ciudad Quesada, located in Costa Rica's fourth largest canton by population, San Carlos


Provincial Capital![]() National Capital and Provincial Capital
National Capital and Provincial Capital![]()
| Canton | City | Province | Population (2022) |
Land area (km2) | Population density (2022) | Created |
|---|---|---|---|---|---|---|
| San José |
San José | San José | 352,381 | 44.62 | 7,897.4/km2 | 1848 |
| Escazú | Escazú | San José | 71,500 | 34.53 | 2,070.7/km2 | 1848 |
| Desamparados | Desamparados | San José | 223,226 | 118.89 | 1,877.6/km2 | 1862 |
| Puriscal | Santiago | San José | 38,525 | 555.04 | 69.4/km2 | 1868 |
| Tarrazú | San Marcos | San José | 17,810 | 291.27 | 61.1/km2 | 1868 |
| Aserrí | Aserrí | San José | 59,588 | 168.26 | 354.1/km2 | 1882 |
| Mora | Colón | San José | 32,348 | 163.48 | 197.9/km2 | 1883 |
| Goicoechea | Guadalupe | San José | 132,104 | 31.7 | 4,167.3/km2 | 1891 |
| Santa Ana | Santa Ana | San José | 58,020 | 61.42 | 944.6/km2 | 1907 |
| Alajuelita | Alajuelita | San José | 81,012 | 21.47 | 3,773.3/km2 | 1909 |
| Vázquez de Coronado | San Isidro | San José | 67,078 | 223.93 | 299.5/km2 | 1910 |
| Acosta | San Ignacio | San José | 22,542 | 342.56 | 65.8/km2 | 1910 |
| Tibás | San Juan | San José | 74,592 | 8.27 | 9,019.6/km2 | 1914 |
| Moravia | San Vicente | San José | 59,546 | 28.82 | 2,066.1/km2 | 1914 |
| Montes de Oca | San Pedro | San José | 53,862 | 15.78 | 3,413.3/km2 | 1915 |
| Turrubares | San Pablo | San José | 6,173 | 416.25 | 14.8/km2 | 1920 |
| Dota | Santa María | San José | 9,364 | 404.44 | 23.2/km2 | 1925 |
| Curridabat | Curridabat | San José | 71,026 | 16.06 | 4,422.5/km2 | 1929 |
| Pérez Zeledón | San Isidro de El General | San José | 156,917 | 1,901.08 | 82.5/km2 | 1931 |
| León Cortés Castro | San Pablo | San José | 13,553 | 121.9 | 111.2/km2 | 1961 |
| Alajuela |
Alajuela | Alajuela | 322,143 | 391.61 | 822.6/km2 | 1848 |
| San Ramón | San Ramón | Alajuela | 93,264 | 1,021.75 | 91.3/km2 | 1856 |
| Grecia | Grecia | Alajuela | 76,226 | 142.47 | 535.0/km2 | 1848 |
| San Mateo | San Mateo | Alajuela | 6,952 | 125.03 | 55.6/km2 | 1868 |
| Atenas | Atenas | Alajuela | 30,407 | 126.32 | 240.7/km2 | 1868 |
| Naranjo | Naranjo | Alajuela | 46,647 | 127.03 | 367.2/km2 | 1886 |
| Palmares | Palmares | Alajuela | 39,148 | 38.94 | 1,005.3/km2 | 1888 |
| Poás | San Pedro | Alajuela | 36,207 | 74.48 | 486.1/km2 | 1901 |
| Orotina | Orotina | Alajuela | 24,217 | 145.11 | 166.9/km2 | 1908 |
| San Carlos | Quesada | Alajuela | 198,742 | 3,352.14 | 59.3/km2 | 1911 |
| Zarcero | Zarcero | Alajuela | 15,153 | 157.36 | 96.3/km2 | 1915 |
| Sarchí | Sarchí Norte | Alajuela | 21,562 | 136.77 | 157.7/km2 | 1949 |
| Upala | Upala | Alajuela | 57,361 | 1,592.68 | 36.0/km2 | 1970 |
| Los Chiles | Los Chiles | Alajuela | 34,701 | 1,332.71 | 26.0/km2 | 1970 |
| Guatuso | San Rafael | Alajuela | 18,316 | 752.83 | 24.3/km2 | 1970 |
| Río Cuarto | Río Cuarto | Alajuela | 14,418 | 254.9 | 56.6/km2 | 2017 |
| Cartago |
Cartago | Cartago | 165,417 | 278.66 | 593.6/km2 | 1848 |
| Paraíso | Paraíso | Cartago | 65,941 | 477 | 138.2/km2 | 1848 |
| La Unión | Tres Ríos | Cartago | 99,539 | 44.18 | 2,253.0/km2 | 1848 |
| Jiménez | Juan Viñas | Cartago | 18,710 | 250.07 | 74.8/km2 | 1903 |
| Turrialba | Turrialba | Cartago | 82,065 | 1,589.24 | 51.6/km2 | 1903 |
| Alvarado | Pacayas | Cartago | 17,134 | 79.19 | 216.4/km2 | 1908 |
| Oreamuno | San Rafael | Cartago | 48,911 | 202.89 | 241.1/km2 | 1914 |
| El Guarco | El Tejar | Cartago | 47,375 | 172 | 275.4/km2 | 1939 |
| Heredia |
Heredia | Heredia | 131,901 | 283.12 | 465.9/km2 | 1848 |
| Barva | Barva | Heredia | 47,699 | 56.02 | 851.5/km2 | 1848 |
| Santo Domingo | Santo Domingo | Heredia | 45,932 | 25.4 | 1,808.3/km2 | 1869 |
| Santa Bárbara | Santa Bárbara | Heredia | 39,133 | 52.1 | 751.1/km2 | 1882 |
| San Rafael | San Rafael | Heredia | 48,848 | 48.31 | 1,011.1/km2 | 1885 |
| San Isidro | San Isidro | Heredia | 22,806 | 26.67 | 855.1/km2 | 1905 |
| Belén | San Antonio | Heredia | 23,759 | 12.38 | 1,919.1/km2 | 1907 |
| Flores | San Joaquín | Heredia | 22,026 | 6.75 | 3,263.1/km2 | 1915 |
| San Pablo | San Pablo | Heredia | 29,860 | 8.34 | 3,580.3/km2 | 1961 |
| Sarapiquí | Puerto Viejo | Heredia | 67,153 | 2,144.22 | 31.3/km2 | 1970 |
| Liberia |
Liberia | Guanacaste | 80,130 | 1,442.17 | 55.6/km2 | 1848 |
| Nicoya | Nicoya | Guanacaste | 66,268 | 1,337.56 | 49.5/km2 | 1848 |
| Santa Cruz | Santa Cruz | Guanacaste | 72,366 | 1,320.8 | 54.8/km2 | 1848 |
| Bagaces | Bagaces | Guanacaste | 23,709 | 1,277.93 | 18.6/km2 | 1848 |
| Carrillo | Filadelfia | Guanacaste | 48,227 | 599.01 | 80.5/km2 | 1877 |
| Cañas | Cañas | Guanacaste | 31,738 | 687.04 | 46.2/km2 | 1878 |
| Abangares | Las Juntas | Guanacaste | 22,211 | 646.02 | 34.4/km2 | 1915 |
| Tilarán | Tilarán | Guanacaste | 21,232 | 669.24 | 31.7/km2 | 1923 |
| Nandayure | Carmona | Guanacaste | 11,874 | 568.14 | 20.9/km2 | 1961 |
| La Cruz | La Cruz | Guanacaste | 26,829 | 1,385.4 | 19.4/km2 | 1969 |
| Hojancha | Hojancha | Guanacaste | 8,224 | 262.99 | 31.3/km2 | 1971 |
| Puntarenas |
Puntarenas | Puntarenas | 141,697 | 1,816.86 | 78.0/km2 | 1862 |
| Esparza | Esparza (Espíritu Santo district) | Puntarenas | 34,808 | 217.23 | 160.2/km2 | 1848 |
| Buenos Aires | Buenos Aires | Puntarenas | 50,562 | 2,382.94 | 21.2/km2 | 1914 |
| Montes de Oro | Miramar | Puntarenas | 16,395 | 247.6 | 66.2/km2 | 1915 |
| Osa | Puerto Cortés | Puntarenas | 36,088 | 1,932.7 | 18.7/km2 | 1940 |
| Quepos | Quepos | Puntarenas | 32,416 | 557.85 | 58.1/km2 | 1948 |
| Golfito | Golfito | Puntarenas | 44,086 | 1,752.75 | 25.2/km2 | 1949 |
| Coto Brus | San Vito | Puntarenas | 46,351 | 944.22 | 49.1/km2 | 1965 |
| Parrita | Parrita | Puntarenas | 20,068 | 483.22 | 41.5/km2 | 1971 |
| Corredores | Ciudad Neily (Corredor district) | Puntarenas | 51,023 | 623.62 | 81.8/km2 | 1973 |
| Garabito | Jacó | Puntarenas | 26,672 | 316.01 | 84.4/km2 | 1980 |
| Monteverde | Monteverde | Puntarenas | 5,386 | 53.47 | 100.7/km2 | 2021 |
| Puerto Jiménez | Puerto Jiménez | Puntarenas | 10,644 | 720.43 | 14.8/km2 | 2022 |
| Limón |
Limón | Limón | 116,457 | 1,769.38 | 65.8/km2 | 1909 |
| Pococí | Guápiles | Limón | 146,320 | 2,188.17 | 66.9/km2 | 1911 |
| Siquirres | Siquirres | Limón | 63,765 | 855.14 | 74.6/km2 | 1969 |
| Talamanca | Bribrí (Bratsi district) | Limón | 48,906 | 2,792.23 | 17.5/km2 | 1911 |
| Matina | Matina | Limón | 45,329 | 770.4 | 58.8/km2 | 1969 |
| Guácimo | Guácimo | Limón | 49,606 | 801.56 | 61.9/km2 | 1971 |
| Costa Rica | 5,044,197 | 51,146.63 | 98.6/km2 |
See also
 In Spanish: Cantones de Costa Rica para niños
- Provinces of Costa Rica
- Districts of Costa Rica
