Demographics of Minneapolis facts for kids
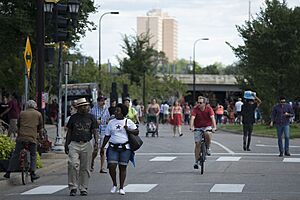
The demographics of Minneapolis is all about understanding the people who live in Minneapolis, Minnesota. This includes things like how many people live there, their ages, their backgrounds, and what languages they speak. Minneapolis is the biggest city in Minnesota and the main city of Hennepin County.
In 2020, about 429,606 people lived in Minneapolis. Most residents, around 58.1%, are non-Hispanic White. About 18.9% are African Americans, and 5.8% are Asian. Around 10% of the city's people are Hispanic or Latino.
Minneapolis has many people who have moved from other countries. These include communities from Somalia, Hmong, and Latin American countries. In 2021, about 14.8% of people in Minneapolis were born outside the United States.
The average age in the city is about 31.7 years old. The average money earned by a household in 2020 was $58,993. About 20.7% of the people lived below the poverty line, meaning they had very low incomes.
Many adults in Minneapolis have finished a good amount of school. About 87.9% of adults aged 25 and older have a high school degree. Nearly half of them have a college degree or even higher education.
Contents
How Many People Live in Minneapolis?
| Historical population | |||
|---|---|---|---|
| Census | Pop. | %± | |
| 1860 | 5,809 | — | |
| 1870 | 13,066 | 124.9% | |
| 1880 | 46,887 | 258.8% | |
| 1890 | 164,738 | 251.4% | |
| 1900 | 202,718 | 23.1% | |
| 1910 | 301,408 | 48.7% | |
| 1920 | 380,582 | 26.3% | |
| 1930 | 464,356 | 22.0% | |
| 1940 | 492,370 | 6.0% | |
| 1950 | 521,718 | 6.0% | |
| 1960 | 482,872 | −7.4% | |
| 1970 | 434,400 | −10.0% | |
| 1980 | 370,951 | −14.6% | |
| 1990 | 368,383 | −0.7% | |
| 2000 | 382,618 | 3.9% | |
| 2010 | 382,578 | 0.0% | |
| 2020 | 429,954 | 12.4% | |
| 2021 (est.) | 425,336 | 11.2% | |
| U.S. Decennial Census 2020 Census |
|||
Early Growth of Minneapolis
When Minneapolis was a young city, its population grew very quickly. This happened because of new factories, people moving in from other places, and its good location near the Mississippi River. This fast growth slowed down a bit in the first half of the 1900s. Even during tough times like the Great Depression, Minneapolis kept growing. By 1930, the population reached 464,356 people.
After World War II
After World War II, Minneapolis faced new challenges. The population reached its highest point at 521,718. Then, it slowly started to shrink. Many people moved to the areas outside the city, called suburbs. This was partly because of "white flight", where many white families moved away. It was also due to "urban decay", which means parts of the city became run-down. More people also owned cars, making it easier to live further from the city center. By 1980, the city had lost many residents, with the population dropping to 370,951.
Recent Population Changes
In the late 1900s and early 2000s, things started to change for Minneapolis. The city began to gain people again. Efforts to make downtown areas better, improved public transportation, and more young workers and immigrants helped with this growth. From 2000 to 2010, the population stayed about the same. But by 2020, it grew a lot, by 12.4%, reaching 429,954 residents. Downtown Minneapolis has also become popular again. Many new homes have been built there, and over 30,000 people now live downtown.
Age Groups in Minneapolis
In 2021, the population of Minneapolis had different age groups. There are more people in the 25-34 age group now compared to 2010. However, there are slightly fewer younger people.
- 5 to 14 years old: 10.9%
- 15 to 44 years old: 52.4%
- Under 18 years old: 19.7%
- 18 to 24 years old: 13.2%
- 60 years old and over: 14.9%
- 65 years old and over: 10.2%
- 75 years old and over: 3.5%
Different Backgrounds and Cultures
| 2021 American Community Survey of race and ethnicity in Minneapolis |
||||
|---|---|---|---|---|
| White | 61.1% | |||
| Black or African American | 16.4% | |||
| Hispanic or Latino (of any race) | 9.8% | |||
| Asian/Pacific Islander | 5.1% | |||
| American Indian | 0.6% | |||
| Other races | 0.7% | |||
| Two or more races | 6.3% | |||
Who Lives in Minneapolis Today?
According to the 2020 Census, the people in Minneapolis have many different backgrounds:
- 58.1% are non-Hispanic White.
- 18.9% are Black or African American.
- 10.4% are Hispanic or Latino.
- 5.8% are Asian or Native Hawaiian/Pacific Islander.
- 1.2% are American Indian.
- 0.5% are of some other background.
- 5.24% are of two or more backgrounds.
Among the younger population in the city, about 35% are non-Hispanic White, 32% are Black, and 17% are Hispanic.
History of Different Groups in Minneapolis
For a long time, until about 1950, most people in Minneapolis were white, around 99.0%.
Black residents started living in Minneapolis in the late 1800s, after the American Civil War. Northern cities were seen as safer from the racial issues in the South. Over time, many Black residents lived in public housing. After the 1960s, when many white families moved out, the Black population mostly settled on the north side of Minneapolis.
The Asian population in Minneapolis used to be very small, but it has grown to about 17,700 people recently. In the late 1800s, many Chinese workers came. Later, people from Hong Kong, Taiwan, Japan, and Korea moved to the city. After the Vietnam War, many people from Southeast Asia also came to Minneapolis.
Since then, the city has become much more diverse. People from countries like Mexico, Somalia, Ethiopia, Vietnam, Laos, and Cambodia have moved here. Minneapolis has one of the largest Somali communities in North America. About one-third of all people with Somali family history in the U.S. live in Minnesota. The number of Mexican people has also grown, especially in the South and Northeast parts of Minneapolis.
| Year | White | Black | Asian (incl. Pacific Is.) |
Native | Other race |
Two or more |
Hispanic or Latino | Non-Hispanic White |
|---|---|---|---|---|---|---|---|---|
| 1860 | 99.6% | 0.3% | ||||||
| 1870 | 99.2% | 0.8% | ||||||
| 1880 | 99.2% | 0.8% | ||||||
| 1890 | 99.2% | 0.8% | ||||||
| 1900 | 99.2% | 0.8% | ||||||
| 1910 | 99.1% | 0.9% | ||||||
| 1920 | 98.9% | 1.0% | 0.1% | |||||
| 1930 | 99.0% | 0.9% | 0.1% | |||||
| 1940 | 98.9% | 0.9% | 0.1% | |||||
| 1950 | 98.4% | 1.3% | 0.2% | 0.1% | ||||
| 1960 | 96.8% | 2.4% | 0.3% | 0.4% | 0.1% | |||
| 1970 | 93.6% | 4.4% | 0.4% | 1.3% | 0.3% | 0.9% | 92.8% | |
| 1980 | 87.3% | 7.7% | 1.1% | 2.4% | 1.5% | 1.3% | 86.7% | |
| 1990 | 78.4% | 13.0% | 4.3% | 3.3% | 0.9% | 2.1% | 77.5% | |
| 2000 | 65.1% | 18.0% | 6.1% | 2.2% | 4.1% | 4.4% | 7.6% | 62.5% |
| 2010 | 63.8% | 18.3% | 5.6% | 1.7% | 0.3% | 3.4% | 10.5% | 60.3% |
| 2020 | 59.5% | 18.9% | 5.8% | 1.2% | 0.5% | 5.2% | 10.4% | 58.0% |
| 2021 (est.) | 62.4% | 16.6% | 5.3% | 0.7% | 0.5% | 10.2% | 9.8% | 61.1% |
Languages Spoken in Minneapolis
Most people in Minneapolis speak English at home, about 78.8%. However, many people also speak other languages. About 8.4% of residents speak English "less than very well". Because of this, the city offers services in several languages.
The most common languages other than English are:
Other languages spoken by smaller groups include Oromo, Russian, Amharic, Chinese, and French.
The table below shows more details about languages spoken at home in Minneapolis, based on the 2000 Census.
| Language | Speakers | % |
|---|---|---|
| English | 288,930 | 80.94 |
| Spanish | 25,580 | 7.17 |
| Hmong | 9,665 | 2.71 |
| Cushite | 7,525 | 2.11 |
| French | 2,585 | 0.72 |
| Vietnamese | 2,465 | 0.69 |
| German | 1,675 | 0.47 |
| Arabic | 1,579 | 0.44 |
| Laotian | 1,504 | 0.42 |
| Amharic | 1,485 | 0.42 |
| Chinese | 1,220 | 0.34 |
| Russian | 975 | 0.27 |
| Japanese | 713 | 0.20 |
| Korean | 659 | 0.18 |
| Norwegian | 594 | 0.17 |
| Italian | 574 | 0.16 |
| Swedish | 540 | 0.15 |
| Polish | 520 | 0.15 |
| Mon-Khmer | 480 | 0.13 |
| Tagalog | 445 | 0.12 |
| Hindi | 425 | 0.12 |
| Swahili | 425 | 0.12 |
| Kru, Ibo, Yoruba | 405 | 0.11 |
| Ukrainian | 394 | 0.11 |
| Ojibwa | 379 | 0.11 |
| Serbo-Croatian | 354 | 0.10 |
| Tibetan | 309 | 0.09 |
| Mande | 285 | 0.08 |
| Lettish | 245 | 0.07 |
| Greek | 240 | 0.07 |
| Persian | 240 | 0.07 |
| Urdu | 235 | 0.07 |
| Finnish | 225 | 0.06 |
| Mandarin | 225 | 0.06 |
| Portuguese | 215 | 0.06 |
| Dakota | 204 | 0.06 |
| Telugu | 185 | 0.05 |
| Thai | 160 | 0.04 |
| Bengali | 140 | 0.04 |
| Hebrew | 124 | 0.03 |
| Turkish | 119 | 0.03 |
| Fulani | 105 | 0.03 |
| Dutch | 100 | 0.03 |
| Czech | 95 | 0.03 |
| Cantonese | 90 | 0.03 |
| Croatian | 85 | 0.02 |
| Gujarathi | 85 | 0.02 |
| Tamil | 85 | 0.02 |
| French Creole | 80 | 0.02 |
| Romanian | 80 | 0.02 |
| Bantu | 75 | 0.02 |
| Danish | 70 | 0.02 |
| Nepali | 70 | 0.02 |
| Bulgarian | 65 | 0.02 |
| Indonesian | 65 | 0.02 |
| Irish Gaelic | 65 | 0.02 |
| Nilotic | 55 | 0.02 |
| Other Indian | 50 | 0.01 |
| Serbian | 50 | 0.01 |
| Hungarian | 49 | 0.01 |
| Efik | 45 | 0.01 |
| Yiddish | 40 | 0.01 |
| Malayalam | 39 | 0.01 |
| Formosan | 35 | 0.01 |
| Marathi | 30 | 0.01 |
| Pashto | 30 | 0.01 |
| Afrikaans | 25 | 0.01 |
| Hocąk | 25 | 0.01 |
| Lithuanian | 20 | 0.01 |
| Total | 356,954 | 100 |
Homes and Families
In 2005-2007, there were about 155,155 homes in Minneapolis.
- 45.3% were family households, meaning people related by blood, marriage, or adoption lived together.
- 21.9% of these family households had children under 18.
- 29.1% were married couples.
- Some family households were led by a single parent (4.8% by a father, 11.4% by a mother).
- 54.7% were non-family households, where people living together were not related.
- 42.7% of these were people living alone.
- 7.4% were people aged 65 or older living alone.
On average, about 2.22 people lived in each home. For families, the average size was 3.11 people.
Jobs, Money, and Differences
After a period of growth in the 1990s, Minneapolis still has lower average incomes and fewer jobs compared to its surrounding suburban areas. Jobs have grown twice as fast in the suburbs. This means more people are working outside the city. While wages in the city are generally higher, much of this growth is in downtown areas and big companies. Employees in these jobs might not live in the city itself.
If you look at just the neighborhoods outside downtown, wages are about 92.0% of what they are in the suburbs. Neighborhoods have gained some jobs since 1996. However, the types of jobs have changed. Stable factory and trade jobs have decreased. Instead, there are more jobs in education, healthcare, and services.
Even though some jobs are leaving the city, Minneapolis has many well-educated workers. About 70.0% of adults are working or looking for work. The unemployment rate was low at 4.7% in 2002. However, there are differences among different groups. For example, only 15.0% of African Americans and 13.0% of Hispanic people have college degrees. This is much lower than the 42.0% of European Americans with degrees.
About 15.8% of families and 21.5% of all people lived below the poverty line. This included 33.1% of those under 18 and 12.4% of those aged 65 or older.
The average household income in 2000 was $37,974. The average family income was $48,602. Now, the average household income is $44,478, and the average family income is $59,816.
Religion in Minneapolis
A study from 2014 by the Pew Research Center looked at religious beliefs in the Minneapolis area.
- 70% of people said they were Christians.
- 46% were Protestant (from various churches).
- 21% were Roman Catholic.
- 23% said they had no religious affiliation (they didn't belong to any religion).
- About 5% belonged to other religions. These included Judaism, Buddhism, Islam, and Hinduism.
| Affiliation | % of population | |
|---|---|---|
| Christian | 70 |
|
| Protestant | 46 |
|
| Lutheran | 23 |
|
| Historically Black Protestant | 4 |
|
| Methodist | 3 |
|
| Other Protestant | 16 |
|
| Roman Catholic | 21 |
|
| Mormon | 1 |
|
| Eastern Orthodox | 1 |
|
| Other Christian | 1 |
|
| Other religion or association | 5 |
|
| Unaffiliated | 23 |
|
| Nothing in particular | 16 |
|
| Agnostic | 4 |
|
| Atheist | 3 |
|
About 31% of residents go to religious services at least once a week. Another 33% go a few times a year. About 36% go only sometimes or never. About 42% of people pray every day. Many people (69%) believe in Heaven, and 51% believe in Hell.
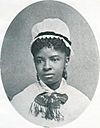 | Mary Eliza Mahoney |
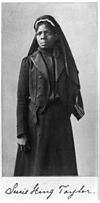 | Susie King Taylor |
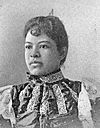 | Ida Gray |
 | Eliza Ann Grier |


