
Sissach District facts for kids
Quick facts for kids
Sissach District
Bezirk Sissach
|
|
|---|---|
|
District
|
|
| Country | |
| Canton | |
| Capital | Sissach |
| Area | |
| • Total | 138.29 km2 (53.39 sq mi) |
| Population
(2021)
|
|
| • Total | 36,331 |
| • Density | 262.716/km2 (680.43/sq mi) |
| Time zone | UTC+1 (CET) |
| • Summer (DST) | UTC+2 (CEST) |
| Municipalities | 29 |
The Sissach District is one of five main areas, called districts, in the canton of Basel-Country in Switzerland. Most people here speak German.
As of 30 June 2021, about 36,331 people live in Sissach District. This district is in the western part of Basel-Country. It shares borders with the nearby cantons of canton of Aargau and Solothurn. The main town and capital of the district is Sissach.
Contents
Geography
The Sissach district covers an area of about 141 square kilometers (54 square miles). This was measured in 2009.
Almost half of this land, about 49.3%, is used for farming. This includes fields for crops and areas for animals to graze. A large part, about 39.7%, is covered by forests.
About 10.7% of the land has buildings or roads. A very small part, 0.2%, is made up of rivers or lakes. The rest, about 0.1%, is land that cannot be used for anything.
Looking closer at the developed areas, 5.6% has houses and other buildings. Roads and other ways to travel make up 3.4%. In the forested areas, 38.0% is dense forest. Another 1.7% has fruit trees or small groups of trees.
For farming, 19.7% of the land grows crops. Pastures for animals cover 23.8%. Also, 5.8% is used for fruit orchards or vineyards. All the water in the district is from flowing rivers and streams.
Municipalities
Sissach District has 29 different towns and villages. These are called municipalities.
| Municipality | Population (30 June 2021) |
Area, km² |
|---|---|---|
| Anwil | 532 | 3.96 |
| Böckten | 812 | 2.28 |
| Buckten | 708 | 1.99 |
| Buus | 1,110 | 8.85 |
| Diepflingen | 765 | 1.44 |
| Gelterkinden | 6,252 | 9.79 |
| Häfelfingen | 256 | 3.96 |
| Hemmiken | 266 | 3.39 |
| Itingen | 2,216 | 3.14 |
| Känerkinden | 527 | 1.48 |
| Kilchberg | 165 | 1.59 |
| Läufelfingen | 1,252 | 8.15 |
| Maisprach | 941 | 5.06 |
| Nusshof | 262 | 1.72 |
| Oltingen | 511 | 7.18 |
| Ormalingen | 2,303 | 4.23 |
| Rickenbach | 612 | 2.90 |
| Rothenfluh | 770 | 10.93 |
| Rümlingen | 444 | 2.28 |
| Rünenberg | 748 | 4.98 |
| Sissach | 6,771 | 8.87 |
| Tecknau | 822 | 2.35 |
| Tenniken | 929 | 4.67 |
| Thürnen | 1,397 | 2.25 |
| Wenslingen | 699 | 5.91 |
| Wintersingen | 637 | 6.95 |
| Wittinsburg | 434 | 3.21 |
| Zeglingen | 516 | 7.91 |
| Zunzgen | 2,674 | 6.87 |
| Total | 36,331 | 138.29 |
Demographics
The Sissach district has a population of 36,331 people. This was counted in as of June 2021[update]. About 12.9% of these people are foreign nationals who live there.
Most people in the district speak German. In 2000, about 91.1% (28,263 people) spoke German. The second most common language was Italian (2.4% or 730 people). Albanian was third (1.3% or 396 people). A smaller number of people spoke French or Romansh.
In 2008, the population was almost evenly split between males and females. About 49.7% were male and 50.3% were female. Most people (86.4%) were Swiss citizens. The remaining 13.6% were residents from other countries.
Many people (about 30.6%) were born in the Sissach district itself. Another 28.1% were born in the same canton (Basel-Country). About 24.9% were born in other parts of Switzerland. Finally, 14.1% were born outside of Switzerland.
Population Changes
The total population of Sissach District grew by about 1.5% in 2008. This growth includes people moving into the district.
Age Groups
In 2010, the population had different age groups:
- Children aged 0-6 years: 6.6%
- Teenagers aged 7-19 years: 14.7%
- Young adults aged 20-29 years: 12.2%
- Adults aged 30-39 years: 12.6%
- Adults aged 40-49 years: 17.0%
- Adults aged 50-64 years: 20.9%
- Seniors aged 65-79 years: 11.7%
- Seniors over 80 years: 4.3%
Households
In 2000, there were 12,581 households in the district.
- About 27.0% of households had only one person living in them.
- Many households (3,885) were married couples without children.
- More households (4,236) were married couples with children.
- There were also 594 single parents living with their child or children.
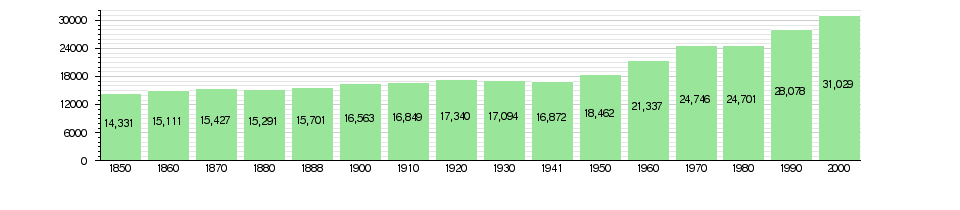
Historical Population
The chart below shows how the population of Sissach District has changed over time:
Politics
In the 2007 federal election, people in Sissach District voted for different political parties. The most popular party was the SVP, which got about 34% of the votes.
Other popular parties were:
- The SP (22.4%)
- The Green Party (18.02%)
- The FDP (15.94%)
Overall, about 51% of eligible voters participated in this election.
Religion
According to the 2000 census, people in Sissach District follow different religions:
- About 18.9% (5,874 people) were Roman Catholic.
- About 60.2% (18,685 people) belonged to the Swiss Reformed Church.
- A smaller number of people belonged to other Christian churches, including Orthodox and Christian Catholic churches (about 2.44%).
- About 4.43% (1,375 people) were Islamic.
- Very few people were Jewish, Buddhist, or Hindu.
- About 10.63% of the population said they had no religion or were agnostic or atheist.
Education
Many people in Sissach District have completed a good level of education.
- About 41.2% of the population (12,790 people) have finished upper secondary education. This is education after middle school that is not required.
- About 11.8% (3,676 people) have gone on to higher education. This means they attended a university or a specialized college (called a Fachhochschule).
Of those who completed higher education:
- 67.4% were Swiss men.
- 21.9% were Swiss women.
- 6.7% were non-Swiss men.
- 4.1% were non-Swiss women.
See also
 In Spanish: Distrito de Sissach para niños
