Rutherford County, North Carolina facts for kids
Quick facts for kids
Rutherford County
|
|||
|---|---|---|---|
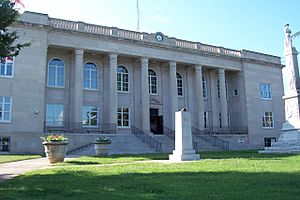
Rutherford County Courthouse
|
|||
|
|||
| Motto(s):
"Vibrant Communities – New Possibilities"
|
|||
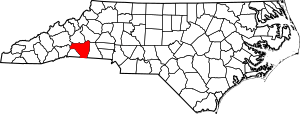
Location within the U.S. state of North Carolina
|
|||
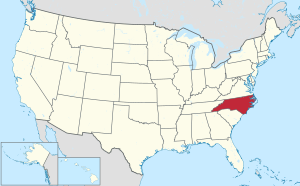 North Carolina's location within the U.S. |
|||
| Country | |||
| State | |||
| Founded | April 14, 1779 | ||
| Named for | Griffith Rutherford | ||
| Seat | Rutherfordton | ||
| Largest community | Forest City | ||
| Area | |||
| • Total | 567.25 sq mi (1,469.2 km2) | ||
| • Land | 565.44 sq mi (1,464.5 km2) | ||
| • Water | 1.81 sq mi (4.7 km2) 0.32% | ||
| Population
(2020)
|
|||
| • Total | 64,444 | ||
| • Estimate
(2023)
|
65,507 | ||
| • Density | 113.97/sq mi (44.00/km2) | ||
| Time zone | UTC−5 (Eastern) | ||
| • Summer (DST) | UTC−4 (EDT) | ||
| Congressional districts | 10th, 11th | ||
Rutherford County is a county located in the southwestern part of North Carolina. A county is like a smaller region within a state, often with its own local government. In 2020, about 64,444 people lived here. The main town, or county seat, where the county government is located, is Rutherfordton. The largest town in the county is Forest City.
Contents
- History of Rutherford County
- Early Beginnings and Native Americans
- How Rutherford County Was Formed
- Changes to County Borders
- Growth and Farming in the 1800s
- The Gold Rush in Rutherford County
- Military History and the Civil War
- Life After the Civil War
- Railroads and Mills Bring New Life
- Rutherford County in World War II
- 1989 Tornado Outbreak
- Geography of Rutherford County
- Population and People
- Economy and Jobs
- Culture and Fun Things to Do
- Communities in Rutherford County
- Famous People from Rutherford County
- See also
History of Rutherford County
Early Beginnings and Native Americans
Long ago, the Cherokee people lived in the area that is now Rutherford County. Later, this land became part of Mecklenburg County. In 1768, it was included in Tryon County.
How Rutherford County Was Formed
Rutherford County was officially created on April 14, 1779. It was formed when Tryon County was split into two new counties: Rutherford County and Lincoln County. The first county seat was a place called Gilbert Town.
In 1787, a new town called Rutherford Town was founded to be the county seat. Today, this town is known as Rutherfordton. Both the county and the town are named after Griffith Rutherford. He was an important leader during the American Revolutionary War and led a group against the Cherokee in 1776.
Changes to County Borders
Over the years, parts of Rutherford County were used to create other nearby counties.
- In 1791, parts of Rutherford and Burke County became Buncombe County.
- In 1841, parts of Rutherford and Lincoln County formed Cleveland County.
- In 1842, more parts of Rutherford and Burke counties were used to create McDowell County.
- Finally, in 1855, parts of Rutherford and Henderson County became Polk County.
Growth and Farming in the 1800s
By 1790, Rutherford County had 7,775 residents. Many areas were good for farming or were located on important travel routes. The population nearly doubled by 1810. During the 1800s, the main crops grown were corn, wheat, oats, rye, cotton, wool, and tobacco.
The county was a busy place because it was on major stagecoach routes. These routes connected important cities like Asheville, Salisbury, and Charlotte. To make travel even easier, the Hickory Nut Turnpike was finished in 1847.
The Gold Rush in Rutherford County
From 1790 until the California gold rush in the 1840s, Rutherford County was the most important gold-producing area in America. The town of Rutherfordton was at the center of this gold activity.
A German goldsmith named Christopher Bechtler and his sons set up a mint just north of Rutherfordton. They made millions of dollars worth of US coins. The Bechtlers were the first to produce gold dollars in the United States.
Military History and the Civil War
Rutherford County has a long history of strong local militias. In the 18th century, it had one of the best-organized militias in North Carolina. Its soldiers fought bravely in important battles like the Battle of Kings Mountain and the Battle of Cowpens.
During the American Civil War, Rutherfordton and Burnt Chimney (now Forest City) competed to raise groups of soldiers for the Confederate States Army.
Life After the Civil War
After the Civil War, many farmers in the region faced difficulties. They didn't own their own land and had to become tenant farmers. This often meant they were stuck in debt because of unfair crop liens.
To help farmers, the Rutherford Farmer's Alliance was started in June 1888 by D.N. Caviness. By 1891, it had 300 members fighting for farmers' rights. Colonel John L. McDowell was the Alliance's first president.
Railroads and Mills Bring New Life
In the 1880s and 1890s, new railroads and cotton mills were built in Rutherford County. This brought a lot of energy and growth to the communities, especially Forest City. The Rutherford Railway Construction Company built a train line connecting Rutherfordton to South Carolina. Other major railroads like Southern Railway and Seaboard Air Line Railroad also ran through the county.
Rutherford County in World War II
Many people from Rutherford County served in WWII. About 12% of the county's population helped with the war effort. Sadly, 149 people from Rutherford County died in the war. This was 3.5 times more losses than other counties, based on population. The first soldier from Rutherford County to die was SFC Mark Alexander Rhodes. He died when the USS Arizona was attacked at Pearl Harbor.
1989 Tornado Outbreak
In May 1989, an EF4 tornado hit Rutherford County. This powerful storm came from South Carolina. It was part of a larger group of tornadoes that affected Georgia, South Carolina, North Carolina, and Virginia.
Geography of Rutherford County
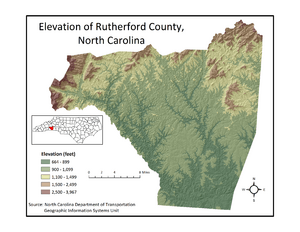
Rutherford County covers a total area of about 567 square miles. Most of this (565 square miles) is land, and a small part (1.81 square miles) is water.
Minerals and Gems
Besides gold and platinum, Rutherford County is known for other valuable minerals. These include rock crystal, garnet, tourmaline, slate, wolframite, and the rare-earth element samarskite. Even diamonds have been found here, including one discovered at the JD Twitty Gold Placer Mine in 1845.
Protected Natural Areas
Rutherford County has several beautiful natural areas that are protected. These include:
- Bechtler Mint Site Historic Park
- Bradley Nature Preserve at Alexander's Ford (part)
- Chimney Rock State Park (part)
- Purple Martin Greenway Trail
- South Mountains Game Lands (part)
- South Mountains State Park (part)
Major Rivers and Lakes
The county is home to several important rivers and creeks, as well as a beautiful lake:
- Broad River
- Catheys Creek
- Cedar Creek
- Duncans Creek
- Floyds Creek
- Green River
- Hills Creek
- Hollands Creek
- Lake Lure
- McKinney Creek
- Mountain Creek
- North Fork First Broad Creek
- Roberson Creek
- Second Broad River
Neighboring Counties
Rutherford County shares its borders with several other counties:
- McDowell County – to the north
- Burke County – to the northeast
- Cleveland County – to the east
- Cherokee County, South Carolina – to the south
- Spartanburg County, South Carolina – to the south
- Polk County – to the southwest
- Henderson County – to the west
- Buncombe County – to the northwest
Main Roads and Transportation
Several major highways run through Rutherford County, making it easy to travel to and from the area:
 US 64
US 64 US 74
US 74 US 74A
 US 74 Bus.
 US 221
 US 221A
 NC 9
NC 9 NC 108
 NC 120
 NC 226
The county also has two airports:
- Rutherford County Airport
- Summey Airpark, near Forest City
Population and People
| Historical population | |||
|---|---|---|---|
| Census | Pop. | %± | |
| 1790 | 7,808 | — | |
| 1800 | 10,753 | 37.7% | |
| 1810 | 13,202 | 22.8% | |
| 1820 | 15,351 | 16.3% | |
| 1830 | 17,557 | 14.4% | |
| 1840 | 19,202 | 9.4% | |
| 1850 | 13,550 | −29.4% | |
| 1860 | 11,573 | −14.6% | |
| 1870 | 13,121 | 13.4% | |
| 1880 | 15,198 | 15.8% | |
| 1890 | 18,770 | 23.5% | |
| 1900 | 25,101 | 33.7% | |
| 1910 | 28,385 | 13.1% | |
| 1920 | 31,426 | 10.7% | |
| 1930 | 40,452 | 28.7% | |
| 1940 | 45,577 | 12.7% | |
| 1950 | 46,356 | 1.7% | |
| 1960 | 45,091 | −2.7% | |
| 1970 | 47,337 | 5.0% | |
| 1980 | 53,787 | 13.6% | |
| 1990 | 56,918 | 5.8% | |
| 2000 | 62,899 | 10.5% | |
| 2010 | 67,810 | 7.8% | |
| 2020 | 64,444 | −5.0% | |
| 2023 (est.) | 65,507 | −3.4% | |
| U.S. Decennial Census 1790–1960 1900–1990 1990–2000 2010 2020 |
|||
Who Lives in Rutherford County?
According to the 2020 census, there were 64,444 people living in Rutherford County. These people made up 27,970 households and 18,874 families.
Here's a look at the different groups of people living in Rutherford County in 2020:
| Group | Number | Percentage |
|---|---|---|
| White (not Hispanic) | 52,026 | 80.73% |
| Black or African American (not Hispanic) | 5,836 | 9.06% |
| Native American | 152 | 0.24% |
| Asian | 343 | 0.53% |
| Pacific Islander | 23 | 0.04% |
| Other/Mixed | 2,778 | 4.31% |
| Hispanic or Latino | 3,286 | 5.1% |
Ancestry and Backgrounds
In 1983, the largest ancestry groups in Rutherford County included:
- English (44%)
- African American (11%)
- Irish (9%)
- German (5%)
- Scotch-Irish (4%)
- Scottish (3%)
- Dutch (2%)
- Italian (1%)
- French or French Canadian (1%)
- Mexican (1%)
- Polish (1%)
Economy and Jobs
Rutherford County has a big timber industry, which means they work with wood and forests. They also have factories that make textiles (fabrics) and building materials. Farmers in the county grow soybeans, wheat, corn, cotton, and raise livestock like cows and pigs.
In 2010, Facebook chose Rutherford County for a new, large data center. This was a big project costing $450 million. Also, Horsehead Corporation built a new factory in the county, near Forest City, to produce zinc and other metals.
Culture and Fun Things to Do
Rutherford County is a popular place for tourists. People visit beautiful spots like Lake Lure and Chimney Rock.
Several movies have been filmed in Rutherford County, including:
- Firestarter (1984)
- Dirty Dancing (1987)
- The Last of the Mohicans (1992)
Communities in Rutherford County
Rutherford County has several towns, a village, and other communities where people live.
Towns
- Bostic
- Ellenboro
- Forest City (This is the largest community)
- Lake Lure
- Ruth
- Rutherfordton (This is the county seat)
- Spindale
Village
Census-designated places
These are areas that are like towns but don't have their own local government:
Unincorporated communities
These are smaller communities that are not officially part of a town or city:
- Corinth
- Danieltown
- Harris
- Hopewell
- Mount Vernon
- Union Mills
- Sandy Mush
- Hollis
Former community
Townships
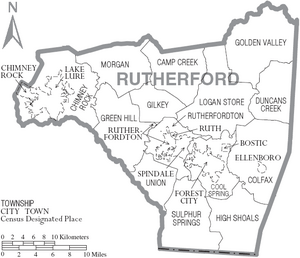
Townships are smaller divisions within a county, often used for administrative purposes:
- Camp Creek
- Chimney Rock
- Colfax
- Cool Spring
- Duncans Creek
- Gilkey
- Golden Valley
- Green Hill
- High Shoals
- Logan Store
- Morgan
- Rutherfordton
- Sulphur Springs
- Union
Famous People from Rutherford County
Many notable people have come from Rutherford County:
- William Chivous Bostic Sr., a doctor and researcher
- Smoky Burgess, a record-setting baseball player
- Christopher Bechtler, a German goldsmith
- Cordelia Camp, an educator and author
- Bryan Coker, the 12th President of Maryville College
- Walter Dalton, a former lieutenant governor of North Carolina
- Tim Earley, an American poet
- Pleasant Daniel Gold, an American publisher and clergyman
- James Holland, a former U.S. congressman
- Kay Hooper, a best-selling author
- Lewis Jolley, a running back for the Houston Oilers football team
- Robert McNair, the former owner of the Houston Texans football team
- Phil Prince, the 12th president of Clemson University
- Merle Davis Umstead, a former first lady of North Carolina
- Felix Walker, a former U.S. congressman
See also
 In Spanish: Condado de Rutherford (Carolina del Norte) para niños
 | Kyle Baker |
 | Joseph Yoakum |
 | Laura Wheeler Waring |
 | Henry Ossawa Tanner |


