Cincinnati metropolitan area facts for kids
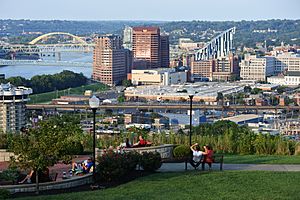
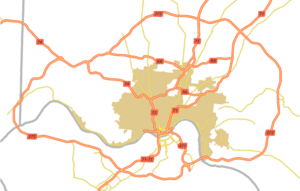
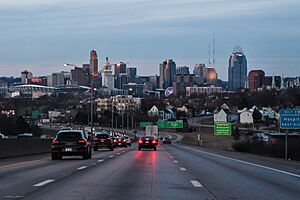
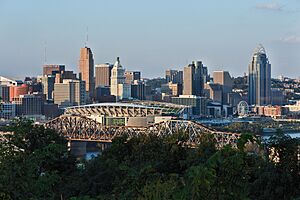
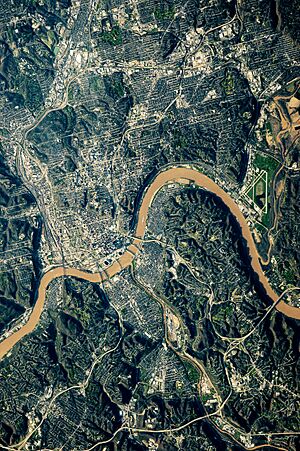
The Cincinnati metropolitan area, also known as the Cincinnati Tri-State area or Greater Cincinnati, is a large region centered around the city of Cincinnati. It includes parts of three different states: Ohio, Kentucky, and Indiana.
This area is officially called the Cincinnati, OH–KY–IN Metropolitan Statistical Area by the United States Census Bureau. In 2020, over 2.2 million people lived here. This makes Greater Cincinnati the 28th largest metropolitan area in the United States. It is also the biggest metro area in Ohio, larger than Columbus and Cleveland.
The wider Cincinnati–Wilmington, OH–KY–IN Combined Statistical Area also includes Clinton County, Ohio. This big region is even considered part of the Great Lakes Megalopolis, a huge chain of cities and towns.
Quick facts for kids
Greater Cincinnati
Cincinnati, OH–KY–IN Metropolitan Statistical Area
|
|
|---|---|
|
|
| Country | |
| State | |
| Largest city | |
| Counties | |
| Area | |
| • Total | 4,808 sq mi (12,450 km2) |
| Elevation | 551 ft (168 m) |
| Population
(2015)
|
|
| • Metro density | 469/sq mi (181/km2) |
| • MSA | 2,256,884 (28th) |
| MSA/CSA = 2015, Urban = 2013 | |
| GDP | |
| • MSA | $186.1 billion (2022) |
| Time zone | UTC−5 (EST) |
| • Summer (DST) | UTC−4 (EDT) |
| Area code(s) | 513, 283, 859, 937, 812 |
Contents
How the Area is Defined
The Cincinnati metropolitan area was first officially recognized in 1950. It included Campbell and Kenton counties in Kentucky, and Hamilton County in Ohio. As more people moved to nearby counties and worked in Hamilton County, these areas were added to the official definition.
Over the years, the way the Census Bureau defines these areas has changed. Sometimes, smaller areas like Butler County, Ohio were grouped with Cincinnati. The goal is to show how different cities and counties are connected by people living and working across the region.
Population Growth
The Cincinnati area has grown a lot over the years. Here's how the population has changed:
| Historical population | |||
|---|---|---|---|
| Census | Pop. | %± | |
| 1950 | 1,244,738 | — | |
| 1960 | 1,544,659 | 24.1% | |
| 1970 | 1,690,234 | 9.4% | |
| 1980 | 1,753,801 | 3.8% | |
| 1990 | 1,844,917 | 5.2% | |
| 2000 | 2,009,632 | 8.9% | |
| 2010 | 2,130,151 | 6.0% | |
| 2020 | 2,256,884 | 5.9% | |
| data source: | |||
| Statistical Area/County | 2020 Census | 2010 Census | 2000 Census | 1990 Census | 1980 Census | 1970 Census | 1960 Census | 1950 Census |
|---|---|---|---|---|---|---|---|---|
| Cincinnati–Wilmington–Maysville, OH-KY-IN CSA | 2,316,022 | 2,172,191 | 2,050,175 | 1,880,332 | 1,788,404 | 1,721,698 | 1,574,663 | 1,270,310 |
| Cincinnati, OH-KY-IN MSA | 2,256,884 | 2,130,151 | 2,009,632 | 1,844,917 | 1,753,801 | 1,690,234 | 1,544,659 | 1,244,738 |
| Hamilton County, Ohio | 830,639 | 802,374 | 845,303 | 866,228 | 873,224 | 924,018 | 864,121 | 723,952 |
| Butler County, Ohio2 | 390,357 | 368,130 | 332,807 | 291,479 | 258,787 | 226,207 | 199,076 | 147,203 |
| Warren County, Ohio | 242,337 | 212,693 | 158,383 | 113,909 | 99,276 | 84,925 | 65,711 | 38,505 |
| Clermont County, Ohio | 208,601 | 197,363 | 177,977 | 150,187 | 128,483 | 95,725 | 80,530 | 42,182 |
| Brown County, Ohio | 43,676 | 44,846 | 42,285 | 34,966 | 31,920 | 26,635 | 25,178 | 22,221 |
| Clinton County, Ohio | 42,018 | |||||||
| Boone County, Kentucky | 135,968 | 118,811 | 85,991 | 57,589 | 45,842 | 32,812 | 21,940 | 13,015 |
| Kenton County, Kentucky | 169,064 | 159,720 | 151,464 | 142,031 | 137,058 | 129,440 | 120,700 | 104,254 |
| Campbell County, Kentucky | 93,076 | 90,336 | 88,616 | 83,866 | 83,317 | 88,501 | 86,803 | 76,196 |
| Grant County, Kentucky | 24,941 | 24,662 | 22,384 | 15,737 | 13,308 | 9,999 | 9,489 | 9,809 |
| Pendleton County, Kentucky | 14,644 | 14,877 | 14,390 | 12,036 | 10,989 | 9,949 | 9,968 | 9,610 |
| Bracken County, Kentucky | 8,400 | 8,488 | 8,279 | 7,766 | 7,738 | 7,227 | 7,422 | 8,424 |
| Gallatin County, Kentucky | 8,690 | 8,589 | 7,870 | 5,393 | 4,842 | 4,134 | 3,867 | 3,969 |
| Mason County, Kentucky | 17,120 | |||||||
| Dearborn County, Indiana | 50,679 | 50,047 | 46,109 | 38,835 | 34,291 | 29,430 | 28,674 | 25,141 |
| Franklin County, Indiana | 22,785 | 23,087 | 22,151 | 19,580 | 19,612 | 16,943 | 17,015 | 16,034 |
| Ohio County, Indiana | 5,940 | 6,128 | 5,623 | 5,315 | 5,114 | 4,289 | 4,165 | 4,223 |
| Union County, Indiana | 7,087 |
Notes
1For comparison, population data uses 2008 Census definitions.
2Butler County, Ohio was once a separate area. It was later grouped with Cincinnati.
Main Cities and Towns
The Cincinnati metro area has many cities and towns. Here are some of the largest ones, based on the 2020 census:
Cities with Over 100,000 People
- Cincinnati, Ohio (309,317 people)
Cities with 50,000 to 99,999 People
- Hamilton, Ohio (63,399 people)
- Middletown, Ohio (50,987 people)
Cities and Towns with 10,000 to 49,999 People
- Fairfield, Ohio (42,623)
- Covington, Kentucky (40,961)
- Mason, Ohio (40,691)
- Florence, Kentucky (31,946)
- Independence, Kentucky (28,676)
- Oxford, Ohio (23,035)
- Lebanon, Ohio (20,841)
- Forest Park, Ohio (20,189)
- Erlanger, Kentucky (19,611)
- Springboro, Ohio (19,062)
- Norwood, Ohio (19,043)
- Fort Thomas, Kentucky (17,438)
- Newport, Kentucky (14,150)
- Sharonville, Ohio (14,117)
- Blue Ash, Ohio (13,394)
- Loveland, Ohio (13,307)
- Wilmington, Ohio (12,660) (This is in the larger CSA area)
- Springdale, Ohio (11,007)
- Reading, Ohio (10,600)
- Alexandria, Kentucky (10,341)

Climate and Weather
The Cincinnati area is in a special "transition zone" for climate. This means it has weather patterns from both the humid subtropical climate (like the southern US) and the humid continental climate (like the northern US).
You can see this in the plants that grow here. Some plants from warmer areas, like Southern Magnolia trees, can survive near the Ohio River. In winter, the amount of snow or ice can be very different between the northern and southern parts of the region.
The area can sometimes have strong storms, including thunderstorms, large hail, and even tornadoes.
| Climate data for Cincinnati (Cincinnati/Northern Kentucky Int'l), 1981–2010 normals, extremes 1871–present | |||||||||||||
|---|---|---|---|---|---|---|---|---|---|---|---|---|---|
| Month | Jan | Feb | Mar | Apr | May | Jun | Jul | Aug | Sep | Oct | Nov | Dec | Year |
| Record high °F (°C) | 77 (25) |
78 (26) |
88 (31) |
90 (32) |
95 (35) |
102 (39) |
108 (42) |
103 (39) |
102 (39) |
91 (33) |
82 (28) |
75 (24) |
108 (42) |
| Mean maximum °F (°C) | 60.7 (15.9) |
65.3 (18.5) |
75.7 (24.3) |
81.8 (27.7) |
85.8 (29.9) |
91.4 (33.0) |
94.0 (34.4) |
93.4 (34.1) |
89.8 (32.1) |
82.0 (27.8) |
72.7 (22.6) |
62.1 (16.7) |
95.5 (35.3) |
| Mean daily maximum °F (°C) | 38.7 (3.7) |
42.9 (6.1) |
53.2 (11.8) |
64.7 (18.2) |
73.7 (23.2) |
82.1 (27.8) |
85.6 (29.8) |
84.9 (29.4) |
78.1 (25.6) |
66.2 (19.0) |
54.0 (12.2) |
41.6 (5.3) |
63.9 (17.7) |
| Mean daily minimum °F (°C) | 23.0 (−5.0) |
26.0 (−3.3) |
34.0 (1.1) |
43.7 (6.5) |
53.2 (11.8) |
62.0 (16.7) |
66.1 (18.9) |
64.8 (18.2) |
57.0 (13.9) |
45.5 (7.5) |
36.2 (2.3) |
26.6 (−3.0) |
44.9 (7.2) |
| Mean minimum °F (°C) | −1.1 (−18.4) |
4.6 (−15.2) |
14.8 (−9.6) |
26.2 (−3.2) |
37.0 (2.8) |
48.0 (8.9) |
54.3 (12.4) |
53.8 (12.1) |
40.8 (4.9) |
28.7 (−1.8) |
19.3 (−7.1) |
5.4 (−14.8) |
−5.8 (−21.0) |
| Record low °F (°C) | −25 (−32) |
−17 (−27) |
−11 (−24) |
15 (−9) |
27 (−3) |
39 (4) |
47 (8) |
43 (6) |
31 (−1) |
16 (−9) |
0 (−18) |
−20 (−29) |
−25 (−32) |
| Average precipitation inches (mm) | 3.00 (76) |
2.81 (71) |
3.96 (101) |
3.89 (99) |
4.93 (125) |
4.03 (102) |
3.76 (96) |
3.41 (87) |
2.63 (67) |
3.30 (84) |
3.43 (87) |
3.37 (86) |
42.52 (1,080) |
| Average snowfall inches (cm) | 6.5 (17) |
6.5 (17) |
3.0 (7.6) |
0.5 (1.3) |
trace | 0 (0) |
0 (0) |
0 (0) |
0 (0) |
0.4 (1.0) |
0.4 (1.0) |
4.8 (12) |
22.1 (56) |
| Average precipitation days (≥ 0.01 in) | 12.4 | 11.6 | 12.5 | 12.7 | 12.8 | 11.5 | 10.6 | 9.1 | 7.7 | 8.4 | 10.6 | 12.5 | 132.4 |
| Average snowy days (≥ 0.1 in) | 6.5 | 5.4 | 2.4 | 0.6 | 0.1 | 0 | 0 | 0 | 0 | 0.1 | 0.8 | 4.9 | 20.8 |
| Average relative humidity (%) | 72.2 | 70.1 | 67.0 | 62.8 | 66.9 | 69.2 | 71.5 | 72.3 | 72.7 | 69.2 | 71.0 | 73.8 | 69.9 |
| Mean monthly sunshine hours | 120.8 | 128.4 | 170.1 | 211.0 | 249.9 | 275.5 | 277.0 | 261.5 | 234.4 | 188.8 | 118.7 | 99.3 | 2,335.4 |
| Percent possible sunshine | 40 | 43 | 46 | 53 | 56 | 62 | 61 | 62 | 63 | 55 | 39 | 34 | 52 |
| Source: NOAA (relative humidity and sun 1961–1990) | |||||||||||||
Transportation
Getting around Greater Cincinnati is possible by various means.
Public Transportation
- The Connector is a streetcar line that opened in Cincinnati in 2016.
- Amtrak's Cardinal train travels between Chicago and New York City, stopping at Cincinnati Union Terminal.
- Bus services are provided by the Southwest Ohio Regional Transit Authority (SORTA) in Ohio and the Transit Authority of Northern Kentucky (TANK) in Kentucky.
Air Travel
The main airport for the area is Cincinnati/Northern Kentucky International Airport (CVG) in Hebron, Kentucky. It's a very busy airport for cargo flights, serving as a hub for companies like DHL Aviation and Amazon Air. It also has passenger flights to many cities in North America and Europe.
Roads and Highways
Many major roads connect the cities and towns in the Cincinnati area.
- Interstates:
 Interstate 71
 Interstate 74
 Interstate 75
 Interstate 275 (a loop around the city)
 Interstate 471
- US Highways:

 U.S. Route 22 & State Route 3
 U.S. Route 27
 U.S. Route 42
 U.S. Route 50
 U.S. Route 52
 U.S. Route 127
- Ohio State Highways:
- Kentucky State Highways:
Education
The Greater Cincinnati area is home to many colleges and universities.
Ohio Colleges and Universities
- University of Cincinnati
- Xavier University
- Cincinnati State Technical and Community College
- Miami University
- Mount St. Joseph University
- Union Institute & University
- Hebrew Union College
- Art Academy of Cincinnati
- God's Bible School and College
Kentucky Colleges and Universities
- Northern Kentucky University
- Thomas More University
- Gateway Community and Technical College
- Maysville Community and Technical College
Indiana Colleges and Universities
- Ivy Tech Community College
Area Codes
Phone numbers in the Cincinnati area use several different area codes:
- 513 and 283 – for Ohio counties and Cincinnati
- 937 and 326 – for other Ohio counties
- 859 – for most Kentucky counties
- 606 – for Bracken and Mason counties in Kentucky
- 812 and 930 – for Indiana counties
- 765 – for some Indiana counties
In the Media
Local TV and radio stations in Cincinnati often use the terms "Greater Cincinnati" and "Tri-State Area." They use these terms when talking about weather or school closings to include all the nearby counties in Ohio, Kentucky, and Indiana.
Images for kids
See also
 In Spanish: Área metropolitana de Cincinnati-Norte de Kentucky para niños


