Development regions of the Dominican Republic facts for kids
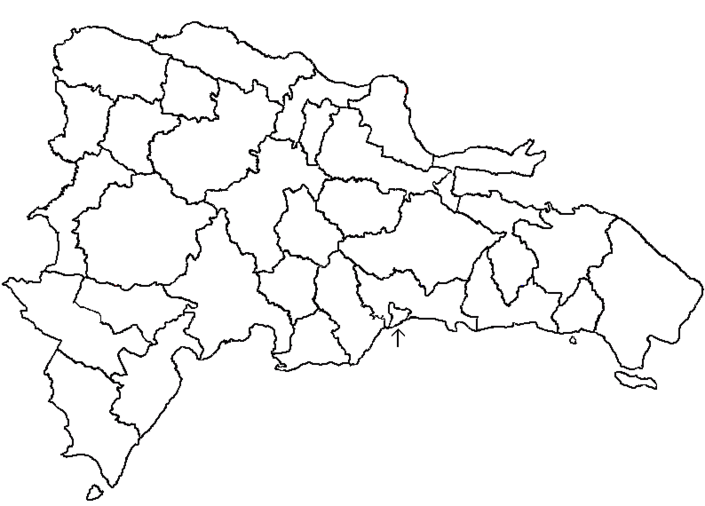
The development regions of the Dominican Republic are special areas created to help with planning and organizing the country. Think of them like different zones that help the government make good decisions about where to build new schools, roads, or hospitals. These regions were set up on June 30, 2004.
It's important to know that these regions are just for planning. They don't have their own separate governments or administrative powers like provinces do.
There are 10 development regions in total, grouped into three main parts of the country:
|
Cibao
|
Suroeste (Southwest)
|
Sureste (Southeast)
|
The information about how many people live in each province comes from the most recent national count, called a census (2014).
Contents
Cibao Regions
The Cibao is a traditional part of the Dominican Republic. It covers the northern half of the country.
Region I: Cibao Norte
This region is in the northern part of Cibao. It includes three important provinces:
- Espaillat
- Puerto Plata
- Santiago
Santiago is a very large province in this region. The total population for Cibao Norte is about 1.5 million people.
Region II: Cibao Sur
Cibao Sur is located in the southern part of the Cibao area. It includes these provinces:
- La Vega
- Sánchez Ramírez
- Monseñor Nouel
This region has a total population of over 710,000 people.
Region III: Cibao Nordeste
This region covers the northeastern part of the Cibao. It is made up of four provinces:
- Duarte
- María Trinidad Sánchez
- Hermanas Mirabal
- Samaná
The total population for Cibao Nordeste is around 624,000 people.
Region IV: Cibao Noroeste
Cibao Noroeste is in the northwestern part of the Cibao. The provinces in this region are:
- Dajabón
- Monte Cristi
- Santiago Rodríguez
- Valverde
This region has a population of about 394,000 people.
Suroeste Regions
The Suroeste (Southwest) is another major division of the country.
Region V: Valdesia
The Valdesia region is in the southwest. It includes four provinces:
- Azua
- Peravia
- San Cristóbal
- San José de Ocoa
This region has a population of over 1 million people.
Region VI: Enriquillo
The Enriquillo region is also in the southwest. It is named after Lake Enriquillo, a large saltwater lake in the area. The provinces here are:
- Baoruco
- Barahona
- Independencia
- Pedernales
The total population for the Enriquillo region is about 368,000 people.
Region VII: El Valle
El Valle, meaning "The Valley," is a region located in the central-western part of the country. It includes two provinces:
- Elías Piña
- San Juan
This region has a population of around 295,000 people.
Sureste Regions
The Sureste (Southeast) is the third main group of regions.
Region VIII: Yuma
The Yuma region is in the eastern part of the country. It includes these provinces:
- El Seibo
- La Altagracia
- La Romana
This region has a total population of about 606,000 people.
Region IX: Higuamo
The Higuamo region is located in the southeastern part of the Dominican Republic. It is made up of three provinces:
- San Pedro de Macorís
- Monte Plata
- Hato Mayor
The total population for the Higuamo region is around 561,000 people.
Region X: Ozama
The Ozama region is the most populated area. It includes the capital city and its surrounding areas:
- Distrito Nacional (where the capital, Santo Domingo, is located)
- Santo Domingo Province
This region has a very large population, totaling over 3.3 million people.
Map
Related pages
 | Delilah Pierce |
 | Gordon Parks |
 | Augusta Savage |
 | Charles Ethan Porter |


