
World population facts for kids

The world population is the total number of humans currently living on Earth. The United Nations estimated that this number passed eight billion in November 2022. It took a very long time, about 300,000 years, for the human population to reach one billion people. But then, it only took 222 more years to grow to eight billion!
After big events like the Black Death in the 1300s, when the population was around 370 million, the number of people started to grow steadily. The fastest growth happened between 1955 and 1975, with the population increasing by more than 1.8% each year. It peaked at 2.1% between 1965 and 1970. This growth rate has slowed down to 1.1% between 2015 and 2020, and experts expect it to slow even more.
Even though the growth rate is slowing, the global population is still getting bigger. The UN Department of Economics and Social Affairs thinks there will be between 9 and 10 billion people by 2050. They also suggest there's an 80% chance the population will be between 10 and 12 billion by the end of the 21st century. At that point, the growth rate might be zero. Some experts believe the human population could even start to shrink in the second half of this century.
Currently (2015–2020), about 140 million babies are born worldwide each year. This number is expected to reach its highest point, 141 million births per year, between 2040 and 2045. After that, it might slowly drop to 126 million births per year by 2100. The number of deaths is currently about 57 million per year. This is expected to rise steadily to 121 million deaths per year by 2100.
The average age of people around the world in 2020 was 31 years old.
Contents
A Look Back: How Our Population Grew

It's hard to know exactly how many people lived on Earth long ago. Scientists only started making good guesses about the world's population in the 1600s. Early guesses in the late 1700s were close to one billion people. By the early 1800s, estimates ranged from 600 million to 1 billion. Even today, it's tough to get an exact number, and current estimates can be off by 3% to 5%.
Early Human History: From Ancient Times to the Middle Ages
When farming began around 10,000 BC, the world's population was likely between 1 million and 15 million people. Later, around the 4th century AD, about 50–60 million people lived in the Roman Empire.
Diseases like the Plague of Justinian caused Europe's population to drop by about half between the 500s and 700s AD. In 1340, Europe had over 70 million people. But from 1340 to 1400, the world's population fell from about 443 million to 350–375 million. This was mainly because of the Black Death pandemic, which hit Europe very hard. It took 200 years for Europe's population to recover. China's population also dropped a lot during this time, from 123 million in 1200 to 65 million in 1393, due to wars, hunger, and sickness.
In ancient China, the Han dynasty kept detailed records of families to collect taxes. In AD 2, they recorded 57.6 million people. By AD 146, this had dropped to 47.5 million. From 200 to 400 AD, the world population went down from 257 million to 206 million, with China seeing the biggest loss. Later, at the start of the Ming dynasty in 1368, China's population was around 60 million. By the end of the dynasty in 1644, it might have reached 150 million.
New crops like maize (corn) and cassava, brought to Asia and Europe from the Americas in the 1500s, helped populations grow. These crops also became very important foods in Africa after Portuguese traders introduced them.
The number of people living in the Americas before Christopher Columbus arrived is a mystery. Experts have guessed anywhere from 10 million to 100 million people. When Europeans came, they often brought diseases like smallpox, measles, and influenza. Native Americans had no protection against these diseases, and some experts believe up to 90% of them died. Europeans had developed immunity over centuries, but the native people had not.
Modern Times: Population Boom

During the European Agricultural and Industrial Revolutions, more children started living past age five. For example, in London, the percentage of children who died before age five dropped from 74.5% in the 1730s-1740s to 31.8% in the 1810s-1820s. Between 1700 and 1900, Europe's population grew from about 100 million to over 400 million. By 1900, people of European descent made up 36% of the world's population.
Population growth sped up even more in Western countries after vaccines and better medicine and sanitation were introduced. Better living conditions helped Britain's population grow from 10 million to 40 million in the 1800s. The United States grew from about 5.3 million in 1800 to 106 million in 1920, and over 307 million in 2010.
Many developing countries have seen very fast population growth since the early 1900s. This is thanks to economic improvements and better public health. China's population went from about 430 million in 1850 to 580 million in 1953, and is now over 1.3 billion. The Indian subcontinent (India, Pakistan, and Bangladesh) grew from about 125 million in 1750 to 389 million in 1941. Today, these countries together have about 1.6 billion people.
Reaching Billions: Key Milestones
| Population | 1 | 2 | 3 | 4 | 5 | 6 | 7 | 8 | 9 | 10 |
|---|---|---|---|---|---|---|---|---|---|---|
| Year | 1804 | 1927 | 1960 | 1974 | 1987 | 1999 | 2011 | 2022 | 2037 | 2057 |
| Years elapsed | 200,000+ | 123 | 33 | 14 | 13 | 12 | 12 | 11 | 15 | 20 |
The United Nations (UN) believes the world population reached one billion for the first time in 1804. It took another 123 years to reach two billion in 1927. But then, it only took 33 years to hit three billion in 1960! After that, it took 14 years to reach four billion (1974), 13 years to reach five billion (1987), 12 years to reach six billion (1999), and 12 years to reach seven billion (2011).
The UN announced that the global population reached eight billion in November 2022. Because the growth rate is slowing, it will take longer to reach the next billions. It's expected to take another 15 years to reach nine billion (around 2037) and 20 years to reach ten billion (around 2057).
Experts use different ways to guess future population numbers, so their predictions can vary. For example, some guesses for 2050 range from 7.4 billion to over 10.6 billion. Long-term predictions for 2150 range from a low of 3.2 billion to a high of 24.8 billion.
It's impossible to know the exact day or month when the world population hit one or two billion. The UN did celebrate the "Day of 5 Billion" on July 11, 1987, and the "Day of 6 Billion" on October 12, 1999. The "Day of Seven Billion" was October 31, 2011. The UN marked the birth of the eight billionth person on November 15, 2022.
Global Population Facts

In 2020, for every 100 girls born, there were about 101 boys. About 24.7% of the world's population is under 15 years old. About 65.2% are between 15 and 64, and 10.1% are 65 or older. The average age of people worldwide was 31 years in 2020, and it's expected to rise to 37.9 years by 2050.
The World Health Organization says the average life expectancy globally was 73.3 years in 2020. Women live longer on average (75.9 years) than men (70.8 years). In 2010, the average number of children a woman had was 2.44.
The total weight of all humans on Earth in June 2012 was about 287 million tonnes. The average person weighed around 62 kilograms (137 pounds).
The IMF estimated that the total value of all goods and services produced worldwide in 2021 was about US$94.94 trillion. This means the average person's share was about US$12,290 per year. About 9.3% of the world's population lives in extreme poverty, meaning they live on less than US$1.9 a day. About 8.9% of people are malnourished (don't get enough food). 87% of people over 15 can read and write. As of January 2024, about 5 billion people use the internet, which is 66% of the world's population.
The Han Chinese are the largest ethnic group in the world, making up over 19% of the global population in 2011. The most spoken languages are English, Mandarin Chinese, Hindi, Spanish, and French. More than three billion people speak an Indo-European language, which is the biggest language family.
The largest religious groups in the world as of 2020 are Christianity (31%), Islam (25%), people with no religious affiliation (16%), and Hinduism (15%).
Where Do People Live? Population by Region
Six of Earth's seven continents have many people living on them. Asia is the most populated continent, with 4.64 billion people. This is 60% of the world's population! The two most populated countries, India and China, together make up about 36% of all people.
Africa is the second most populated continent, with about 1.34 billion people, or 17% of the world's population. Europe has 747 million people, which is 10% of the world's population (as of 2020). The Latin American and Caribbean regions have about 653 million people (8%). Northern America, which includes the United States and Canada, has about 368 million people (5%). Oceania, the least populated region, has about 42 million people (0.5%). Antarctica only has a small, changing population of about 1200 people, mostly scientists at research stations.

| Region | 2022 (percent) | 2030 (percent) | 2050 (percent) |
|---|---|---|---|
| Sub-Saharan Africa | 1,152 (14.51%) | 1,401 (16.46%) | 2,094 (21.62%) |
| Northern Africa and Western Asia | 549 (6.91%) | 617 (7.25%) | 771 (7.96%) |
| Central Asia and Southern Asia | 2,075 (26.13%) | 2,248 (26.41%) | 2,575 (26.58%) |
| Eastern Asia and Southeastern Asia | 2,342 (29.49%) | 2,372 (27.87%) | 2,317 (23.92%) |
| Europe and Northern America | 1,120 (14.10%) | 1,129 (13.26%) | 1,125 (11.61%) |
| Latin America and the Caribbean | 658 (8.29%) | 695 (8.17%) | 749 (7.73%) |
| Australia and New Zealand | 31 (0.39%) | 34 (0.40%) | 38 (0.39%) |
| Oceania | 14 (0.18%) | 15 (0.18%) | 20 (0.21%) |
| World | 7,942 | 8,512 | 9,687 |
| Region | Density (people/km2) |
Population (millions) |
Most populous country | Most populous city (metropolitan area) |
|---|---|---|---|---|
| Asia | 104.1 | 4,641 | 1,439,090,595 – |
13,515,000 – (37,400,000 – |
| Africa | 44.4 | 1,340 | 211,401,000 – |
9,500,000 – (20,076,000 – |
| Europe | 73.4 | 747 | 146,171,000 – |
13,200,000 – (20,004,000 – |
| Latin America | 24.1 | 653 | 214,103,000 – |
12,252,000 – (21,650,000 – |
| Northern America | 14.9 | 368 | 332,909,000 – |
8,804,000 – (23,582,649 – |
| Oceania | 5 | 42 | 25,917,000 – |
5,367,000 – |
| Antarctica | ~0 | 0.004 | N/A | 1,258 – |
Countries with the Most People

.png)

Top 10 Most Populous Countries
| Country / Dependency | Population | % of world |
Date | Source (official or from the United Nations) |
|---|---|---|---|---|
| 1,425,775,850 | 18.9% | 14 Apr 2023 | UN projection | |
| 1,412,600,000 | 18.7% | 31 Dec 2021 | National annual estimate | |
| 339,546,000 | July 15, 2026 | 4.5% | National population clock | |
| 278,696,200 | 3.70% | 1 Jul 2023 | National annual estimate | |
| 229,488,994 | 3.04% | 1 Jul 2022 | UN projection | |
| 216,746,934 | 2.88% | 1 Jul 2022 | UN projection | |
| 220,933,000 | July 15, 2026 | 2.93% | National population clock | |
| 168,220,000 | 2.23% | 1 Jul 2020 | Annual Population Estimate | |
| 147,190,000 | 1.95% | 1 Oct 2021 | 2021 preliminary census results | |
| 128,271,248 | 1.70% | 31 Mar 2022 |
About 4.6 billion people live in these ten countries. This is around 57% of the world's population as of July 2023. The UN predicts that by 2023, India will have more people than China.
| # | Most populous countries | 2000 | 2015 | 2030 | |
|---|---|---|---|---|---|
| 1 | 1,270 | 1,376 | 1,416 | ||
| 2 | 1,053 | 1,311 | 1,528 | ||
| 3 | 283 | 322 | 356 | ||
| 4 | 212 | 258 | 295 | ||
| 5 | 136 | 208 | 245 | ||
| 6 | 176 | 206 | 228 | ||
| 7 | 123 | 182 | 263 | ||
| 8 | 131 | 161 | 186 | ||
| 9 | 146 | 146 | 149 | ||
| 10 | 103 | 127 | 148 | ||
| World total | 6,127 | 7,349 | 8,501 | ||
| Notes: | |||||
Countries with the Most People Per Square Kilometer
.jpg)
These tables show countries with the most people living in a small area (population density).
| Rank | Country | Population | Area (km2) |
Density (pop/km2) |
|---|---|---|---|---|
| 1 | 5,921,231 | 719 | 8,235 | |
| 2 | 165,650,475 | 148,460 | 1,116 | |
| 3 | 5,223,000 | 6,025 | 867 | |
| 4 | 23,580,712 | 35,980 | 655 | |
| 5 | 51,844,834 | 99,720 | 520 | |
| 6 | 5,296,814 | 10,400 | 509 | |
| 7 | 13,173,730 | 26,338 | 500 | |
| 8 | 12,696,478 | 27,830 | 456 | |
| 9 | 1,389,637,446 | 3,287,263 | 423 | |
| 10 | 17,400,824 | 41,543 | 419 |
| Rank | Country | Population | Area (km2) |
Density (pop/km2) |
Population trend |
|---|---|---|---|---|---|
| 1 | 1,389,637,446 | 3,287,263 | 423 | Growing | |
| 2 | 242,923,845 | 796,095 | 305 | Rapidly growing | |
| 3 | 165,650,475 | 148,460 | 1,116 | Growing | |
| 4 | 124,214,766 | 377,915 | 329 | Declining | |
| 5 | 114,597,229 | 300,000 | 382 | Growing | |
| 6 | 103,808,319 | 331,210 | 313 | Growing | |
| 7 | 67,791,400 | 243,610 | 278 | Growing | |
| 8 | 51,844,834 | 99,720 | 520 | Steady | |
| 9 | 23,580,712 | 35,980 | 655 | Steady | |
| 10 | 23,187,516 | 65,610 | 353 | Growing |
How Population Changes Over Time
.svg)
Population numbers change at different speeds in different places. But for a long time, the number of people has been growing on all continents. In the 20th century, the global population grew faster than ever before. It went from about 1.6 billion in 1900 to over 6 billion in 2000. This huge increase happened because of better sanitation, medical advances, and more food production (thanks to the Green Revolution). By 2000, there were about ten times more people on Earth than in 1700.
However, this super-fast growth didn't last. Between 2000 and 2005, the world's population was growing by about 1.3% per year (around 80 million people). This was down from its highest point of 2.1% between 1965 and 1970. Even though the global growth rate is slowing down, some areas like Sub-Saharan Africa still have high growth.

_001.jpg)
In the 2010s, countries like Japan and some in Europe started to see their populations shrink. This is because fewer babies are being born there.
In 2019, the UN reported that the rate of population growth keeps slowing down. If this continues, the growth rate might reach zero by 2100, and the world population could level off at 10.9 billion. But this is just one guess. Other experts have different ideas. Some think the population might peak around 8.1 billion in the early 2040s and then start to decline. It's a big question that many people are still studying!
Annual Population Growth
| Year | Population | Yearly growth | Density (pop/km2) |
|
|---|---|---|---|---|
| % | Number | |||
| 1951 | 2,543,130,380 | 1.75% | 43,808,223 | 17 |
| 1952 | 2,590,270,899 | 1.85% | 47,140,519 | 17 |
| 1953 | 2,640,278,797 | 1.93% | 50,007,898 | 18 |
| 1954 | 2,691,979,339 | 1.96% | 51,700,542 | 18 |
| 1955 | 2,746,072,141 | 2.01% | 54,092,802 | 18 |
| 1956 | 2,801,002,631 | 2.00% | 54,930,490 | 19 |
| 1957 | 2,857,866,857 | 2.03% | 56,864,226 | 19 |
| 1958 | 2,916,108,097 | 2.04% | 58,241,240 | 20 |
| 1959 | 2,970,292,188 | 1.86% | 54,184,091 | 20 |
| 1960 | 3,019,233,434 | 1.65% | 48,941,246 | 20 |
| 1961 | 3,068,370,609 | 1.63% | 49,137,175 | 21 |
| 1962 | 3,126,686,743 | 1.90% | 58,316,134 | 21 |
| 1963 | 3,195,779,247 | 2.21% | 69,092,504 | 21 |
| 1964 | 3,267,212,338 | 2.24% | 71,433,091 | 22 |
| 1965 | 3,337,111,983 | 2.14% | 69,899,645 | 22 |
| 1966 | 3,406,417,036 | 2.08% | 69,305,053 | 23 |
| 1967 | 3,475,448,166 | 2.03% | 69,031,130 | 23 |
| 1968 | 3,546,810,808 | 2.05% | 71,362,642 | 24 |
| 1969 | 3,620,655,275 | 2.08% | 73,844,467 | 24 |
| 1970 | 3,695,390,336 | 2.06% | 74,735,061 | 25 |
| 1971 | 3,770,163,092 | 2.02% | 74,772,756 | 25 |
| 1972 | 3,844,800,885 | 1.98% | 74,637,793 | 26 |
| 1973 | 3,920,251,504 | 1.96% | 75,450,619 | 26 |
| 1974 | 3,995,517,077 | 1.92% | 75,265,573 | 27 |
| 1975 | 4,069,437,231 | 1.85% | 73,920,154 | 27 |
| 1976 | 4,142,505,882 | 1.80% | 73,068,651 | 28 |
| 1977 | 4,215,772,490 | 1.77% | 73,266,608 | 28 |
| 1978 | 4,289,657,708 | 1.75% | 73,885,218 | 29 |
| 1979 | 4,365,582,871 | 1.77% | 75,925,163 | 29 |
| 1980 | 4,444,007,706 | 1.80% | 78,424,835 | 30 |
| 1981 | 4,524,627,658 | 1.81% | 80,619,952 | 30 |
| 1982 | 4,607,984,871 | 1.84% | 83,357,213 | 31 |
| 1983 | 4,691,884,238 | 1.82% | 83,899,367 | 32 |
| 1984 | 4,775,836,074 | 1.79% | 83,951,836 | 32 |
| 1985 | 4,861,730,613 | 1.80% | 85,894,539 | 33 |
| 1986 | 4,950,063,339 | 1.82% | 88,332,726 | 33 |
| 1987 | 5,040,984,495 | 1.84% | 90,921,156 | 34 |
| 1988 | 5,132,293,974 | 1.81% | 91,309,479 | 34 |
| 1989 | 5,223,704,308 | 1.78% | 91,410,334 | 35 |
| 1990 | 5,316,175,862 | 1.77% | 92,471,554 | 36 |
| 1991 | 5,406,245,867 | 1.69% | 90,070,005 | 36 |
| 1992 | 5,492,686,093 | 1.60% | 86,440,226 | 37 |
| 1993 | 5,577,433,523 | 1.54% | 84,747,430 | 37 |
| 1994 | 5,660,727,993 | 1.49% | 83,294,470 | 38 |
| 1995 | 5,743,219,454 | 1.46% | 82,491,461 | 39 |
| 1996 | 5,825,145,298 | 1.43% | 81,925,844 | 39 |
| 1997 | 5,906,481,261 | 1.40% | 81,335,963 | 40 |
| 1998 | 5,987,312,480 | 1.37% | 80,831,219 | 40 |
| 1999 | 6,067,758,458 | 1.34% | 80,445,978 | 41 |
| 2000 | 6,148,898,975 | 1.34% | 81,140,517 | 41 |
| 2001 | 6,230,746,982 | 1.33% | 81,848,007 | 42 |
| 2002 | 6,312,407,360 | 1.31% | 81,660,378 | 42 |
| 2003 | 6,393,898,365 | 1.29% | 81,491,005 | 43 |
| 2004 | 6,475,751,478 | 1.28% | 81,853,113 | 43 |
| 2005 | 6,558,176,119 | 1.27% | 82,424,641 | 44 |
| 2006 | 6,641,416,218 | 1.27% | 83,240,099 | 45 |
| 2007 | 6,725,948,544 | 1.27% | 84,532,326 | 45 |
| 2008 | 6,811,597,272 | 1.27% | 85,648,728 | 46 |
| 2009 | 6,898,305,908 | 1.27% | 86,708,636 | 46 |
| 2010 | 6,985,603,105 | 1.27% | 87,297,197 | 47 |
| 2011 | 7,073,125,425 | 1.25% | 87,522,320 | 47 |
| 2012 | 7,161,697,921 | 1.25% | 88,572,496 | 48 |
| 2013 | 7,250,593,370 | 1.24% | 88,895,449 | 49 |
| 2014 | 7,339,013,419 | 1.22% | 88,420,049 | 49 |
| 2015 | 7,426,597,537 | 1.19% | 87,584,118 | 50 |
| 2016 | 7,513,474,238 | 1.17% | 86,876,701 | 50 |
| 2017 | 7,599,822,404 | 1.15% | 86,348,166 | 51 |
| 2018 | 7,683,789,828 | 1.10% | 83,967,424 | 52 |
| 2019 | 7,764,951,032 | 1.06% | 81,161,204 | 52 |
| 2020 | 7,840,952,880 | 0.98% | 76,001,848 | 53 |
| 2021 | 7,909,295,151 | 0.87% | 68,342,271 | 53 |
| 2022 | 7,975,105,156 | 0.83% | 65,810,005 | 54 |
| 2023 | 8,045,311,447 | 0.88% | 70,206,291 | 54 |
Future Population Predictions
It's hard to guess how much the global population will grow in the long term. The United Nations and the US Census Bureau often have slightly different estimates. For example, the UN said the world population reached seven billion in late 2011, while the US Census Bureau said it happened in March 2012.
Since 1951, the UN has made many predictions about future world population, based on different ideas. From 2000 to 2005, they kept lowering their predictions. But in 2006, they raised their estimate for 2050 by 273 million people.
Predicting future populations is tricky because global birth rates and death rates are changing quickly. These rates are very different between developed countries (where birth and death rates are often low) and developing countries (where they are usually higher). Also, different ethnic groups have different birth rates. All these numbers can change fast due to diseases, wars, or new medical discoveries.
The UN's first report in 1951 showed that between 1950 and 1955, about 36.9 babies were born for every 1,000 people, and 19.1 people died for every 1,000. By 2015–2020, both numbers had dropped a lot: 18.5 births and 7.5 deaths per 1,000 people. UN predictions for 2100 show births dropping further to 11.6 per 1,000 and deaths rising to 11.2 per 1,000.
The total number of births worldwide is currently (2015–2020) 140 million per year. This is expected to reach its highest point between 2040 and 2045 at 141 million per year. Then it will slowly drop to 126 million per year by 2100. The total number of deaths is currently 57 million per year and is expected to grow steadily to 121 million per year by 2100.
UN predictions from 2012 show that the population will keep growing in the near future, but the growth rate will slow down. The global population is expected to be between 8.3 and 10.9 billion by 2050. Some experts worry about how much more the world population can grow. They point out the increasing pressure on the environment, food supplies, and energy resources.
| Year | UN est. (millions) |
Difference | USCB est. (millions) |
Difference |
|---|---|---|---|---|
| 2005 | 6,542 | – | 6,473 | – |
| 2010 | 6,957 | 415 | 6,866 | 393 |
| 2015 | 7,380 | 423 | 7,256 | 390 |
| 2020 | 7,795 | 415 | 7,643 | 380 |
| 2025 | 8,184 | 390 | 8,007 | 363 |
| 2030 | 8,549 | 364 | 8,341 | 334 |
| 2035 | 8,888 | 339 | 8,646 | 306 |
| 2040 | 9,199 | 311 | 8,926 | 280 |
| 2045 | 9,482 | 283 | 9,180 | 254 |
| 2050 | 9,735 | 253 | 9,408 | 228 |
| Year | World | Asia | Africa | Europe | Latin America/Caribbean | Northern America | Oceania |
|---|---|---|---|---|---|---|---|
| 2000 | 6,144 | 3,741 (60.9%) | 811 (13.2%) | 726 (11.8%) | 522 (8.5%) | 312 (5.1%) | 31 (0.5%) |
| 2005 | 6,542 | 3,978 (60.8%) | 916 (14.0%) | 729 (11.2%) | 558 (8.5%) | 327 (5.0%) | 34 (0.5%) |
| 2010 | 6,957 | 4,210 (60.5%) | 1,039 (14.9%) | 736 (10.6%) | 591 (8.5%) | 343 (4.9%) | 37 (0.5%) |
| 2015 | 7,380 | 4,434 (60.1%) | 1,182 (16.0%) | 743 (10.1%) | 624 (8.5%) | 357 (4.8%) | 40 (0.5%) |
| 2020 | 7,795 | 4,641 (59.5%) | 1,341 (17.2%) | 748 (9.6%) | 654 (8.4%) | 369 (4.7%) | 43 (0.6%) |
| 2025 | 8,184 | 4,823 (58.9%) | 1,509 (18.4%) | 746 (9.1%) | 682 (8.3%) | 380 (4.6%) | 45 (0.6%) |
| 2030 | 8,549 | 4,974 (58.2%) | 1,688 (19.8%) | 741 (8.7%) | 706 (8.3%) | 391 (4.6%) | 48 (0.6%) |
| 2035 | 8,888 | 5,096 (57.3%) | 1,878 (21.1%) | 735 (8.3%) | 726 (8.2%) | 401 (4.5%) | 50 (0.6%) |
| 2040 | 9,199 | 5,189 (56.4%) | 2,077 (22.6%) | 728 (7.9%) | 742 (8.1%) | 410 (4.5%) | 53 (0.6%) |
| 2045 | 9,482 | 5,253 (55.4%) | 2,282 (24.1%) | 720 (7.6%) | 754 (8.0%) | 418 (4.4%) | 55 (0.6%) |
| 2050 | 9,735 | 5,290 (54.3%) | 2,489 (25.6%) | 711 (7.3%) | 762 (7.8%) | 425 (4.4%) | 57 (0.6%) |
| 2055 | 9,958 | 5,302 (53.2%) | 2,698 (27.1%) | 700 (7.0%) | 767 (7.7%) | 432 (4.3%) | 60 (0.6%) |
| 2060 | 10,152 | 5,289 (52.1%) | 2,905 (28.6%) | 689 (6.8%) | 768 (7.6%) | 439 (4.3%) | 62 (0.6%) |
| 2065 | 10,318 | 5,256 (51.0%) | 3,109 (30.1%) | 677 (6.6%) | 765 (7.4%) | 447 (4.3%) | 64 (0.6%) |
| 2070 | 10,459 | 5,207 (49.8%) | 3,308 (31.6%) | 667 (6.4%) | 759 (7.3%) | 454 (4.3%) | 66 (0.6%) |
| 2075 | 10,577 | 5,143 (48.6%) | 3,499 (33.1%) | 657 (6.2%) | 750 (7.1%) | 461 (4.4%) | 67 (0.6%) |
| 2080 | 10,674 | 5,068 (47.5%) | 3,681 (34.5%) | 650 (6.1%) | 739 (6.9%) | 468 (4.4%) | 69 (0.7%) |
| 2085 | 10,750 | 4,987 (46.4%) | 3,851 (35.8%) | 643 (6.0%) | 726 (6.8%) | 474 (4.4%) | 71 (0.7%) |
| 2090 | 10,810 | 4,901 (45.3%) | 4,008 (37.1%) | 638 (5.9%) | 711 (6.6%) | 479 (4.4%) | 72 (0.7%) |
| 2095 | 10,852 | 4,812 (44.3%) | 4,152 (38.3%) | 634 (5.8%) | 696 (6.4%) | 485 (4.5%) | 74 (0.7%) |
| 2100 | 10,875 | 4,719 (43.4%) | 4,280 (39.4%) | 630 (5.8%) | 680 (6.3%) | 491 (4.5%) | 75 (0.7%) |
Images for kids
-

Estimated world population figures, 10,000 BC – AD 2000
-
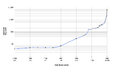
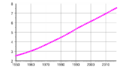
Estimated world population figures, 10,000 BC – AD 2000 (in log y scale)
-
World population figures, 1950–2017

.png)

See also
 In Spanish: Población mundial para niños
- Demographics of the world
- Coastal population growth
- Demographic transition
- Family planning
- Food security
- Human overpopulation
- Megacity
- Population decline
- Population dynamics
- Population growth
