
California State Water Project facts for kids

Map showing major features of the project (SWP reservoirs in blue, SWP/CVP reservoirs in purple, and other connected facilities in light blue)
|
|
| General statistics | |
|---|---|
| Begun | 1960 |
| Storage dams | 10 |
| Additional dams | 4 (reregulation) 4 (hydroelectric) 2 (flood control) 1 (mitigation/conservation) |
| Power plants | 5 conventional 3 pumped-storage |
| Canals | 701.5 miles (1,129.0 km) |
| Operations | |
| Storage capacity | 5,746,790 acre-feet (7.08856×10⁹ m3) |
| Annual water yield | 2,400,000 acre-feet (3.0×10⁹ m3) |
| Land irrigated | 750,000 acres (300,000 ha) |
| Power plant capacity | 2,991.7 MW |
| Annual generation | 6500 GWh |
| Annual consumption | 11500 GWh |
| Constituencies served | Greater Los Angeles Area Greater San Diego Inland Empire San Francisco Bay Area North Bay Santa Clara Valley South Bay Central Coast San Joaquin Valley |
The California State Water Project, also known as the SWP, is a huge water system in California. It is managed by the California Department of Water Resources. The SWP is one of the biggest public water and power systems in the world. It provides drinking water for over 23 million people. It also creates about 6,500 GWh of hydroelectricity each year. But the project uses a lot of power itself, so its net use is 5,100 GWh.
The SWP gathers water from rivers in Northern California. Then, it sends this water to cities in Southern California and the San Francisco Bay Area. It uses a large network of canals, pumping stations, and power plants to do this. About 70% of the water goes to cities and industries. The other 30% is used for farming in the Central Valley. To get water to Southern California, it must be pumped 2,882 feet (878 m) over the Tehachapi Mountains. The Edmonston Pumping Plant alone lifts water 1,926 feet (587 m). This is the highest single water lift in the world.
The SWP works with the federal Central Valley Project (CVP). The CVP mainly helps farmers. Water can be shared between the SWP and CVP canals. This helps meet water needs for everyone. The SWP brings about $400 billion to California's economy each year.
Since it started in 1960, the SWP has built 21 dams. It also built over 700 miles (1,100 km) of canals, pipes, and tunnels. This is only a part of what was first planned. Because of this, the project delivers less water than expected. Environmental worries about taking water from the Sacramento–San Joaquin River Delta have also reduced water delivery. This delta is a sensitive estuary area. Work continues today to deliver more water. They also look for ways to protect the environment.
Contents
History of the Project
The main goal of the project was to bring water to dry Southern California. The area was growing fast. But it did not have enough local water or water from the Colorado River. The idea for the SWP came from two plans. One was the United Western Investigation of 1951. This study looked at moving water between different river basins in the Western U.S. In California, it suggested building dams on North Coast rivers. These rivers included the Klamath, Eel, Mad, and Smith River. Tunnels would carry water to the Sacramento River. From there, it would go south.


In the same year, State Engineer A.D. Edmonston suggested the Feather River Project. This plan proposed building a dam on the Feather River. This river is a branch of the Sacramento River. The Feather River was easier to reach than the North Coast rivers. But it had less water. Both plans included canals and pumps. These would carry water south through the Central Valley. The water would then go through the Tehachapi Tunnel to Southern California.
In 1956, the California Department of Water Resources was created. This was to manage water across the state. In 1957, the California Water Plan was made. It was meant to "control, protect, save, and use California's waters." This was to meet water needs for everyone. California Governor Pat Brown said it would "correct an accident of people and geography." This meant that people lived where there wasn't much water.
The idea of moving water from the North Coast rivers was stopped early on. Local people strongly opposed it. There were also worries about how it would affect salmon in those rivers. So, the California Water Plan focused on the Feather River. The Burns-Porter Act of 1959 provided $1.75 billion to start the project. This money came from a bond measure. Construction on the first part of the project began in 1960. This part would deliver the first 2.23 million acre-feet (2.75 km3) of water.
People in Northern California did not like the plan. They thought it was a waste of money and that their water would be stolen. Even Los Angeles, which would get a lot of water, was against it. Some historians say that large farming businesses helped the Burns-Porter Act pass. The vote was very close. It passed by only 174,000 votes out of 5.8 million.
In 1961, work began on Oroville Dam. In 1963, construction started on the California Aqueduct and San Luis Reservoir. Water reached the Bay Area in 1962. It got to the San Joaquin Valley by 1968. The plan for a tunnel through the Tehachapi Mountains was changed. The area had many faults. So, water had to be pumped over the mountains' 3,500-foot (1,100 m) crest. In 1973, the pumps and the East and West branches of the aqueduct were finished. Water first reached Southern California then.
A Peripheral Canal was planned to carry SWP water around the Sacramento–San Joaquin River Delta. This delta is very sensitive. But the canal idea was rejected in 1982 due to environmental worries. The Coastal Branch, which sends water to central California, was finished in 1997.
How the Project Works
Feather River Facilities

The Feather River is the main source of water for the State Water Project. Water from the Feather River's upper parts is collected in three reservoirs. These are Antelope, Frenchman, and Davis reservoirs. They hold about 162,000 acre-feet (0.200 km3) of water together.
Water from these upper reservoirs flows into Lake Oroville. This lake is formed by the Oroville Dam. Oroville Dam is 770 feet (230 m) tall, making it the tallest dam in the United States. It is also the largest dam in California by volume. The dam was built between 1961 and 1967. Lake Oroville can hold about 3.54 million acre-feet (4.37 km3) of water. This is 61% of the SWP's total storage. It is the most important reservoir for the project.
Water from Lake Oroville goes through the Edward Hyatt pumped-storage powerplant. This plant makes 819 MW of power. Two other power plants are downstream of Oroville Dam. They are part of the Oroville-Thermalito Complex. The Thermalito Forebay and Afterbay help the 120 MW Thermalito Pumping-Generating Plant. A smaller 3.3 MW plant is at the Thermalito Diversion Dam. This whole system creates about 2.2 billion kilowatt hours each year. This is about one-third of all power made by SWP facilities.
Delta Facilities
Water flows from Oroville down the Feather and Sacramento Rivers. It reaches the Sacramento–San Joaquin River Delta. North of Rio Vista, about 120,000 acre-feet (0.15 km3) of water is pumped each year. It goes into the 27.4-mile (44.1 km) North Bay Aqueduct. This aqueduct was finished in 1988. It sends water to Napa and Solano counties.

Most of the SWP water enters the Clifton Court Forebay. This is on the southern end of the Delta. From here, the Harvey O. Banks Pumping Plant lifts water 224 feet (68 m) into the California Aqueduct. This plant was finished in 1963. Its eleven pumps can lift up to 10,670 cu ft/s (302 m3/s) of water.
The water then flows south along the California Aqueduct to Bethany Reservoir. The South Bay Pumping Plant sends water to the South Bay Aqueduct. This aqueduct has delivered water to Alameda County since 1962. It has also served Santa Clara County since 1965. The aqueduct carries up to 188,000 acre⋅ft (0.232 km3) per year. Up to 77,100 acre⋅ft (0.0951 km3) of this water can be stored in Lake Del Valle. This is a reservoir near Livermore.
California Aqueduct
The main part of the SWP water travels south through the California Aqueduct. This aqueduct runs along the western side of the San Joaquin Valley. It carries between 1 to 3.7 million acre-feet (1.2 to 4.6 km3) of water each year. The main section of the aqueduct is 304 miles (489 km) long. It is mostly concrete-lined canals. But it also has tunnels, pipelines, and siphons. The aqueduct can be up to 300 feet (91 m) wide and 30 feet (9.1 m) deep. Some parts can deliver over 13,000 cu ft/s (370 m3/s) of water. Along the aqueduct in the San Joaquin Valley, water is released to irrigate about 750,000 acres (300,000 ha) of farmland.


The aqueduct enters the O'Neill Forebay reservoir. From here, water can be pumped into San Luis Reservoir. This is a huge storage facility formed by the B.F. Sisk Dam. San Luis Reservoir is shared by the SWP and the federal Central Valley Project. Water can be moved between the California Aqueduct and Delta-Mendota Canal here. This helps manage changing water needs. The SWP owns 50% of the 2.04 million acre-feet (2.52 km3) storage in San Luis Reservoir.
South of San Luis Reservoir, the aqueduct gains height. It uses several large pumping plants. The Dos Amigos Pumping Plant lifts water 118 feet (36 m). Near Kettleman City, the Coastal Branch splits off. Buena Vista, Teerink, and Chrisman Pumping Plants are near Bakersfield. Then, the aqueduct reaches the A.D. Edmonston Pumping Plant. This plant lifts water 1,926 feet (587 m) over the Tehachapi Mountains. These mountains separate the San Joaquin Valley from Southern California. It is the highest pump-lift in the SWP. It can move 4,480 cu ft/s (127 m3/s) of water.
After crossing the Tehachapis, the aqueduct goes through tunnels. It reaches the Tehachapi Afterbay. Here, the water splits into the West and East Branches.
Coastal Branch
The Coastal Branch sends about 48,000 acre⋅ft (0.059 km3) of water each year. It goes to parts of San Luis Obispo and Santa Barbara counties. This aqueduct is 143 miles (230 km) long. It is mostly buried pipeline. Pumping plants lift the water over the California Coast Ranges. These plants include Las Perillas, Badger Hill, Devil's Den, Bluestone, and Polonio Pass. After the mountains, the water is regulated in small reservoirs. The Coastal Branch was finished in 1994. It was built after a severe drought.
The Coastal Branch also supplies water to Lake Cachuma. This is a 205,000 acre⋅ft (0.253 km3) reservoir on the Santa Ynez River. This happens through a pipeline finished in 1997.
West Branch

The West Branch starts at Tehachapi Afterbay. It carries water to Quail Lake. The Oso Pumping Plant helps move the water. Then, water flows by gravity to the 78 MW William E. Warne Powerplant. This plant is on the 180,000 acre⋅ft (0.22 km3) Pyramid Lake reservoir. The West Branch delivered about 537,000 acre⋅ft (0.662 km3) per year from 1995 to 2010.
From Pyramid Lake, water goes through the Angeles Tunnel. It reaches the Castaic Power Plant and Castaic Lake. Castaic Lake is a 325,000 acre⋅ft (0.401 km3) reservoir near Santa Clarita. Castaic Power Plant is a pumped-storage hydroelectric plant. It can make 1,247 MW of power during peak times. Pyramid and Castaic Lakes store most of the West Branch water for Southern California. Water is supplied to cities in Los Angeles and Ventura counties.
East Branch
The East Branch takes water from Tehachapi Afterbay. It runs along the north side of the San Gabriel Mountains and San Bernardino Mountains. It goes to the Silverwood Lake reservoir, which holds 73,000 acre⋅ft (0.090 km3). From there, it goes through a tunnel under the San Bernardino Mountains. It reaches the Devil Canyon Powerplant. This is the largest "recovery plant" of the SWP. Water then flows 28 miles (45 km) through the Santa Ana Tunnel to Lake Perris. This lake can store up to 131,400 acre⋅ft (0.1621 km3).
Water deliveries through the East Branch averaged 995,000 acre⋅ft (1.227 km3) per year from 1995 to 2012. The East Branch mainly provides water for cities and farms in the Inland Empire, Orange County, and other areas south of Los Angeles. The Metropolitan Water District of Southern California gets a lot of its SWP water through Lake Perris. Water also goes to the San Diego Aqueduct from Perris to Lake Skinner.
Future Plans and Unbuilt Features
North Coast Diversions
The first California Water Plan in 1957 included dams on North Coast rivers. These rivers were the Klamath, Eel, Mad, and Smith Rivers. They get a lot of rain and send over 26 million acre-feet (32 km3) of water to the Pacific each year. This is more than the entire Sacramento River system. The plan was like a project by the U.S. Bureau of Reclamation called the Klamath Diversion.

A series of dams would move water into the Klamath River system. The main part of the project was a 15-million-acre-foot (19 km3) reservoir on the Klamath River. This would be the largest man-made lake in California. From there, water would flow through the 60-mile (97 km) Trinity Tunnel into the Sacramento River. Then it would go to the SWP canals. This would provide between 5 and 10 million acre-feet (6.2 and 12.3 km3) of water each year for the SWP. But the idea of moving water from the North Coast rivers was dropped from the first SWP plan.
In the mid-1960s, big floods made people think again about damming the North Coast rivers. The Department of Water Resources worked with other groups. They wanted to build projects to control floods. These projects would also divert water into the SWP. Most of these plans failed due to political arguments. But one idea that stayed was the Dos Rios Project on the Eel River. This would build a huge dam on the Middle Fork of the Eel River. It would divert water through the Grindstone Tunnel into the Sacramento Valley. Supporters said it would help with floods, like the bad Christmas flood of 1964.
People in local towns and Native American tribes strongly opposed the Klamath and Dos Rios diversions. Their land would be flooded by the reservoirs. Fishermen worried about how the dams would affect salmon runs. The project would destroy 98% of the salmon spawning grounds on the Klamath. California Governor Ronald Reagan did not approve the Dos Rios project. He said it was too expensive and that its benefits were exaggerated. For example, the Dos Rios dam would have only reduced the 1964 Eel River flood by 8 inches (20 cm).
In 1980, the North Coast rivers became part of the National Wild and Scenic Rivers system. This stopped any future projects to divert them.
Peripheral Canal
The Peripheral Canal, now called the California WaterFix, was a planned tunnel project. It would go through the center of the Delta, 150 feet (46 m) underground. Earlier plans were for a canal to go around the Delta to the east. This is why it was called the Peripheral Canal. It would take water from the Sacramento River to bypass the Sacramento–San Joaquin River Delta. This delta is a huge estuary with over 700 miles (1,100 km) of waterways.
Supporters of the canal included farmers in the Central Valley and urban developers in Los Angeles. They benefit from the water. Supporters said it would stop the need to pull water directly through the sensitive Delta. This would reduce salt in the water during dry seasons. The canal was part of the first SWP plan. Not having the canal is a main reason the SWP has not delivered all its planned water.
Opponents believed the project would harm the Delta's ecosystem, farms, and communities. They also worried about long-term damage to the Delta. They feared that fresh water would be removed before it could flow naturally to the San Francisco Bay.
Governor Jerry Brown supported the canal. He wanted to finish this project during his time as governor. Supporters of the canal argue that taking water from the southern intakes causes problems for wildlife. They say drawing water further north would fix this. Supporters also say that California's levees are at risk from earthquakes. Moving water away from them would protect the water supply. Delta farmers, communities, and fishermen are very worried about the canal. Some scientists disagree. The new canal would move 1 million acre-feet (1.2 km3) of water to Silicon Valley, Southern California, and mostly to the Central Valley.
Sites Reservoir
Since the 1980s, there has been interest in building a large off-stream reservoir in the Sacramento Valley. This is called Sites Reservoir. Water would be "skimmed" from high winter flows in the Sacramento River. It would be pumped into this storage basin. The reservoir would hold about 1.8 million acre-feet (2.2 km3) of water. This water would be released into the Sacramento River during dry times. This would increase the water supply for SWP users. It would also improve water quality in the Sacramento–San Joaquin Delta.
Sites Reservoir would greatly improve California's water system. It would provide 470,000 to 640,000 acre⋅ft (0.58 to 0.79 km3) of new water each year. The Department of Water Resources is seriously considering this project. California's water system is expected to have a shortage of 2 million acre-feet (2.5 km3) per year by 2020. However, the project has been criticized for its high cost. There are also worries about how it might affect fish migration. This could happen if large amounts of water are taken from the Sacramento River during the wet season.
Los Banos Grandes
The Los Banos Grandes reservoir was first suggested in 1983. It would have been like Sites Reservoir. The 1.73 million acre-feet (2.13 km3) reservoir would be along the California Aqueduct. It would be south of San Luis Reservoir. It would store water during wet years. This is when extra water could be pumped from the Sacramento–San Joaquin Delta. Pumped-storage hydroelectric plants would be built there. The current status of Los Banos Grandes is not clear. The DWR has not been able to get funding since the 1990s.
Project Data
Dams and Reservoirs
![]() Background color denotes facility shared with Central Valley Project.
Background color denotes facility shared with Central Valley Project.
| Dam | Reservoir | Year | Capacity | Stream | Purpose | |
|---|---|---|---|---|---|---|
| acre.ft | dam3 | |||||
| Antelope Dam | Antelope Lake | 1964 | 47,466 | 58,548 | Indian Creek | Storage |
| B.F. Sisk Dam |
San Luis Reservoir|1967 | 1,020,500 | 1,258,800 | San Luis Creek/ California Aqueduct |
Storage | |
| Bethany Dam | Bethany Reservoir | 1967 | 5,250 | 6,480 | California Aqueduct | Reregulation |
| Castaic Dam | Castaic Lake | 1973 | 325,000 | 401,000 | Castaic Creek/ West Branch California Aqueduct |
Storage |
| Cedar Springs Dam | Silverwood Lake | 1971 | 73,000 | 90,000 | West Fork Mojave River/ East Branch California Aqueduct |
Storage |
| Del Valle Dam | Lake Del Valle/ South Bay Aqueduct |
1968 | 77,000 | 95,000 | Arroyo Valle | Storage |
| Elderberry Forebay Dam | Elderberry Forebay | 1974 | 24,800 | 30,600 | Castaic Creek/ West Branch California Aqueduct |
Power Reregulation |
| Fish Barrier Dam | 1964 | Feather River | Mitigation | |||
| Frenchman Dam | Frenchman Lake | 1961 | 55,477 | 68,430 | Little Last Chance Creek | Storage |
| Grizzly Valley Dam | Lake Davis | 1966 | 83,000 | 102,000 | Big Grizzly Creek | Storage |
| Little Panoche Detention Dam |
Little Panoche Reservoir | 1966 | 5,580 | 6,880 | Little Panoche Creek | Flood control |
| Los Banos Detention Dam |
Los Banos Reservoir | 1965 | 34,600 | 42,700 | Los Banos Creek | Flood control |
| O'Neill Dam |
O'Neill Forebay | 1967 | 56,400 | 69,600 | San Luis Creek/ California Aqueduct |
Reregulation |
| Oroville Dam | Lake Oroville | 1968 | 3,537,577 | 4,363,537 | Feather River | Storage Power Flood control |
| Perris Dam | Lake Perris | 1973 | 131,400 | 162,100 | East Branch California Aqueduct | Storage |
| Pyramid Dam | Pyramid Lake | 1970 | 180,000 | 220,000 | Piru Creek/ West Branch California Aqueduct |
Storage Power |
| Quail Lake Dam | Quail Lake | 7,580 | 9,350 | West Branch California Aqueduct | Reregulation | |
| Tehachapi Afterbay Dam | Tehachapi Afterbay | California Aqueduct | Reregulation | |||
| Thermalito Afterbay Dam | Thermalito Afterbay | 1968 | 57,040 | 70,360 | Offstream | Power Storage |
| Thermalito Diversion Dam | Diversion Pool | 1968 | 13,350 | 16,470 | Feather River | Power |
| Thermalito Forebay Dam | Thermalito Forebay | 1968 | 11,770 | 14,520 | Offstream | Power |
| Total | 5,746,790 | 7,088,560 | ||||
*This is the portion of total capacity of San Luis Reservoir allocated to SWP; the total capacity is 2,041,000 acre⋅ft (2,518,000 dam3)
Aqueducts
| Aqueduct | Length | Annual deliveries | Areas served | ||
|---|---|---|---|---|---|
| mi | km | acre.ft | dam3 | ||
| California Aqueduct | 304 | 489 | 2,300,000 | 2,800,000 | San Joaquin Valley All SWP aqueducts except for North Bay |
| Coastal Branch California Aqueduct | 143 | 230 | 48,000 | 59,000 | San Luis Obispo County Santa Barbara County |
| East Branch California Aqueduct | 140 | 230 | 995,000 | 1,227,000 | Riverside County San Bernardino County Orange County |
| North Bay Aqueduct | 27.4 | 44.1 | 120,000 | 150,000 | Napa County Solano County |
| South Bay Aqueduct | 188,000 | 232,000 | Alameda County Santa Clara County |
||
| West Branch California Aqueduct | 24.7 | 39.8 | 537,000 | 662,000 | Ventura County Los Angeles County |
Pump Plants
| Pumping plants | |||
|---|---|---|---|
| Name | Aqueduct | Lift | |
| ft | m | ||
| Banks | California Aqueduct | 244 | 74 |
| Dos Amigos | California Aqueduct | 118 | 36 |
| Buena Vista | California Aqueduct | 205 | 62 |
| Teerink | California Aqueduct | 233 | 71 |
| Chrisman | California Aqueduct | 518 | 158 |
| Edmonston | California Aqueduct | 1,926 | 587 |
| Pearblossom | East Branch California Aqueduct | 540 | 160 |
| Las Perillas | Coastal Branch California Aqueduct | 55 | 17 |
| Badger Hill | Coastal Branch California Aqueduct | 151 | 46 |
| Devil's Den | Coastal Branch California Aqueduct | 521 | 159 |
| Bluestone | Coastal Branch California Aqueduct | 484 | 148 |
| Polonio Pass | Coastal Branch California Aqueduct | 533 | 162 |
| Barker Slough | North Bay Aqueduct | 120 | 37 |
| Cordelia | North Bay Aqueduct | 138 | 42 |
| South Bay | South Bay Aqueduct | 566 | 173 |
| Del Valle | South Bay Aqueduct | 38 | 12 |
| Oso | West Branch California Aqueduct | 231 | 70 |
| Pearblossom | East Branch California Aqueduct | 540 | 160 |
Power Plants
| Name | Watercourse | Capacity | Annual generation (2010) |
Type |
|---|---|---|---|---|
| Alamo | East Branch California Aqueduct | 17 MW | 79 GWh | Recovery |
| Castaic | West Branch California Aqueduct | 1,247 MW | 624 GWh | Pumped-storage |
| Devil Canyon | East Branch California Aqueduct | 240 MW | 993 GWh | Recovery |
| Foothill Feeder | West Branch California Aqueduct | 11 MW | 47 GWh | Recovery |
| Gianelli (San Luis) | Offstream | 424 MW | 200 GWh | Pumped-storage |
| Hyatt (Oroville) | Feather River | 819 MW | 1,386 GWh | Pumped-storage |
| Mojave Siphon | East Branch California Aqueduct | 32.4 MW | 63 GWh | Recovery |
| Thermalito | Offstream | 120 MW | 179 GWh | Pumped-storage |
| Thermalito Diversion | Feather River | 3.3 MW | 10 GWh | Conventional |
| Warne | West Branch California Aqueduct | 78 MW | 266 GWh | Recovery |
| 2,991.7 MW |
- Conventional: Power plant utilizing flow of river or stream through dam
- Pumped-storage: See Pumped-storage hydroelectricity
- Recovery: Power plant utilizing flow of aqueduct or canal
Images for kids
-
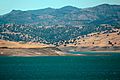
San Luis Reservoir in July 2021

