
Illinois's 1st congressional district facts for kids
Quick facts for kids Illinois's 1st congressional district |
|||
|---|---|---|---|
| Representative |
|
||
| Area | 621.6 sq mi (1,610 km2) | ||
| Population (2022) | 728,550 | ||
| Median income | $64,107 | ||
| Ethnicity | |||
| Cook PVI | D+20 | ||
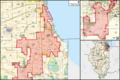
Illinois's first congressional district is a special area in the U.S. state of Illinois. It's where people vote for their representative in the U.S. House of Representatives. This district covers a big part of the South Side of Chicago in Cook County. It also stretches southwest towards Joliet.
For many years, this district was one of the smallest in the U.S. It was also known for having a very large African American population. In fact, it used to have the highest percentage of African Americans of any district in the country. Even former U.S. President Barack Obama lived in this district.
This district has been a "majority-minority" district for a long time. This means that most of its residents belong to a racial or ethnic minority group. Since 1929, the district has always been represented by an African American in Congress. This is the longest time any seat in the House of Representatives has had continuous Black representation.
The district has been represented by a Democrat since 1935. This was when Arthur Mitchell, the first African American Democrat elected to Congress, took the seat. Later, in 1949, William Dawson became the first African American to lead a congressional committee.
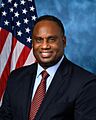
Today, the district is represented by Jonathan Jackson. He was elected in 2022, taking over from Bobby Rush, who had served for a long time.
Contents
Understanding District Boundaries
Congressional districts are like special zones drawn on a map. Each district sends one person to represent its people in the U.S. House of Representatives. These boundaries change over time, usually after the U.S. census every ten years. This is called "redistricting."
How the District Has Changed Over Time
The 1st district was first created in 1833. This was even before Chicago became a town! At first, it covered a large area of Illinois. Over the years, its boundaries shifted a lot.
Since 1883, the district has mainly included parts of Chicago's South Side. This area has seen many different groups of people move in over history. In the past, many Irish, German, and Eastern European immigrants lived here.
The Great Migration and Population Shifts
Starting in the mid-19th century, many African Americans moved to Chicago from the rural South. This was part of a big movement called the Great Migration. Because of unfair rules and practices, they often had to live in the South Side of Chicago. Over time, they became the main population group in the district.
At one point in the 1980s, more than 90% of the people living in the district were Black. While the district lines have been redrawn since then, it still has a large African American population.
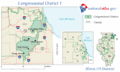
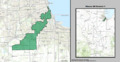
Where the District Is Today
The 1st district is still mostly in Cook County. It covers many neighborhoods in Chicago, like Auburn Gresham, Burnside, Chatham, and Greater Grand Crossing. It also includes parts of West Englewood and Englewood. The southern part of Kenwood, where former President Barack Obama lived, is also in this district.
Outside of Chicago, the district includes towns like Crestwood, Evergreen Park, Midlothian, Posen, and Robbins. It also reaches into Will County and a small part of Kankakee County.
District Demographics
The 1st district has a diverse population. While it has historically been a Black-majority district, redistricting has changed the percentages over time. In the 1950s, the district was very small, covering only nine square miles. Now, it's more than ten times that size! This expansion was needed as the population on the South Side decreased.
The district's population dropped in the 1950s, 1970s, and 1980s. This was because people moved to the suburbs and jobs were lost. Even though Chicago is still home to most of the district's residents, a large part of the district's land area is now outside the city.
The white population in the district lives mostly in the suburban areas and in some Chicago neighborhoods like Hyde Park. The largest white ethnic groups include Irish, German, Polish, and Italian Americans. There are also smaller groups like Dutch, Swedish, Czech, Palestinian, Greek, and Lithuanian Americans, especially in towns like Oak Forest, Orland Park, and Tinley Park.
The Kenwood-Hyde Park area has a history of having a significant Jewish community. This area is also home to the leader of the Nation of Islam, Louis Farrakhan.
Politics in the District
The 1st district is a very strong area for the Democratic Party. Democrats almost always win elections here. The real competition is usually in the Democratic primary election, where different Democrats run against each other.
Since the 1970s, the district has often elected representatives who sometimes disagreed with the main Democratic leaders in Chicago. For example, Ralph Metcalfe broke away from Mayor Richard J. Daley over an issue with police actions.
Key Representatives and Their Impact
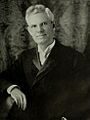
- Oscar Stanton De Priest (Republican): In 1929, he became the first African American elected to Congress in the 20th century. This was a very important moment for civil rights.
- Arthur W. Mitchell (Democrat): He was the first African American Democrat elected to Congress in 1935.
- William L. Dawson (Democrat): He was a powerful figure who served for many years. He became the first African American to lead a congressional committee.
- Harold Washington (Democrat): He served in Congress before becoming the first African American mayor of Chicago in 1983.
- Bobby Rush (Democrat): He was a co-founder of the Illinois Black Panther Party in 1968. He worked on programs like free breakfasts for children and health screenings. He served as a Chicago alderman before being elected to Congress in 1993. He focused on improving urban areas and supported gun control. He was known for voting with the Democratic Party most of the time. In 2000, he famously won against Barack Obama in a primary election.
Economy and Local Attractions
The district has faced economic challenges because many steel and manufacturing jobs left the South Side. The average household income in the district is lower than the national average, and the unemployment rate is higher. However, some middle-class Black neighborhoods, like Avalon Park and Chatham, have remained stable. The Hyde Park-Kenwood area is also more upscale.
Today, health care and higher education are important parts of the district's economy. There are several hospitals and universities in the area, including the University of Chicago in Hyde Park and the Illinois Institute of Technology (IIT) in Douglas.
The district also has many cultural and entertainment spots:
- U.S. Cellular Field: Home of the Chicago White Sox baseball team.
- DuSable Museum of African American History: Located in Chicago's Washington Park.
- First Midwest Bank Amphitheatre: A large outdoor music venue in Tinley Park.
- Cook County Forest Preserves: Large natural areas for outdoor activities.
- Chicago Gaelic Park: Hosts the annual Irish Fest.
Many places in the district are also listed on the National Register of Historic Places, like the Arthur H. Compton House and the Frederick C. Robie House. These places show the rich history and architecture of the area.
Presidential Election Results
The 1st congressional district has a long history of voting for Democratic presidential candidates, especially in recent decades.
| Election | District winner | Runner up | Other candidates |
|---|---|---|---|
| 1852 | Scott (W), 6,992 (42%) | PIERCE† (D), 6,948 (41%) | Hale (Free Soil), 2,885 (17%) |
| 1856 | Frémont (R), 18,247 (73%) | BUCHANAN† (D), 5,991 (24%) | Fillmore (American), 677 (3%) |
| 1860 | LINCOLN† (R), 21,436 (70%) | Douglas (D), 8,940 (29%) | Bell (Constitutional Union), 99 (0.3%); Breckinridge (D), 62 (0.2%) |
| 1864 | LINCOLN† (R), 18,667 (81%) | McClellan (D), 4,351 (19%) | |
| 1868 | GRANT† (R), 27,527 (59%) | Seymour (D), 19,104 (41%) | |
| 1872 ... 1948 |
[data missing] | ||
| 1952 | Stevenson (D), 99,224 (75%) | EISENHOWER† (R), 33,805 (25%) | |
| 1956 | Stevenson (D), 68,266 (64%) | EISENHOWER† (R), 38,827 (36%) | |
| 1960 | KENNEDY† (D), 75,938 (77.80%) | Nixon (R), 21,660 (22.19%)} | |
| 1964 | JOHNSON† (D), 150,953 (84.91%) | Goldwater (R), 26,823 (15.08%) | |
| 1968 | Humphrey (D), 138,835 (93%) | NIXON† (R), 10,081 (7%) | Wallace (AIP), 1,010 (1%) |
| 1972 | McGovern (D), 145,003 (90%) | NIXON† (R), 16,998 (10%) | |
| 1976 | CARTER (D), 130,882 (90%) | Ford† (R), 13,817 (10%) | |
| 1980 | Carter (D), 128,426 (91%) | REAGAN† (R), 6,633 (5%) | Anderson (Indep.), 3,092 (2%) |
| 1984 | Mondale (D), 196,351 (95%) | REAGAN† (R), 10,153 (5%) | |
| 1988 | Dukakis (D), 174,793 (95%) | G. H. W. BUSH† (R), 7,168 (4%) | |
| 1992 | CLINTON† (D), 214,104 (81%) | G. H. W. Bush (R), 32,803 (12%) | Perot (Indep.), 17,355 (7%) |
| 1996 | CLINTON† (D), 179,767 (85%) | Dole (R), 22,914 (11%) | Perot (Reform), 6,378 (3%) |
| 2000 | Gore† (D), 194,432 (87%) | G. W. BUSH (R), 24,276 (11%) | Nader (Green), 2,867 (1%) |
| 2004 | Kerry† (D), 234,086 (83%) | G. W. BUSH (R), 47,533 (17%) | |
| 2008 | OBAMA† (D) 287,240 (81%) | McCain (R) 66,840 (19%) | |
| 2012 | OBAMA† (D) 262,836 (79%) | Romney (R) 67,557 (20%) | |
| 2016 | Clinton† (D) 262,836 (79%) | TRUMP (R) 67,557 (20%) | |
| 2020 | BIDEN† (D) 246,946 (74%) | Trump (R) 82,594 (25%) | |
Images for kids
-
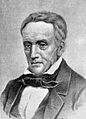
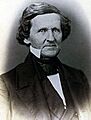
John Reynolds
-
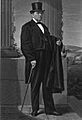
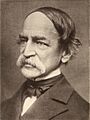
William Henry Bissell
-
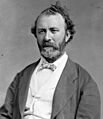
John Wentworth
-
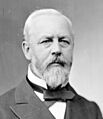
Norman B. Judd
-
Charles B. Farwell
-
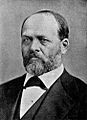
James Robert Mann
-
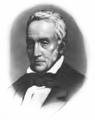
John Reynolds
-
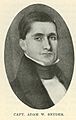
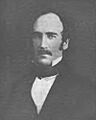
Adam W. Snyder
-
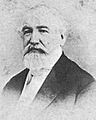
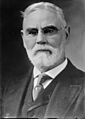
Robert Smith
-
Isaac N. Arnold
-
Bernard G. Caulfield
-
William Aldrich
-
Ransom W. Dunham
-
Abner Taylor
-

J. Frank Aldrich
-
James Robert Mann
-
Martin Emerich
-
Martin B. Madden
-
Illinois's 1st congressional district (2003–2013)
-
Illinois's 1st congressional district (2013–2023)
-
Jonathan Jackson
-
Illinois's 1st congressional district (since 2023)
,_Governor_of_Illinois.jpg)


_in_1916_(cropped).jpg)


.jpg)
.jpg)

_in_1916.jpg)
.jpg)


_(new_version).svg)
