List of California wildfires facts for kids


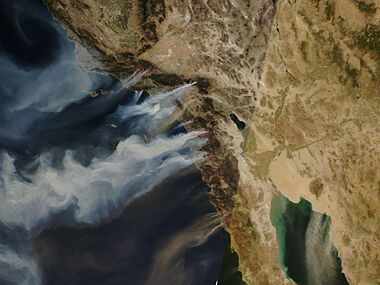
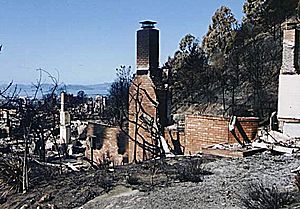
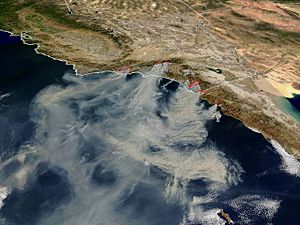
California is a beautiful state, but it often faces a big challenge: wildfires. These fires happen when dry weather, strong winds, and hot temperatures combine, especially from spring to late autumn. Wildfires can spread quickly and cause a lot of damage.
Historically, fires were a natural part of California's environment. Before the 1800s, huge areas of forests and shrublands would burn every year. Native Californians even used controlled fires to manage the land. This helped prevent really big, dangerous wildfires from taking over the state.
Since the early 2010s, wildfires in California have become more dangerous. This is due to more dry wood in forests, a growing population, and older power lines that are not always well-kept. These fires can be made worse by strong, dry winds. In Northern California, these are called Diablo winds. In Southern California, they are called Santa Ana winds.
Over 2.7 million people in California live in areas that are at high risk of fire. Most wildfires on state-protected lands are started by humans. The most common causes are equipment use, power lines, arson (fires started on purpose), and lightning.
A study from 2023 showed that these fires are harming California's natural environment. They are also disrupting the homes of many animals and plants. In 2020 and 2021, wildfires destroyed 30% of the homes for 50 different species. They also burned 10% of the homes for 100 other species.
Contents
Wildfire Statistics
Area Burned Each Year

Since 2001, the National Interagency Fire Center has kept better records of how much land burns each year in California.
| Year | Fires | Acres | Hectares | Ref |
|---|---|---|---|---|
| 2000 | 7,622 | 295,026 | 119,393 | |
| 2001 | 9,458 | 329,126 | 133,193 | |
| 2002 | 8,328 | 969,890 | 392,500 | |
| 2003 | 9,116 | 1,020,460 | 412,970 | |
| 2004 | 8,415 | 264,988 | 107,237 | |
| 2005 | 7,162 | 222,538 | 90,058 | |
| 2006 | 8,202 | 736,022 | 297,858 | |
| 2007 | 9,093 | 1,520,362 | 615,269 | |
| 2008 | 6,255 | 1,593,690 | 644,940 | |
| 2009 | 9,159 | 422,147 | 170,837 | |
| 2010 | 6,554 | 109,529 | 44,325 | |
| 2011 | 7,989 | 168,545 | 68,208 | |
| 2012 | 7,950 | 869,599 | 351,914 | |
| 2013 | 9,907 | 601,635 | 243,473 | |
| 2014 | 7,865 | 625,540 | 253,150 | |
| 2015 | 8,745 | 893,362 | 361,531 | |
| 2016 | 6,986 | 669,534 | 270,951 | |
| 2017 | 9,560 | 1,548,429 | 626,627 | |
| 2018 | 8,527 | 1,975,086 | 799,289 | |
| 2019 | 7,860 | 259,823 | 105,147 | |
| 2020 | 9,639 | 4,397,809 | 1,779,730 | |
| 2021 | 8,835 | 2,568,948 | 1,039,616 | |
| 2022 | 7,490 | 362,455 | 146,680 | |
| 2023 | 7,127 | 324,917 | 131,489 | |
| 2000-23 Average | 8,243 | 974,894 | 394,526 | |
| 2000-23 Middle Value | 8,265 | 647,537 | 262,049 |
Largest Wildfires
These are the 20 largest wildfires based on the area they burned. The information comes from the California Department of Forestry and Fire Protection.
| Name | County | Acres | Hectares | Start date | Structures | Deaths | Notes | |
|---|---|---|---|---|---|---|---|---|
| 1. | August Complex | Glenn, Lake, Mendocino, Tehama, Trinity, Shasta | 1,032,648 | 417,898 | August 2020 | 935 | 1 | |
| 2. | Dixie | Butte, Lassen, Plumas, Shasta, Tehama | 963,309 | 389,837 | July 2021 | 1,329 | 1 | This was the largest wildfire from a single cause in California's history. |
| 3. | Mendocino Complex | Mendocino, Lake, Colusa, Glenn | 459,123 | 185,800 | July 2018 | 280 | 1 | |
| 4. | Park | Butte, Tehama | 429,603 | 173,854 | July 2024 | 637 | 0 | This fire was the largest caused by arson. |
| 5. | SCU Lightning Complex | Santa Clara, Alameda, Contra Costa, San Joaquin, Merced, Stanislaus | 396,624 | 160,508 | August 2020 | 222 | 0 | |
| 6. | Creek | Fresno, Madera | 379,895 | 153,738 | September 2020 | 856 | 0 | |
| 7. | LNU Lightning Complex | Colusa, Lake, Napa, Sonoma, Solano, Yolo | 363,220 | 146,990 | August 2020 | 1,491 | 6 | |
| 8. | North Complex | Plumas, Butte | 318,935 | 129,068 | August 2020 | 2,352 | 15 | |
| 9. | Santiago Canyon | Orange, Riverside, San Diego | 300,000 | 120,000 | September 1889 | 0 | 0 | This fire happened before 1932, when fire records became more reliable. |
| 10. | Thomas | Ventura, Santa Barbara | 281,893 | 114,078 | December 2017 | 1,063 | 23 | This fire caused 2 direct deaths and 21 indirect deaths from later mudslides. |
| 11. | Cedar | San Diego | 273,246 | 110,579 | October 2003 | 2,820 | 15 | |
| 12. | Rush | Lassen | 271,911 | 110,038 | August 2012 | 0 | 0 | This fire also burned 43,666 acres (17,671 ha) in Nevada. |
| 13. | Rim | Tuolumne | 257,314 | 104,131 | August 2013 | 112 | 0 | |
| 14. | Zaca | Santa Barbara | 240,207 | 97,208 | July 2007 | 1 | 0 | |
| 15. | Carr | Shasta, Trinity | 229,651 | 92,936 | July 2018 | 1,614 | 8 | |
| 16. | Monument | Trinity | 223,124 | 90,295 | July 2021 | 50 | 0 | |
| 17. | Caldor | El Dorado, Amador, Alpine | 221,835 | 89,773 | August 2021 | 1,003 | 1 | |
| 18. | Matilija | Ventura | 220,000 | 89,000 | September 1932 | 0 | 0 | |
| 19. | River Complex | Siskiyou, Trinity | 199,343 | 80,671 | July 2021 | 122 | 0 | |
| 20. | Witch | San Diego | 197,990 | 80,120 | October 2007 | 1,650 | 2 |
Deadliest Wildfires
These are the 20 deadliest wildfires in California history. The information comes from the California Department of Forestry and Fire Protection.
| Name | County | Acres | Hectares | Start date | Structures | Deaths | Notes | |
|---|---|---|---|---|---|---|---|---|
| 1. | Camp | Butte | 153,336 | 62,050 | November 2018 | 18,804 | 85 | This fire was caused by Pacific Gas & Electric Co. |
| 2. | Griffith Park | Los Angeles | 47 | 19 | October 1933 | 0 | 29 | All deaths were workers fighting the fire. |
| 3. | Tunnel | Alameda | 1,600 | 650 | October 1991 | 2,900 | 25 | |
| 4. | Thomas | Ventura, Santa Barbara | 281,893 | 114,078 | December 2017 | 1,063 | 23 | This fire caused 2 direct deaths and 21 indirect deaths from later mudslides. |
| 5. | Tubbs | Napa, Sonoma | 36,807 | 14,895 | October 2017 | 5,643 | 22 | |
| 6. | North Complex | Plumas, Butte | 318,935 | 129,068 | August 2020 | 2,352 | 16 | Most of the people who died were from the towns of Berry Creek and Feather Falls. |
| 7. | Cedar | San Diego | 273,246 | 110,579 | October 2003 | 2,820 | 15 | |
| 8. | Rattlesnake | Glenn | 1,340 | 540 | July 1953 | 0 | 15 | All deaths were firefighters trying to escape the fire. |
| 9. | Loop | Los Angeles | 2,028 | 821 | November 1966 | 0 | 12 | All deaths were members of the El Cariso Hotshots, a firefighting team. |
| 10 | Hauser Creek | San Diego | 13,145 | 5,320 | October 1943 | 0 | 11 | |
| 11. | Inaja | San Diego | 43,904 | 17,767 | November 1956 | 0 | 11 | |
| 12. | Iron Alps Complex | Trinity | 105,855 | 42,838 | August 2008 | 10 | 10 | |
| 13. | Redwood Valley | Mendocino | 36,523 | 14,780 | October 2017 | 544 | 9 | |
| 14. | Harris | San Diego | 90,440 | 36,600 | October 2007 | 548 | 8 | |
| 15. | Canyon | Los Angeles | 22,197 | 8,983 | August 1968 | 0 | 8 | |
| 16. | Carr | Shasta, Trinity | 229,651 | 92,936 | July 2018 | 1,614 | 8 | |
| 17. | LNU Lightning Complex | Colusa, Lake, Napa, Sonoma, Solano, Yolo | 363,220 | 146,990 | August 2020 | 1,491 | 6 | |
| 18. | Atlas | Napa, Solano | 51,624 | 20,891 | October 2017 | 781 | 6 | |
| 19. | Old | San Bernardino | 91,281 | 36,940 | October 2003 | 1,003 | 6 | |
| 20. | Decker | Riverside | 1,425 | 577 | August 1959 | 1 | 6 |
Most Destructive Wildfires
These are the 20 wildfires that destroyed the most buildings. The information comes from the California Department of Forestry and Fire Protection.
| Name | County | Acres | Hectares | Start date | Structures | Deaths | Notes | |
|---|---|---|---|---|---|---|---|---|
| 1. | Camp | Butte | 153,336 | 62,050 | November 2018 | 18,804 | 86 | The town of Paradise was almost completely destroyed. |
| 2. | Tubbs | Napa, Sonoma | 36,807 | 14,895 | October 2017 | 5,643 | 22 | |
| 3. | Tunnel | Alameda | 1,600 | 650 | October 1991 | 2,900 | 25 | |
| 4. | Cedar | San Diego | 273,246 | 110,579 | October 2003 | 2,820 | 15 | |
| 5. | North Complex | Plumas, Butte | 318,935 | 129,068 | August 2020 | 2,352 | 15 | The towns of Berry Creek and Feather Falls were mostly destroyed. |
| 6. | Valley | Lake, Napa, Sonoma | 76,067 | 30,783 | September 2015 | 1,955 | 4 | |
| 7. | Witch | San Diego | 197,990 | 80,120 | October 2007 | 1,650 | 2 | |
| 8. | Woolsey | Ventura, Los Angeles | 96,949 | 39,234 | November 2018 | 1,643 | 3 | |
| 9. | Carr | Shasta, Trinity | 229,651 | 92,936 | July 2018 | 1,614 | 8 | |
| 10. | Glass | Napa, Sonoma | 67,484 | 27,310 | September 2020 | 1,520 | 0 | |
| 11. | LNU Lightning Complex | Colusa, Lake, Napa, Sonoma, Solano, Yolo | 363,220 | 146,990 | August 2020 | 1,491 | 6 | |
| 12. | CZU Lightning Complex | Santa Cruz, San Mateo | 86,509 | 35,009 | August 2020 | 1,490 | 1 | |
| 13. | Nuns | Sonoma | 54,382 | 22,008 | October 2017 | 1,355 | 3 | |
| 14. | Dixie | Butte, Lassen, Plumas, Shasta, Tehama | 963,309 | 389,837 | July 2021 | 1,329 | 1 | The town of Greenville was mostly destroyed. |
| 15. | Thomas | Ventura, Santa Barbara | 281,893 | 114,078 | December 2017 | 1,063 | 23 | This fire caused 2 direct deaths and 22 indirect deaths from mudslides. |
| 16. | Caldor | El Dorado, Amador, Alpine | 221,835 | 89,773 | August 2021 | 1,003 | 1 | The town of Grizzly Flats was mostly destroyed. |
| 17. | Old | San Bernardino | 91,281 | 36,940 | October 2003 | 1,003 | 6 | |
| 18. | Butte | Amador, Calaveras | 70,868 | 28,679 | September 2015 | 965 | 2 | |
| 19. | Jones | Shasta | 26,200 | 10,600 | October 1999 | 954 | 1 | |
| 20. | August Complex | Glenn, Lake, Mendocino, Tehama, Trinity, Shasta | 1,032,649 | 417,898 | August 2020 | 935 | 1 |
Areas Where Fires Happen Often
Some parts of California experience fires regularly. For example, in Oakland, fires have happened many times over the years. This includes major fires in 1923 and 1991.
Other areas like Orange County, Riverside County, San Bernardino County, and Los Angeles County also see repeated fires. These areas often have dry plants and hills that can easily catch fire, especially during droughts or hot summers. Fires have occurred in these areas in almost every decade since 1914.
Sometimes, lightning from thunderstorms can also start wildfires in these areas. Examples include the 1999 Megram Fire and the large 2008 California wildfires. The LNU and SCU Lightning Complex fires in 2020 were also started by lightning.
See also
- List of wildfires
- 2012–13 North American drought
- Wildfires in the United States
- Climate change in California
 | Janet Taylor Pickett |
 | Synthia Saint James |
 | Howardena Pindell |
 | Faith Ringgold |


